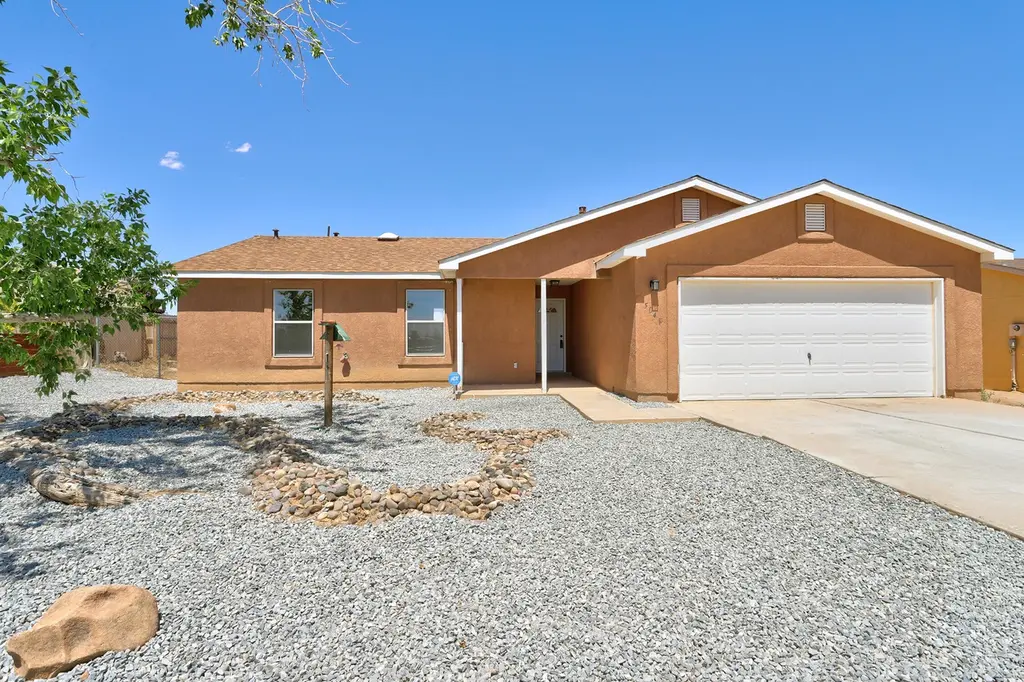
5041 27th Ave NE · Rio Rancho, NM
Flood risk 1/10 · Minimal
- FEMA flood zone
- X (unshaded)
- Chance of flooding over 30 yrs
- 0.0%
- Est. flood insurance / yr
- $507 – $1,088
Fire risk 4/10 · Minor
- Est. fire insurance / yr
- $706 – $1,312
Heat risk 5/10 · Moderate
- Hot days now (above 95°F)
- 7 days/yr
- Hot days in 30 yrs
- 18 days/yr
Wind risk 1/10 · Minimal
- Chance of severe wind over 30 yrs
- —
Air-quality risk 3/10 · Minor
- Unhealthy air days now
- 2 days/yr
- Unhealthy air days in 30 yrs
- 3 days/yr
Risk factors via First Street. Map © Google.
Why this score? — see what drove the D grade
The composite is a weighted blend of 9 inputs, each scored 0–100. Each bar is that input's sub-score; the figure is the points it added to the 100-point composite (weight × sub-score).
- ARV discount +15.0/15.0
- Cash flow +7.2/30.0
- Schools +5.2/10.0
- Rent growth +4.2/5.0
- Livability +3.6/5.0
- Condition / age +2.5/5.0
- DSCR +1.4/10.0
- 1% rule +0.9/10.0
- Appreciation +0.0/10.0
$370,000
🖨 Deal sheet 📄 Offer letter ✓ Due diligence
Listing remarks
Spacious and inviting 3-bedroom, 2-bath home filled with an abundance of natural light. The updated kitchen features brand-new stainless steel appliances, sleek Corian countertops, and modern fixtures, creating a stylish and functional space for everyday living and entertaining. Both bathrooms have been refreshed with updated sinks, fixtures, and contemporary lighting. Updated carpet and laminate flooring, lighting, interior doors, along with fresh interior paint, give the home a clean, move-in-ready feel. Plus the shingles have been replaced on the roof as of 3/26! Situated on a generous half-acre lot, the outdoor space offers a blank canvas with endless possibilities to design your ideal
Key facts
- 0.5 acre lot
- 2 garage spots
- Built 2001
Property features AI
Finance
- Financial info: Annual tax amount listed (see agent for details)
Exterior
- Parking: Attached garage; 2 garage spaces
- Utilities: Electricity connected; Sewer connected (septic tank); Public water
- Home design: Single-story; Faces south; Resale property
- Construction: Frame and stucco construction; Composition pitched roof; Builder: unknown
- Exterior features: Private yard; Covered patio; Patio; Back yard fencing; Landscaped lot
Interior
- Kitchen: Dishwasher; Free-standing gas range; Microwave; Refrigerator
- Bedrooms: Bedroom 3 (Main level); Bedroom 2 (Main level)
- Flooring: Carpet; Laminate
- Bathrooms: 1 full bathroom; 1 three-quarter bathroom
- Heating & cooling: Forced air heating; Refrigerated (central) cooling
- Interior features: Double pane insulated windows; Breakfast bar; Dual sinks; Multiple living areas; Main-level primary bedroom; Shower only; Separate shower; Walk-in closet(s)
- Laundry & utility: Washer hookup; Electric dryer hookup; Gas dryer hookup
Neighborhood map
What this means for you Summary
Snapshot
- This is a 3-bed/2.0-bath single-family listed at $370k.
Deal economics
- At list price, monthly cash flow is $-502 ($-6k/yr) — negative.
- To cash-flow at today's rent, offer at most $281k (24.0% below list).
- To meet the 1% rule (rent ≥ 1% of price), the offer needs to be $218k (41.0% below list).
- Recommended offer: $218k (41.0% below list) — sets the bar for 1% rule.
- Cap rate 4.7% vs local median 3.6% in Rio Rancho — top-decile yield for the area; either an underpriced asset or a hidden risk that comps aren't pricing in. Stress-test before assuming the spread holds.
Location & tenants
- Location reads 71/100 on livability (#17 in NM) — a middle-class / working-renter tenant base. Strengths: housing A+, cost of living A; Watch: schools C-, amenities D, commute F.
- Rio Rancho Public Schools (suburban): math 48% / reading 73% proficiency, ranked #4 of 29 in NM (top 14%) — acceptable for families but not a draw, mixed tenant base, ~2y average lease.
- Market conditions: Rents rising fast (+6.9%/yr); 1315 active listings in the ZIP; 3 comparable units currently listed for rent nearby; rentals lingering (median 44d on market — plan ~5-8 weeks vacancy on turnover, expect pricing pressure); 100% of comp listings sitting > 30 days — soft ceiling on asking rent; solid renter incomes; 1,278 units permitted in Sandoval County in 2024 (216 in 5+ unit buildings).
Forward outlook
- Local home prices are declining (-3.0%/yr); year-one equity from $3k of loan paydown is wiped out by about $11k of value loss. Plan a longer hold.
- Sandoval County population projected at +15% by 2050 — long-run rental-demand tailwind backs the buy-and-hold thesis.
Negotiation context
- It's been on market 52 days — a 3% lower offer ($359k) is reasonable based on typical stale-listing flexibility.
Risks & watch-outs
- Climate carrying-cost: extreme-heat days projected 7→18/yr by 2055 (HVAC capex compounding) — expect insurance premiums to compound above CPI over the hold.
Questions for the listing agent
- What do current leases actually rent for vs. the listed asking? Can we see a recent rent roll and the last 12 months of T-12 income?
- It's been on market 52 days. Have you received any prior offers? Is the seller open to a 41% concession, seller financing, or rate buy-down credit?
- Is there a deadline driving the sale (1031 exchange, divorce, estate, relocation)? That informs how much negotiation room exists.
- The area grade is low — what's the realistic commute time and amenity access for the typical tenant pool here? Any planned neighborhood developments (good or bad) we should know about?
- What's the average days-on-market for RENTAL listings here right now (not sales)? A rising rental-DOM trend means longer vacancies and softer asking-rent achievability than the comps imply.
- What's the recent tenant-quality profile in this submarket — average credit score on applications, eviction rate, late-payment / NSF rate, and stable-employment percentage? A property-management company in the area should have these aggregated.
- How much new for-sale + rental construction is in the pipeline within 1–3 miles? Heavy new supply typically softens prices + rents 12–24 months out; constrained supply supports both.
Investment metrics
- 1% rule
- 0.59% ✗
- Cap rate
- 4.66%
- Cash-on-cash
- -5.82%
- DSCR
- 0.74
- GRM
- 14.1
CMA / ARV
- ARV (median comp)
- $475,000
- List price
- $370,000
- Delta
- -22.11%
- Verdict
- UNDERPRICED
- Comps
- 3 within 1.0 mi
Show comp detail 1 sale within ~0.75 mi
| Address | Dist | Beds/Ba | Sqft | Sold | Price | $/sf | Match |
|---|---|---|---|---|---|---|---|
| 2504 Inca Rd NE | 0.38mi | 3/2.0 | 1,639 (-0%) | 3mo | $419,500 | $256 | 79 |
Match score weights: distance 35% · size 25% · config 20% · recency 20%. Top-matched comps best support the ARV.
Projected returns pro-forma
-3.0% appreciation · 6.88% rent growth · sell at horizon
- IRR
- -22.8%
- Equity multiple
- 0.20×
- Total profit
- $-83,253
- Equity at exit
- $55,168
- IRR
- -10.5%
- Equity multiple
- 0.28×
- Total profit
- $-75,025
- Equity at exit
- $31,991
Cash invested: $103,600 (down + closing). Projections, not guarantees.
Landlord ↔ Tenant lean methodology
- Overall (STATE)
- 55 Moderately Landlord-Leaning
- State New Mexico
- 55 Moderately Landlord-Leaning · D+3
- County
- — inherits STATE
- City
- — inherits STATE
ZIP-level market 87144
- Home prices YoY
- -30.8%
- Rents YoY
- 6.9%
- Active inventory
- 1315
- Price-to-rent
- 14.1×
Monthly cashflow live
- Estimated rent
- $2,182 medium interval (Pro) →
- Mortgage (P&I)
- −$1,940
- Tax from tax record
- −$131 /mo · $1,573/yr
- Insurance
- −$154
- HOA
- −$0
- Vacancy / Maint / Mgmt
- −$458
- Net cashflow
- $-502
Break-even live
UW: 25.0% down · 7.5% · 30yr · 1.5% tax · 5.0% vac · 8.0% maint · 8.0% mgmt
Financing live
Cash to close
- Down payment
- $92,500
- Closing costs
- $11,100
- Reserves months
- —
- Total cash needed
- —
Loan-product check · same deal, 3 products live
Conventional
25% down · 7.5% · 30yr
- Down + closing
- —
- Monthly P&I
- —
- Monthly cashflow
- —
- DSCR
- —
- Eligible?
- —
Personal DTI + credit; lowest rate.
DSCR
20% down · 8.5% · 30yr
- Down + closing
- —
- Monthly P&I
- —
- Monthly cashflow
- —
- DSCR
- —
- Eligible?
- —
No personal income docs; deal must DSCR.
Hard money
10% down · 12.0% · 12mo
- Down + closing
- —
- Monthly P&I
- —
- Monthly cashflow
- —
- DSCR
- —
- Eligible?
- —
Short-term bridge; refi at stabilization.
Rent comps 3 comps
| Address | Beds | Baths | Sqft | Rent | $/sqft | DOM | Units | Dist |
|---|---|---|---|---|---|---|---|---|
| 3258 Berkshire Rd NE Rio Rancho, NM | 3.0 | 2.0 | 1414 | $2,150 | $1.52 | 43d | 1 | 1.02mi |
| 3221 Berkshire Rd NE Rio Rancho, NM | 3.0 | 2.0 | 1414 | $2,100 | $1.49 | 43d | 1 | 1.08mi |
| 4248 Skyline Loop NE Rio Rancho, NM | 3.0 | 2.0 | 1310 | $2,100 | $1.60 | 43d | 1 | 1.08mi |
Listing history 16 events
-
2026-06-19price $370,000 Active 52 DOM
-
2026-06-18days on market $373,000 Active 52 DOM
-
2026-06-17days on market $373,000 Active 51 DOM
-
2026-06-16days on market $373,000 Active 50 DOM
-
2026-06-15days on market $373,000 Active 49 DOM
-
2026-06-13days on market $373,000 Active 47 DOM
-
2026-06-13days on market $373,000 Active 46 DOM
-
2026-06-10days on market $373,000 Active 44 DOM
-
2026-06-09days on market $373,000 Active 43 DOM
-
2026-06-08days on market $373,000 Active 42 DOM
-
2026-06-07pricedays on market $373,000 Active 41 DOM
-
2026-06-03days on market $375,000 Active 37 DOM
-
2026-06-02days on market $375,000 Active 36 DOM
-
2026-06-01days on market $375,000 Active 35 DOM
-
2026-05-31days on market $375,000 Active 34 DOM
-
2026-04-24$379,000 Active 752-char remark
ⓘ Source: listings_history table (triggers on properties + properties_extension) + one-shot
backfill from property_details.listing_events for pre-trigger history.
Tax reassessment forecast NM · Resets to sale price
- Current annual tax
- $1,573 · $131/mo
- Projected year-2 tax
- $2,960 · $247/mo
- Expected delta
- +$1,387/yr (+$116/mo · 88.1%)
ⓘ Screening estimate from a state-policy table — verify with the county assessor before closing.
Climate risk First Street
- Flood 1/10 Low FEMA zone X (unshaded) · 0% chance over 30 yrs
- Wildfire 4/10 Moderate
- Heat 5/10 Major 7 d/yr ≥95°F today · 18 d/yr by 30 yrs out
- Wind 1/10 Low
- Air quality 3/10 Moderate 2 unhealthy d/yr today · 3 by 30 yrs out
Nearby sold comps map
Loading sold comps map…
Walkable amenities ~0.75 mi
Loading nearby amenities…
Taxation est. · year 1
- Rental income
- $26,181
- − Mortgage interest
- −$20,726
- − Property taxes
- −$1,573
- − Insurance
- −$1,850
- − Repairs & maintenance
- −$2,094
- − Management
- −$2,094
- − Depreciation
- −$10,764
- Taxable loss
- −$12,921
- Est. tax savings @ 24.0%
- +$3,101
- After-tax cash flow
- $-2,923/yr
For passive investors: Depreciation is non-cash, so a rental often shows a tax loss while cash-flowing — sheltering income. Rental losses are passive: they offset passive income freely, and up to $25,000/yr can offset ordinary (W-2) income if you actively participate and your MAGI is under $100k (phasing out to $0 by $150k); unused losses carry forward. On sale, claimed depreciation is recaptured at up to 25%, and gains may owe capital-gains tax (a 1031 exchange can defer both). Figures are a year-1 estimate at your 24.0% rate — not tax advice; consult a CPA.
Schools (NCES district)
- District
- Rio Rancho Public Schools
- NCES district ID
- 3500010
- Math proficiency
- 48% ▲ 38.00%
- Reading proficiency
- 73% ▲ 48.00%
- Median HH income
- $59,410
- Composite
- 52.29/100
- National rank
- #1595
- State rank
- #4 of 29 in NM
Livability — Rio Rancho
- Score
- 71/100
- State rank
- #17
- US rank
- #7253
Category grades
Schools grade is shown separately in the Schools card above.
Census & demographics
- Census place
- Rio Rancho, NM
- County
- Sandoval County · 110,336 people
- City population
- 110,336
- Metro
- Albuquerque, NM
- Population (ZIP)
- 51,837
- Household income
- $94,550
- Rent vs Own
- Severe rent burden
- 528.0
Population outlook (Sandoval County) Hauer SSP2
- Today (2025)
- 155,072 people
- By 2030
- 161,714 · +4.3%
- By 2040
- 171,831 · +10.8%
- By 2050
- 178,536 · +15.1%
- By 2075
- 192,517 · +24.1%
- By 2100
- 197,952 · +27.7%
Race, ethnicity, and origin ACS 2023
- Neighborhood character
- Diverse neighborhood (Simpson 0.61)
- Race & ethnicity
- White 44% Hispanic / Latino 44% Two or more races 24% Native American 4% Black 3% Asian 1%
- Hispanic origin (detail)
- Mexican 23% Puerto Rican 1%
- Common ancestry
- Slovak 3% Lithuanian 3% Italian 2%
- Foreign-born
- 5% · Canada
- Languages at home
- 80% English-only · Spanish 16%
Political lean MEDSL · Sandoval
- 2024 margin
- Lean D (+5.8) · D 51.8% · R 46.0% · Other 2.2%
- 2008→2024 swing
- -7.0pp toward R · 2008: 12.8pp · 2024: 5.8pp
- All cycles
- 2024: D+5.8 2020: D+8.4 2016: D+2.7 2012: D+5.1 2008: D+12.8
Not yet ingested
- Civics
- —
Market trends
- HPI YoY
- ▼ -95.68%
- Current HPI
- 215.124
- Rent YoY
- ▲ 6.88%
- Metro
- Albuquerque, NM
- State GDP YoY
- —
- F500 in state
- 0
Price history
-2.4% since first listed5 events — show timeline
- 2026-06-18 Price Changed $370,000 Southwest MLS
- 2026-06-05 Price Changed $373,000 Southwest MLS
- 2026-05-29 Price Changed $375,000 Southwest MLS
- 2026-05-20 Price Changed $377,000 Southwest MLS
- 2026-04-24 Listed $379,000 Southwest MLS
Property tax history
+1.9%/yrLatest (2024): $1,573 · +3.1% YoY. Source: county tax records.
Cash-flow waterfall
monthlySold comps — $/sqft
last 12 mo · ≤1 miLoading sold comps…