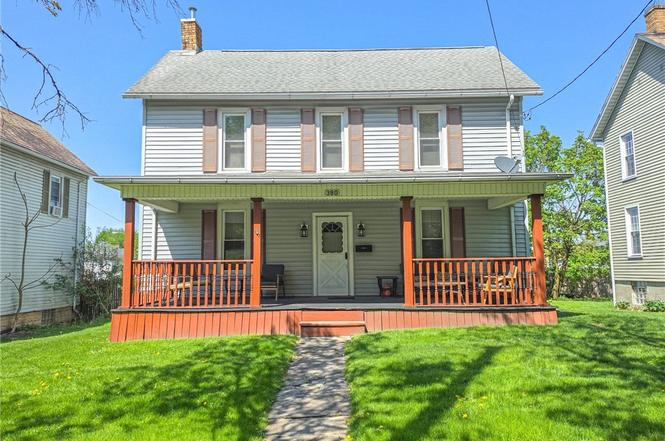
380 E Main St · East Palestine, OH
Flood risk 1/10 · Minimal
- FEMA flood zone
- X (unshaded)
- Chance of flooding over 30 yrs
- 0.0%
- Est. flood insurance / yr
- $473 – $860
Fire risk 1/10 · Minimal
- Est. fire insurance / yr
- $713 – $1,323
Heat risk 3/10 · Minor
- Hot days now (above 96°F)
- 7 days/yr
- Hot days in 30 yrs
- 18 days/yr
Wind risk 1/10 · Minimal
- Chance of severe wind over 30 yrs
- —
Air-quality risk 3/10 · Minor
- Unhealthy air days now
- 2 days/yr
- Unhealthy air days in 30 yrs
- 3 days/yr
Risk factors via First Street. Map © Google.
Why this score? — see what drove the C- grade
The composite is a weighted blend of 9 inputs, each scored 0–100. Each bar is that input's sub-score; the figure is the points it added to the 100-point composite (weight × sub-score).
- Cash flow +20.9/30.0
- ARV discount +8.9/15.0
- DSCR +6.6/10.0
- 1% rule +5.1/10.0
- Schools +4.5/10.0
- Livability +3.7/5.0
- Rent growth +2.5/5.0
- Condition / age +2.5/5.0
- Appreciation +0.0/10.0
$129,500
🖨 Deal sheet (PDF) 📄 Offer letter ✓ Due diligence
Listing remarks
Come see this beautifully updated home! The first floor boasts spacious rooms and high ceilings with a living room, formal dining room and kitchen. Eat-In Kitchen is warm and inviting with white cabinets, stainless appliances and newer flooring. Upstairs the large bath, has a laundry area with stacking washer and dryer, double sinks and great lighting! There are two bedrooms upstairs. The larger bedroom has the potential of being divided into two bedrooms. Great deck in the rear for grilling. 3 car garage has access from the alley in the rear. Other updated include furnace and A/C in 2020, roof 2014, newer windows and new carpet. All the appliances stay
Key facts
- Double sinks
- Great lighting
- Laundry area
Tags
Property features AI
Finance
- Other: Property listed by RE/MAX Valley Real Estate
Exterior
- Parking: Attached garage with 3 garage spaces; Additional parking and alley access; Garage door opener
- Utilities: Public water; Public sewer
- Home design: 2-story home; Updated/remodeled condition; Above-grade finished area approximately 1,306 (assessor)
- Construction: Block foundation; Block and vinyl siding construction; Asphalt roof; Built per public records
- Exterior features: Front porch; Deck; Lot dimensions approximately 50 x 160 feet
Interior
- Kitchen: Dishwasher; Microwave; Range; Refrigerator
- Bedrooms: Total of 5 rooms (includes bedrooms and living spaces)
- Bathrooms: 1 full bathroom
- Heating & cooling: Forced-air heating; Central air conditioning
- Interior features: Eat-in kitchen; Finished basement
- Laundry & utility: Washer and dryer (upper level); Water softener
Neighborhood map
What this means for you Summary
Snapshot
- This is a 2-bed/1.0-bath single-family listed at $130k.
Deal economics
- At list price, monthly cash flow is $180 ($2k/yr) — positive.
- The deal already cash-flows at list — no discount required.
- Meets the 1% rule at list price ($1k rent vs $130k).
- Recommended offer: $126k (3.0% below list) — sets the bar for market timing.
Location & tenants
- Location reads 73/100 on livability (#325 in OH) — a middle-class / working-renter tenant base. Strengths: crime A+, cost of living A+, housing A+; Watch: health & safety C-, employment D, amenities F.
- East Palestine City (town): math 50% / reading 57% proficiency, ranked #405 of 656 in OH (top 62%) — acceptable for families but not a draw, mixed tenant base, ~2y average lease.
- Market conditions: 23 active listings in the ZIP; 49 units permitted in Columbiana County in 2024 (0 in 5+ unit buildings).
- This rent runs 31% of the median local income ($51k/yr) — at the standard rent-burdened threshold; future hikes will face affordability resistance.
Forward outlook
- Local home prices are declining (-3.0%/yr); year-one equity from $895 of loan paydown is wiped out by about $4k of value loss. Plan a longer hold.
- Columbiana County population projected at -23% by 2050 — secular population decline; favor cash flow + early exit over multi-decade hold.
Negotiation context
- It's been on market 48 days — a 3% lower offer ($126k) is reasonable based on typical stale-listing flexibility.
Risks & watch-outs
- Watch-outs: built in 1909 — expect roof / HVAC / electrical / plumbing capex.
Questions for the listing agent
- It's been on market 48 days. Have you received any prior offers? Is the seller open to a 3% concession, seller financing, or rate buy-down credit?
- Built in 1909 — when were the roof, HVAC, electrical panel, plumbing, and water heater last replaced?
- Is there a deadline driving the sale (1031 exchange, divorce, estate, relocation)? That informs how much negotiation room exists.
- Schools are B-rated — typically a magnet for longer-tenancy family renters. What's the average tenant stay here, and is there a school-zone premium baked into asking?
- What's the average days-on-market for RENTAL listings here right now (not sales)? A rising rental-DOM trend means longer vacancies and softer asking-rent achievability than the comps imply.
- What's the recent tenant-quality profile in this submarket — average credit score on applications, eviction rate, late-payment / NSF rate, and stable-employment percentage? A property-management company in the area should have these aggregated.
- How much new for-sale + rental construction is in the pipeline within 1–3 miles? Heavy new supply typically softens prices + rents 12–24 months out; constrained supply supports both.
Investment metrics
- 1% rule
- 1.01% ✓
- Cap rate
- 7.96%
- Cash-on-cash
- 5.94%
- DSCR
- 1.26
- GRM
- 8.3
CMA / ARV
- ARV (median comp)
- $133,536
- List price
- $129,500
- Delta
- -3.02%
- Verdict
- FAIR
- Comps
- 20 within 1.0 mi
Show comp detail 12 sales within ~0.75 mi
| Address | Dist | Beds/Ba | Sqft | Sold | Price | $/sf | Match |
|---|---|---|---|---|---|---|---|
| 274 Alice St | 0.13mi | 3/1.0 (+1) | 1,344 (+3%) | 10mo | $120,000 | $89 | 76 |
| 850 E Taggart St | 0.42mi | 3/1.0 (+1) | 1,280 (-2%) | 4mo | $132,500 | $104 | 69 |
| 360 E Clark St | 0.25mi | 3/1.5 (+1) | 1,386 (+6%) | 11mo | $45,000 | $32 | 62 |
| 188 Garfield Ave | 0.23mi | 2/2.0 | 1,141 (-13%) | 9mo | $124,900 | $109 | 57 |
| 55 West St | 0.58mi | 2/1.0 | 1,184 (-9%) | 1mo | $80,000 | $68 | 56 |
| 185 E North Ave | 0.41mi | 3/1.5 (+1) | 1,428 (+9%) | 3mo | $40,000 | $28 | 56 |
| 382 E Martin St | 0.32mi | 3/1.0 (+1) | 1,164 (-11%) | 7mo | $35,000 | $30 | 56 |
| 167 S Market St | 0.41mi | 2/1.0 | 1,496 (+14%) | 2mo | $39,000 | $26 | 55 |
| 389 E Martin St | 0.29mi | 3/2.0 (+1) | 1,176 (-10%) | 10mo | $63,000 | $54 | 53 |
| 442 East St | 0.65mi | 3/1.0 (+1) | 1,232 (-6%) | 10mo | $112,000 | $91 | 47 |
| 471 E North Ave | 0.38mi | 3/2.0 (+1) | 1,120 (-14%) | 11mo | $114,162 | $102 | 41 |
| 440 Lyons Ave | 0.73mi | 3/3.0 (+1) | 1,428 (+9%) | 11mo | $285,000 | $200 | 28 |
Match score weights: distance 35% · size 25% · config 20% · recency 20%. Top-matched comps best support the ARV.
Projected returns pro-forma
-3.0% appreciation · 3.0% rent growth · sell at horizon
- IRR
- -7.1%
- Equity multiple
- 0.74×
- Total profit
- $-9,551
- Equity at exit
- $19,309
- IRR
- 2.5%
- Equity multiple
- 1.18×
- Total profit
- $6,389
- Equity at exit
- $11,197
Cash invested: $36,260 (down + closing). Projections, not guarantees.
Landlord ↔ Tenant lean methodology
- Overall (STATE)
- 73 Landlord-Friendly
- State Ohio
- 73 Landlord-Friendly · R+6
- County
- — inherits STATE
- City
- — inherits STATE
ZIP-level market 44413
- Home prices YoY
- -20.4%
- Active inventory
- 23
- Price-to-rent
- 8.3×
Monthly cashflow live
- Estimated rent
- $1,306 medium interval (Pro) →
- Mortgage (P&I)
- −$679
- Tax from tax record
- −$119 /mo · $1,431/yr
- Insurance
- −$54
- HOA
- −$0
- Vacancy / Maint / Mgmt
- −$274
- Net cashflow
- $180
Break-even live
Sensitivity live
| Price | -10% $253 | -5% $216 | +0% $180 | +5% $143 | +10% $106 |
|---|---|---|---|---|---|
| Rent | -10% $76 | -5% $128 | +0% $180 | +5% $231 | +10% $283 |
| Rate | -1.0pp $245 | -0.5pp $213 | base $180 | +0.5pp $146 | +1.0pp $112 |
UW: 25.0% down · 7.5% · 30yr · 1.5% tax · 5.0% vac · 8.0% maint · 8.0% mgmt
Financing live
Cash to close
- Down payment
- $32,375
- Closing costs
- $3,885
- Reserves months
- —
- Total cash needed
- —
Loan-product check · same deal, 3 products live
Conventional
25% down · 7.5% · 30yr
- Down + closing
- —
- Monthly P&I
- —
- Monthly cashflow
- —
- DSCR
- —
- Eligible?
- —
Personal DTI + credit; lowest rate.
DSCR
20% down · 8.5% · 30yr
- Down + closing
- —
- Monthly P&I
- —
- Monthly cashflow
- —
- DSCR
- —
- Eligible?
- —
No personal income docs; deal must DSCR.
Hard money
10% down · 12.0% · 12mo
- Down + closing
- —
- Monthly P&I
- —
- Monthly cashflow
- —
- DSCR
- —
- Eligible?
- —
Short-term bridge; refi at stabilization.
Listing history 17 events
-
2026-06-18status $129,500 Pending 48 DOM
-
2026-06-18days on market $129,500 Contingent 48 DOM
-
2026-06-17days on market $129,500 Contingent 47 DOM
-
2026-06-16days on market $129,500 Contingent 46 DOM
-
2026-06-15days on market $129,500 Contingent 45 DOM
-
2026-06-13days on market $129,500 Contingent 43 DOM
-
2026-06-12days on market $129,500 Contingent 42 DOM
-
2026-06-09days on market $129,500 Contingent 39 DOM
-
2026-06-08days on market $129,500 Contingent 38 DOM
-
2026-06-08days on market $129,500 Contingent 37 DOM
-
2026-06-05days on market $129,500 Contingent 35 DOM
-
2026-06-04days on market $129,500 Contingent 33 DOM
-
2026-06-02days on market $129,500 Contingent 32 DOM
-
2026-06-01days on market $129,500 Contingent 31 DOM
-
2026-05-31days on market $129,500 Contingent 30 DOM
-
2026-05-12historical Contingent 662-char remark
-
2026-05-01$129,500 Active 662-char remark
ⓘ Source: listings_history table (triggers on properties + properties_extension) + one-shot
backfill from property_details.listing_events for pre-trigger history.
Tax reassessment forecast OH · Partial reset (capped growth)
- Current annual tax
- $1,431 · $119/mo
- Projected year-2 tax
- $1,726 · $144/mo
- Expected delta
- +$295/yr (+$25/mo · 20.6%)
ⓘ Screening estimate from a state-policy table — verify with the county assessor before closing.
Climate risk First Street
- Flood 1/10 Low FEMA zone X (unshaded) · 0% chance over 30 yrs
- Wildfire 1/10 Low
- Heat 3/10 Moderate 7 d/yr ≥96°F today · 18 d/yr by 30 yrs out
- Wind 1/10 Low
- Air quality 3/10 Moderate 2 unhealthy d/yr today · 3 by 30 yrs out
Nearby sold comps map
Loading sold comps map…
Walkable amenities ~0.75 mi
Loading nearby amenities…
Taxation est. · year 1
- Rental income
- $15,675
- − Mortgage interest
- −$7,254
- − Property taxes
- −$1,431
- − Insurance
- −$648
- − Repairs & maintenance
- −$1,254
- − Management
- −$1,254
- − Depreciation
- −$3,767
- Taxable income
- $67
- Est. tax owed @ 24.0%
- −$16
- After-tax cash flow
- $2,139/yr
For passive investors: Depreciation is non-cash, so a rental often shows a tax loss while cash-flowing — sheltering income. Rental losses are passive: they offset passive income freely, and up to $25,000/yr can offset ordinary (W-2) income if you actively participate and your MAGI is under $100k (phasing out to $0 by $150k); unused losses carry forward. On sale, claimed depreciation is recaptured at up to 25%, and gains may owe capital-gains tax (a 1031 exchange can defer both). Figures are a year-1 estimate at your 24.0% rate — not tax advice; consult a CPA.
Schools (NCES district)
- District
- East Palestine City
- NCES district ID
- 3904392
- Math proficiency
- 50% ▼ -15.00%
- Reading proficiency
- 57% ▼ -14.00%
- Median HH income
- $41,573
- Composite
- 44.86/100
- National rank
- #2726
- State rank
- #405 of 656 in OH
Livability — East Palestine
- Score
- 73/100
- State rank
- #325
- US rank
- #5335
Category grades
Schools grade is shown separately in the Schools card above.
Census & demographics
- Census place
- East Palestine, OH
- County
- Columbiana · 99,532 people
- City population
- 7,329
- Population (ZIP)
- 7,329
- Household income
- $51,071
- Rent vs Own
- Severe rent burden
- 11.1
Population outlook (Columbiana County) Hauer SSP2
- Today (2025)
- 98,353 people
- By 2030
- 94,225 · -4.2%
- By 2040
- 85,169 · -13.4%
- By 2050
- 76,157 · -22.6%
- By 2075
- 58,451 · -40.6%
- By 2100
- 42,805 · -56.5%
Race, ethnicity, and origin ACS 2023
- Neighborhood character
- Predominantly White (92%)
- Race & ethnicity
- White 92% Two or more races 5% Hispanic / Latino 4%
- Common ancestry
- Serbian 3% Iranian 2% Romanian 2%
- Foreign-born
- 0% · Canada
- Languages at home
- 98% English-only · German/W. Germanic 1% Spanish 1%
Political lean MEDSL · Columbiana
- 2024 margin
- Solid R (+49.0) · D 25.1% · R 74.1%
- 2008→2024 swing
- -41.4pp toward R · 2008: -7.6pp · 2024: -49.0pp
- All cycles
- 2024: R+49.0 2020: R+44.9 2016: R+41.6 2012: R+12.0 2008: R+7.6
Not yet ingested
- Civics
- —
Market trends
- HPI YoY
- ▼ -48.19%
- Current HPI
- 188.3714
- Rent YoY
- —
- Metro
- —
- State GDP YoY
- ▲ 1.98%
- F500 in state
- 48
Industry mix (Fortune 500 HQ in OH)
| Industry | F500 HQs | Revenue |
|---|---|---|
| Insurance | 3 | $145B |
|
||
| Industrial Machinery | 3 | $49B |
|
||
| Financial Services | 3 | $24B |
|
||
| Consumer Goods | 2 | $93B |
|
||
| Aerospace / Defense | 2 | $47B |
|
||
| Utilities | 2 | $33B |
|
||
Price history
3 events — show timeline
- 2026-06-18 Pending — MLSNOW
- 2026-05-12 Contingent — MLSNOW
- 2026-05-01 Listed $129,500 MLSNOW
Property tax history
+1.3%/yrLatest (2025): $1,431 · +5.9% YoY. Source: county tax records.
Cash-flow waterfall
monthlySold comps — $/sqft
last 12 mo · ≤1 miLoading sold comps…