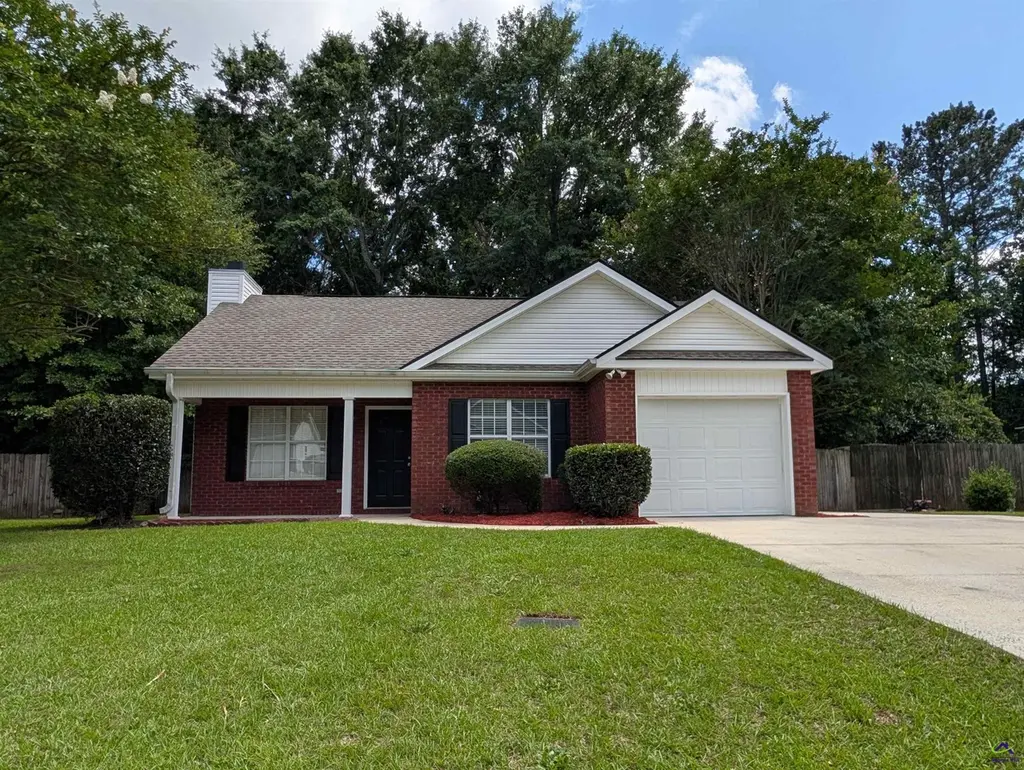
112 Willis Creek Rd · Warner Robins, GA
Flood risk 1/10 · Minimal
- FEMA flood zone
- X (unshaded)
- Chance of flooding over 30 yrs
- 0.0%
- Est. flood insurance / yr
- $507 – $1,088
Fire risk 3/10 · Minor
- Est. fire insurance / yr
- $963 – $1,789
Heat risk 6/10 · Moderate
- Hot days now (above 108°F)
- 6 days/yr
- Hot days in 30 yrs
- 15 days/yr
Wind risk 6/10 · Moderate
- Chance of severe wind over 30 yrs
- 68.0%
Air-quality risk 3/10 · Minor
- Unhealthy air days now
- 2 days/yr
- Unhealthy air days in 30 yrs
- 3 days/yr
Risk factors via First Street. Map © Google.
Why this score? — see what drove the D- grade
The composite is a weighted blend of 9 inputs, each scored 0–100. Each bar is that input's sub-score; the figure is the points it added to the 100-point composite (weight × sub-score).
- Cash flow +13.3/30.0
- ARV discount +5.7/15.0
- DSCR +4.0/10.0
- Schools +3.9/10.0
- Livability +3.2/5.0
- 1% rule +2.9/10.0
- Rent growth +2.9/5.0
- Condition / age +2.5/5.0
- Appreciation +0.0/10.0
$212,000
🖨 Deal sheet 📄 Offer letter ✓ Due diligence
Listing remarks MLS
Cute as can be! Great location and quiet neighborhood. Large living room with laminate floors, 3 bedrooms, 2 baths. Sold AS IS. Buyer has 7 day inspection period upon receiving ratified contract. Buyer is responsible for own title insurance. Seller will not make any repairs based on buyers inspections.
Key facts
- Recent updates
- New light fixtures
- Prime location
Tags
Property features AI
Finance
- Other: No pool
- Financial info: Financial details not provided
- HOA & community: Subdivision: Willis Creek
Exterior
- Parking: Detached garage (1 covered garage space, 1 total parking space)
- Security: Security information not provided
- Utilities: Public water; Public sewer
- Home design: Single-family residence; One story
- Construction: Vinyl siding and brick exterior; Slab foundation; Built details not provided
- Exterior features: Privacy fencing; Lot about 0.7 acre
Interior
- Kitchen: Disposal; Dishwasher; Microwave; Refrigerator; Range
- Bedrooms: Bedrooms information not provided
- Flooring: Carpet; Tile; Laminate
- Bathrooms: 2 full bathrooms
- Heating & cooling: Central heating; Central air conditioning
- Interior features: Ceiling fans; Fireplace
- Laundry & utility: Laundry information not provided
Neighborhood map
What this means for you Summary
Snapshot
- This is a 3-bed/2.0-bath single-family listed at $212k.
Deal economics
- At list price, monthly cash flow is $-1 ($-13/yr) — negative.
- To cash-flow at today's rent, offer at most $212k (0.1% below list).
- To meet the 1% rule (rent ≥ 1% of price), the offer needs to be $168k (20.9% below list).
- Recommended offer: $168k (20.9% below list) — sets the bar for 1% rule.
- Cap rate 6.3% vs local median 4.9% in Warner Robins — meaningfully above typical; check what's discounted (condition, days-on-market, listing class) to confirm the premium yield is real.
Location & tenants
- Location reads 65/100 on livability (#227 in GA) — a middle-class / working-renter tenant base. Strengths: cost of living A+, housing A+, health & safety A+; Watch: employment D+, crime F, amenities F.
- Houston County (urban): math 43% / reading 46% proficiency, ranked #23 of 174 in GA (top 13%) — families likely to look elsewhere, expect single-tenant / working-renter base with shorter leases.
- Zoned schools: Shirley Hills Elementary School (math 44% / reading 52%, grade D, #289 of 1,228 statewide, top 24%, 545 students, 84% FRL); Warner Robins Middle School (math 25% / reading 37%, grade F, #237 of 470 statewide, top 51%, 813 students, 84% FRL) — zoned schools average 84% FRL vs 46% district-wide (38 pts higher); higher-poverty schools than district average — tighter screening recommended.
- Market conditions: Rents rising (+1.7%/yr); 286 active listings in the ZIP; 30 comparable units currently listed for rent nearby; rentals at typical pace (median 21d on market — plan ~3-4 weeks tenant-placement turnaround); solid renter incomes; 1,545 units permitted in Houston County in 2024 (336 in 5+ unit buildings).
Forward outlook
- Local home prices are declining (-3.0%/yr); year-one equity from $1k of loan paydown is wiped out by about $6k of value loss. Plan a longer hold.
- Houston County population projected at +22% by 2050 — long-run rental-demand tailwind backs the buy-and-hold thesis.
Negotiation context
- Only 13 days on market — expect competitive offers; lowballing is unlikely to land.
- 2 sale attempts since 8y ago with the ask held roughly flat each time — persistent listings suggest the price (not the market) is what's stuck; bring a comps-based counter.
- Current owner paid $85k; list at $212k implies a 149% gain — meaningful room to come down on a strong offer.
Risks & watch-outs
- Climate carrying-cost: major wind risk, 68% chance of damaging wind over 30y; extreme-heat days projected 6→15/yr by 2055 (HVAC capex compounding) — expect insurance premiums to compound above CPI over the hold.
Questions for the listing agent
- What do current leases actually rent for vs. the listed asking? Can we see a recent rent roll and the last 12 months of T-12 income?
- Is there a deadline driving the sale (1031 exchange, divorce, estate, relocation)? That informs how much negotiation room exists.
- Schools are D-rated, which usually means shorter tenancies and higher turnover. Who's the typical renter profile here, and what's been the actual vacancy rate?
- Crime grade is F in this area — have there been break-ins, vandalism, or insurance claims at this property in the last 3 years? What carrier currently insures it and at what premium?
- The area grade is low — what's the realistic commute time and amenity access for the typical tenant pool here? Any planned neighborhood developments (good or bad) we should know about?
- What's the average days-on-market for RENTAL listings here right now (not sales)? A rising rental-DOM trend means longer vacancies and softer asking-rent achievability than the comps imply.
- What's the recent tenant-quality profile in this submarket — average credit score on applications, eviction rate, late-payment / NSF rate, and stable-employment percentage? A property-management company in the area should have these aggregated.
- How much new for-sale + rental construction is in the pipeline within 1–3 miles? Heavy new supply typically softens prices + rents 12–24 months out; constrained supply supports both.
Investment metrics
- 1% rule
- 0.79% ✗
- Cap rate
- 6.29%
- Cash-on-cash
- -0.02%
- DSCR
- 1.00
- GRM
- 10.5
CMA / ARV
- ARV (on-the-fly)
- $203,643
- Comps found
- 12
Show comp detail 12 sales within ~0.75 mi
| Address | Dist | Beds/Ba | Sqft | Sold | Price | $/sf | Match |
|---|---|---|---|---|---|---|---|
| 111 Willis Creek Rd | 0.04mi | 3/2.0 | 1,320 (-1%) | 16mo | $205,000 | $155 | 83 |
| 205 Willis Creek Rd Rd | 0.21mi | 3/2.0 | 1,357 (+2%) | 12mo | $199,000 | $147 | 77 |
| 103 Meadow Ct | 0.41mi | 3/2.0 | 1,338 (+0%) | 4mo | $210,000 | $157 | 77 |
| 224 Willis Creek Dr | 0.34mi | 3/2.0 | 1,385 (+4%) | 15mo | $212,000 | $153 | 65 |
| 111 Chadwyck Ln | 0.69mi | 3/2.0 | 1,259 (-5%) | 1mo | $180,000 | $143 | 58 |
| 209 Bryson Way | 0.74mi | 3/2.0 | 1,370 (+3%) | 4mo | $215,000 | $157 | 57 |
| 213 Kentshire Ln | 0.74mi | 3/2.0 | 1,332 (+0%) | 12mo | $195,000 | $146 | 56 |
| 107 Buckskin Dr | 0.51mi | 3/2.0 | 1,455 (+9%) | 9mo | $195,000 | $134 | 53 |
| 1027 Feagin Mill Rd | 0.56mi | 3/2.0 | 1,414 (+6%) | 14mo | $182,000 | $129 | 52 |
| 306 Bryson Way | 0.73mi | 3/2.0 | 1,374 (+3%) | 11mo | $223,000 | $162 | 51 |
| 210 Kentshire Dr | 0.72mi | 3/2.0 | 1,199 (-10%) | 13mo | $162,500 | $136 | 39 |
| 206 Rigby Ct | 0.72mi | 3/2.0 | 1,527 (+15%) | 14mo | $250,000 | $164 | 30 |
Match score weights: distance 35% · size 25% · config 20% · recency 20%. Top-matched comps best support the ARV.
Projected returns pro-forma
-3.0% appreciation · 1.67% rent growth · sell at horizon
- IRR
- -17.7%
- Equity multiple
- 0.38×
- Total profit
- $-36,700
- Equity at exit
- $31,610
- IRR
- -12.4%
- Equity multiple
- 0.31×
- Total profit
- $-41,144
- Equity at exit
- $18,330
Cash invested: $59,360 (down + closing). Projections, not guarantees.
Landlord ↔ Tenant lean methodology
- Overall (STATE)
- 90 Strongly Landlord-Friendly
- State Georgia
- 90 Strongly Landlord-Friendly · R+3
- County
- — inherits STATE
- City
- — inherits STATE
ZIP-level market 31088
- Rents YoY
- 1.7%
- Active inventory
- 286
- Price-to-rent
- 10.5×
Monthly cashflow live
- Estimated rent
- $1,678 high interval (Pro) →
- Mortgage (P&I)
- −$1,112
- Tax from tax record
- −$126 /mo · $1,516/yr
- Insurance
- −$88
- HOA
- −$0
- Vacancy / Maint / Mgmt
- −$352
- Net cashflow
- $-1
Break-even live
UW: 25.0% down · 7.5% · 30yr · 1.5% tax · 5.0% vac · 8.0% maint · 8.0% mgmt
Financing live
Cash to close
- Down payment
- $53,000
- Closing costs
- $6,360
- Reserves months
- —
- Total cash needed
- —
Loan-product check · same deal, 3 products live
Conventional
25% down · 7.5% · 30yr
- Down + closing
- —
- Monthly P&I
- —
- Monthly cashflow
- —
- DSCR
- —
- Eligible?
- —
Personal DTI + credit; lowest rate.
DSCR
20% down · 8.5% · 30yr
- Down + closing
- —
- Monthly P&I
- —
- Monthly cashflow
- —
- DSCR
- —
- Eligible?
- —
No personal income docs; deal must DSCR.
Hard money
10% down · 12.0% · 12mo
- Down + closing
- —
- Monthly P&I
- —
- Monthly cashflow
- —
- DSCR
- —
- Eligible?
- —
Short-term bridge; refi at stabilization.
Rent comps 30 comps
| Address | Beds | Baths | Sqft | Rent | $/sqft | DOM | Units | Dist |
|---|---|---|---|---|---|---|---|---|
| 91 Bass Rd Warner Robins, GA | 1.0–3.0 | 1.0–2.5 | 1008 | $2,199 | $2.18 | 13d | 11 | 0.54mi |
| 108 Crossfield Dr Warner Robins, GA | 3.0 | 2.0 | 1548 | $1,795 | $1.16 | 20d | 1 | 0.66mi |
| 203 Bryson Way Warner Robins, GA | 3.0 | 2.0 | 1858 | $1,850 | $1.00 | 43d | 1 | 0.72mi |
| 615 Cedarwood Dr Unit 611 Bonaire, GA | 3.0 | 1.0 | 902 | $1,095 | $1.21 | 20d | 1 | 0.73mi |
| 120 Chadwyck Cir Bonaire, GA | 3.0 | 2.0 | 1266 | $1,650 | $1.30 | 20d | 1 | 0.80mi |
| 614 Cedarwood Dr Bonaire, GA | 3.0 | 1.0 | 902 | $925 | $1.03 | 20d | 1 | 0.80mi |
| 627 Maplewood Dr Bonaire, GA | 3.0 | 2.0 | 1080 | $975 | $0.90 | 20d | 1 | 0.81mi |
| 642 Maplewood Dr Bonaire, GA | 3.0 | 2.0 | 1100 | $1,400 | $1.27 | 43d | 1 | 0.82mi |
| 104 Melissa Ln Warner Robins, GA | 3.0 | 2.0 | 1372 | $1,675 | $1.22 | 44d | 1 | 0.85mi |
| 1010 S Houston Lake Rd Warner Robins, GA | 1.0–3.0 | 1.0–2.0 | 1088 | $1,572 | $1.44 | 13d | 23 | 0.85mi |
| 100 Strawbridge Ln Bonaire, GA | 3.0 | 2.0 | 1248 | $1,600 | $1.28 | 20d | 1 | 0.93mi |
| 100 Strawbridge Ln Bonaire, GA | 3.0 | 2.0 | 1248 | $1,600 | $1.28 | 43d | 1 | 0.93mi |
| 109 Leisure Pointe Cv Warner Robins, GA | 4.0 | 2.5 | 1682 | $1,925 | $1.14 | 43d | 1 | 0.95mi |
| 106 Leisure Pointe Cv Warner Robins, GA | 4.0 | 2.5 | 1682 | $1,950 | $1.16 | 13d | 1 | 0.98mi |
| 106 Leisure Pointe Cv Warner Robins, GA | 4.0 | 2.5 | 1682 | $2,000 | $1.19 | 43d | 1 | 0.98mi |
| 210 Strawbridge Ln Bonaire, GA | 3.0 | 2.0 | 1214 | $1,600 | $1.32 | 20d | 1 | 1.02mi |
| 101 Webster Way Warner Robins, GA | 3.0 | 2.0 | 1320 | $1,650 | $1.25 | 43d | 1 | 1.03mi |
| 102 Duxbury Ct Bonaire, GA | 3.0 | 2.0 | 1725 | $1,975 | $1.14 | 20d | 1 | 1.05mi |
| 406 Haverhill Cir Warner Robins, GA | 3.0 | 2.0 | 1279 | $1,550 | $1.21 | 43d | 1 | 1.05mi |
| 251 Randy Cir Warner Robins, GA | 3.0 | 2.0 | 1025 | $1,275 | $1.24 | 20d | 1 | 1.06mi |
| 116 Webster Way Warner Robins, GA | 2.0 | 2.0 | 1320 | $1,650 | $1.25 | 43d | 1 | 1.08mi |
| 132 Cathy Ct Warner Robins, GA | 3.0 | 2.0 | 1428 | $1,450 | $1.02 | 13d | 1 | 1.16mi |
| 132 Cathy Ct Warner Robins, GA | 3.0 | 1.5 | 1428 | $1,450 | $1.02 | 20d | 1 | 1.16mi |
| 115 Cheryl Blvd Warner Robins, GA | 3.0 | 2.0 | 1328 | $1,500 | $1.13 | 13d | 1 | 1.27mi |
| 115 Cheryl Blvd Warner Robins, GA | 3.0 | 2.0 | 1328 | $1,500 | $1.13 | 20d | 1 | 1.27mi |
| 113 Gray Fox Xing Bonaire, GA | 4.0 | 2.0 | 1717 | $2,200 | $1.28 | 20d | 1 | 1.31mi |
| 800 Leisure Lake Dr Warner Robins, GA | 1.0–2.0 | 1.0–2.0 | 950 | $1,365 | $1.44 | 13d | 34 | 1.33mi |
| 121 Highland Dr Warner Robins, GA | 3.0 | 2.0 | 1712 | $1,795 | $1.05 | 43d | 1 | 1.38mi |
| 121 Highland Dr Warner Robins, GA | 3.0 | 2.0 | 1712 | $1,795 | $1.05 | 20d | 1 | 1.38mi |
| 202 Self St Warner Robins, GA | 3.0 | 2.0 | 1294 | $1,450 | $1.12 | 43d | 1 | 1.49mi |
Listing history 12 events
-
2026-06-19days on market $212,000 Active 13 DOM
-
2026-06-18days on market $212,000 Active 12 DOM
-
2026-06-17days on market $212,000 Active 11 DOM
-
2026-06-16days on market $212,000 Active 10 DOM
-
2026-06-15days on market $212,000 Active 9 DOM
-
2026-06-14days on market $212,000 Active 7 DOM
-
2026-06-13days on market $212,000 Active 6 DOM
-
2026-06-10days on market $212,000 Active 4 DOM
-
2026-06-09days on market $212,000 Active 3 DOM
-
2026-06-08days on market $212,000 Active 2 DOM
-
2026-06-07remarks 286-char remark
-
2026-06-07$212,000 Active 1 DOM
ⓘ Source: listings_history table (triggers on properties + properties_extension) + one-shot
backfill from property_details.listing_events for pre-trigger history.
Tax reassessment forecast GA · Resets to sale price
- Current annual tax
- $1,516 · $126/mo
- Projected year-2 tax
- $1,950 · $163/mo
- Expected delta
- +$434/yr (+$36/mo · 28.7%)
ⓘ Screening estimate from a state-policy table — verify with the county assessor before closing.
Climate risk First Street
- Flood 1/10 Low FEMA zone X (unshaded) · 0% chance over 30 yrs
- Wildfire 3/10 Moderate
- Heat 6/10 Major 6 d/yr ≥108°F today · 15 d/yr by 30 yrs out
- Wind 6/10 Major 68% chance of damaging wind over 30 yrs
- Air quality 3/10 Moderate 2 unhealthy d/yr today · 3 by 30 yrs out
Nearby sold comps map
Loading sold comps map…
Walkable amenities ~0.75 mi
Loading nearby amenities…
Taxation est. · year 1
- Rental income
- $20,131
- − Mortgage interest
- −$11,875
- − Property taxes
- −$1,516
- − Insurance
- −$1,060
- − Repairs & maintenance
- −$1,610
- − Management
- −$1,610
- − Depreciation
- −$6,167
- Taxable loss
- −$3,708
- Est. tax savings @ 24.0%
- +$890
- After-tax cash flow
- $877/yr
For passive investors: Depreciation is non-cash, so a rental often shows a tax loss while cash-flowing — sheltering income. Rental losses are passive: they offset passive income freely, and up to $25,000/yr can offset ordinary (W-2) income if you actively participate and your MAGI is under $100k (phasing out to $0 by $150k); unused losses carry forward. On sale, claimed depreciation is recaptured at up to 25%, and gains may owe capital-gains tax (a 1031 exchange can defer both). Figures are a year-1 estimate at your 24.0% rate — not tax advice; consult a CPA.
Schools (NCES district)
- District
- Houston County
- NCES district ID
- 1302880
- Math proficiency
- 43% ▼ -7.00%
- Reading proficiency
- 46% ▼ -2.00%
- Median HH income
- $54,823
- Composite
- 38.68/100
- National rank
- #4144
- State rank
- #23 of 174 in GA
Livability — Warner Robins
- Score
- 65/100
- State rank
- #227
- US rank
- #13290
Category grades
Schools grade is shown separately in the Schools card above.
Census & demographics
- Census place
- Warner Robins, GA
- County
- Houston County · 157,321 people
- City population
- 92,102
- Metro
- Warner Robins, GA
- Population (ZIP)
- 58,585
- Household income
- $83,082
- Rent vs Own
- Severe rent burden
- 1668.0
Population outlook (Houston County) Hauer SSP2
- Today (2025)
- 169,502 people
- By 2030
- 178,486 · +5.3%
- By 2040
- 194,642 · +14.8%
- By 2050
- 207,119 · +22.2%
- By 2075
- 231,480 · +36.6%
- By 2100
- 235,034 · +38.7%
Race, ethnicity, and origin ACS 2023
- Neighborhood character
- Diverse neighborhood (Simpson 0.63)
- Race & ethnicity
- White 51% Black 32% Two or more races 9% Hispanic / Latino 7% Asian 4%
- Hispanic origin (detail)
- Mexican 4%
- Common ancestry
- Romanian 2% Slovak 2% Lithuanian 2%
- Foreign-born
- 9% · Canada, Vietnam, Jamaica
- Languages at home
- 90% English-only · Spanish 5% Other Asian/Pacific 2% Vietnamese 2%
Political lean MEDSL · Houston
- 2024 margin
- R (+11.3) · D 44.0% · R 55.3%
- 2008→2024 swing
- +8.9pp toward D · 2008: -20.2pp · 2024: -11.3pp
- All cycles
- 2024: R+11.3 2020: R+12.4 2016: R+21.6 2012: R+20.7 2008: R+20.2
Not yet ingested
- Civics
- —
Market trends
- HPI YoY
- ▼ -135.75%
- Current HPI
- 219.8261
- Rent YoY
- ▲ 1.67%
- Metro
- Warner Robins, GA
- State GDP YoY
- ▲ 2.66%
- F500 in state
- 28
Industry mix (Fortune 500 HQ in GA)
| Industry | F500 HQs | Revenue |
|---|---|---|
| Paper / Packaging | 2 | $29B |
|
||
| Retail | 1 | $160B |
|
||
| Transportation / Logistics | 1 | $91B |
|
||
| Airlines | 1 | $62B |
|
||
| Consumer Goods | 1 | $47B |
|
||
| Utilities | 1 | $25B |
|
||
Price history
+135.8% since first listed5 events — show timeline
- 2026-06-06 Listed $212,000 CGMLS
- 2018-04-11 Sold (MLS) $85,000 CGMLS
- 2018-03-07 Listed $85,000 CGMLS
- 2010-03-10 Sold (Public Records) $109,000 Public Records
- 2000-12-08 Sold (Public Records) $89,900 Public Records
Property tax history
+4.8%/yrLatest (2025): $1,516 · +12.3% YoY. Source: county tax records.
Cash-flow waterfall
monthlySold comps — $/sqft
last 12 mo · ≤1 miLoading sold comps…