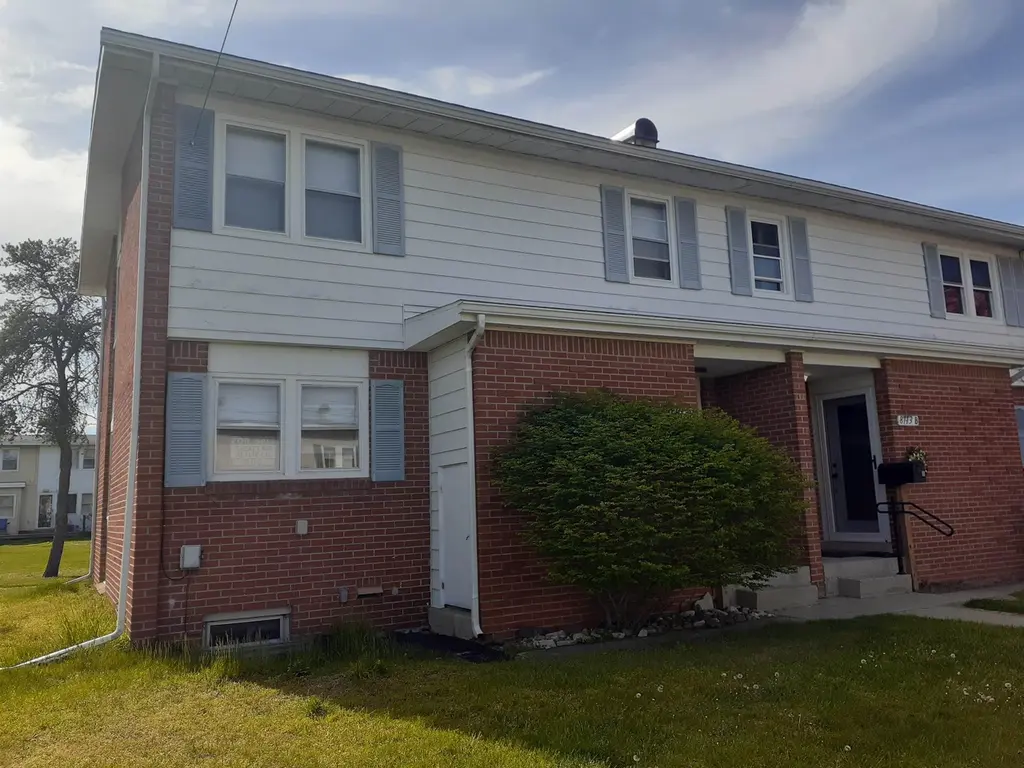
8113 A Colorado St · Oscoda, MI
Flood risk 1/10 · Minimal
- FEMA flood zone
- X (unshaded)
- Chance of flooding over 30 yrs
- 0.0%
- Est. flood insurance / yr
- $507 – $1,088
Fire risk 4/10 · Minor
- Est. fire insurance / yr
- $784 – $1,456
Heat risk 1/10 · Minimal
- Hot days now (above 94°F)
- 7 days/yr
- Hot days in 30 yrs
- 13 days/yr
Wind risk 1/10 · Minimal
- Chance of severe wind over 30 yrs
- —
Air-quality risk 2/10 · Minimal
- Unhealthy air days now
- 0 days/yr
- Unhealthy air days in 30 yrs
- 1 days/yr
Risk factors via First Street. Map © Google.
Why this score? — see what drove the D grade
The composite is a weighted blend of 9 inputs, each scored 0–100. Each bar is that input's sub-score; the figure is the points it added to the 100-point composite (weight × sub-score).
- Cash flow +19.9/30.0
- DSCR +6.3/10.0
- 1% rule +5.2/10.0
- Schools +2.9/10.0
- Livability +2.9/5.0
- Rent growth +2.5/5.0
- Condition / age +2.5/5.0
- ARV discount +0.0/15.0
- Appreciation +0.0/10.0
$119,900
🖨 Deal sheet 📄 Offer letter ✓ Due diligence
Listing remarks MLS
Turnkey and very clean 3-bedroom, 1 3/4 baths with 2 bonus rooms in the basement. Beautiful Pecan hardwood floors throughout, full basement, one-car detached garage with opener, lots of storage. City water and sewer. Immediate occupancy. Monthly dues are $77 and cover trash removal and lawn care
Key facts
- $77 HOA
- Garage
- Built 1960
Property features AI
Finance
- Other: Located in The Villages of Oscoda subdivision
- HOA & community: Homeowners association with a $77 monthly fee; HOA maintains grounds, provides snow removal and trash service; Community trails
Exterior
- Parking: Detached 1-car garage
- Utilities: Public water; Shared septic
- Home design: Residential condominium; Two levels
- Construction: Aluminum siding; Vinyl siding
- Exterior features: Deck; Fenced yard
Interior
- Kitchen: Dishwasher; Microwave; Oven; Range; Refrigerator; Gas water heater
- Bedrooms: Total of 5 rooms (includes bedrooms and living spaces)
- Bathrooms: 2 full bathrooms
- Heating & cooling: Forced air heating (natural gas); Central air conditioning; Ceiling fans
- Interior features: Bay windows; Window treatments; Finished full basement with partially finished areas
- Laundry & utility: Washer; Dryer
Neighborhood map
What this means for you Summary
Snapshot
- This is a 3-bed/1.5-bath single-family listed at $120k.
Deal economics
- At list price, monthly cash flow is $144 ($2k/yr) — positive.
- The deal already cash-flows at list — no discount required.
- Meets the 1% rule at list price ($1k rent vs $120k).
- Recommended offer: $118k (1.5% below list) — sets the bar for market timing.
- Cap rate 7.7% vs local median 2.8% in Oscoda — top-decile yield for the area; either an underpriced asset or a hidden risk that comps aren't pricing in. Stress-test before assuming the spread holds.
Location & tenants
- Location reads 57/100 on livability (#641 in MI) — a working-class tenant base; expect higher turnover. Strengths: cost of living A+, housing A; Watch: schools D+, crime F, amenities F.
- Oscoda Area Schools (rural): math 31% / reading 38% proficiency, ranked #313 of 540 in MI (top 58%) — families likely to look elsewhere, expect single-tenant / working-renter base with shorter leases.
- Market conditions: 128 active listings in the ZIP; 58 units permitted in Iosco County in 2024 (0 in 5+ unit buildings).
Forward outlook
- Local home prices are declining (-3.0%/yr); year-one equity from $829 of loan paydown is wiped out by about $4k of value loss. Plan a longer hold.
- Iosco County population projected at -14% by 2050 — secular population decline; favor cash flow + early exit over multi-decade hold.
Negotiation context
- It's been on market 18 days — a 2% lower offer ($118k) is reasonable based on typical stale-listing flexibility.
- 2 sale attempts with the ask held roughly flat each time — persistent listings suggest the price (not the market) is what's stuck; bring a comps-based counter.
- Current owner paid $52k; list at $120k implies a 133% gain — meaningful room to come down on a strong offer.
Questions for the listing agent
- Built in 1960 — when were the roof, HVAC, electrical panel, plumbing, and water heater last replaced?
- What does the HOA fee cover, when was the last increase, and are there any pending special assessments or reserve-fund shortfalls?
- Is there a deadline driving the sale (1031 exchange, divorce, estate, relocation)? That informs how much negotiation room exists.
- Schools are D-rated, which usually means shorter tenancies and higher turnover. Who's the typical renter profile here, and what's been the actual vacancy rate?
- Crime grade is F in this area — have there been break-ins, vandalism, or insurance claims at this property in the last 3 years? What carrier currently insures it and at what premium?
- The area grade is low — what's the realistic commute time and amenity access for the typical tenant pool here? Any planned neighborhood developments (good or bad) we should know about?
- What's the average days-on-market for RENTAL listings here right now (not sales)? A rising rental-DOM trend means longer vacancies and softer asking-rent achievability than the comps imply.
- What's the recent tenant-quality profile in this submarket — average credit score on applications, eviction rate, late-payment / NSF rate, and stable-employment percentage? A property-management company in the area should have these aggregated.
- How much new for-sale + rental construction is in the pipeline within 1–3 miles? Heavy new supply typically softens prices + rents 12–24 months out; constrained supply supports both.
Investment metrics
- 1% rule
- 1.02% ✓
- Cap rate
- 7.74%
- Cash-on-cash
- 5.16%
- DSCR
- 1.23
- GRM
- 8.2
CMA / ARV
- ARV (on-the-fly)
- $100,400
- Comps found
- 11
Show comp detail 11 sales within ~0.75 mi
| Address | Dist | Beds/Ba | Sqft | Sold | Price | $/sf | Match |
|---|---|---|---|---|---|---|---|
| 8005B N Alaska St #15 | 0.04mi | 3/1.5 | 1,328 (+6%) | 2mo | $105,000 | $79 | 86 |
| 8005B N Alaska St | 0.04mi | 3/1.5 | 1,328 (+6%) | 2mo | $105,000 | $79 | 86 |
| 8013 S Alaska St | 0.16mi | 3/1.5 | 1,255 (0%) | 20mo | $96,000 | $76 | 76 |
| 8013 S Alaska St Unit A | 0.16mi | 3/1.5 | 1,255 (0%) | 20mo | $96,000 | $76 | 76 |
| 9306 Maryland St Unit A | 0.53mi | 3/1.5 | 1,274 (+2%) | 1mo | $102,000 | $80 | 72 |
| 9306 Maryland St | 0.53mi | 3/1.5 | 1,274 (+2%) | 1mo | $102,000 | $80 | 72 |
| 9502 B Montana St Lot : 542 | 0.64mi | 3/1.5 | 1,262 (+1%) | 0mo | $125,000 | $99 | 69 |
| 9502 B Montana St | 0.64mi | 3/1.5 | 1,262 (+1%) | 0mo | $125,000 | $99 | 69 |
| 5523 Heather St Lot : 21&22 | 0.64mi | 3/2.0 | 1,278 (+2%) | 18mo | $215,000 | $168 | 50 |
| 5534 Heather Dr | 0.69mi | 3/2.0 | 1,264 (+1%) | 20mo | $120,000 | $95 | 48 |
| 4557 F-41 | 0.63mi | 3/2.0 | 1,404 (+12%) | 14mo | $230,000 | $164 | 37 |
Match score weights: distance 35% · size 25% · config 20% · recency 20%. Top-matched comps best support the ARV.
Projected returns pro-forma
-3.0% appreciation · 3.0% rent growth · sell at horizon
- IRR
- -8.3%
- Equity multiple
- 0.70×
- Total profit
- $-10,221
- Equity at exit
- $17,877
- IRR
- 1.3%
- Equity multiple
- 1.09×
- Total profit
- $2,990
- Equity at exit
- $10,367
Cash invested: $33,572 (down + closing). Projections, not guarantees.
Landlord ↔ Tenant lean methodology
- Overall (STATE)
- 62 Landlord-Friendly
- State Michigan
- 62 Landlord-Friendly · EVEN
- County
- — inherits STATE
- City
- — inherits STATE
ZIP-level market 48750
- Active inventory
- 128
- Price-to-rent
- 8.2×
Monthly cashflow live
- Estimated rent
- $1,219 medium interval (Pro) →
- Mortgage (P&I)
- −$629
- Tax from tax record
- −$63 /mo · $752/yr
- Insurance
- −$50
- HOA
- −$77
- Vacancy / Maint / Mgmt
- −$256
- Net cashflow
- $144
Break-even live
UW: 25.0% down · 7.5% · 30yr · 1.5% tax · 5.0% vac · 8.0% maint · 8.0% mgmt
Financing live
Cash to close
- Down payment
- $29,975
- Closing costs
- $3,597
- Reserves months
- —
- Total cash needed
- —
Loan-product check · same deal, 3 products live
Conventional
25% down · 7.5% · 30yr
- Down + closing
- —
- Monthly P&I
- —
- Monthly cashflow
- —
- DSCR
- —
- Eligible?
- —
Personal DTI + credit; lowest rate.
DSCR
20% down · 8.5% · 30yr
- Down + closing
- —
- Monthly P&I
- —
- Monthly cashflow
- —
- DSCR
- —
- Eligible?
- —
No personal income docs; deal must DSCR.
Hard money
10% down · 12.0% · 12mo
- Down + closing
- —
- Monthly P&I
- —
- Monthly cashflow
- —
- DSCR
- —
- Eligible?
- —
Short-term bridge; refi at stabilization.
HOA detail
- Monthly dues
- $77 · $924/yr
- Likely covers
- watersewertrashlandscaping
Listing history 13 events
-
2026-06-09status $119,900 Pending 18 DOM
-
2026-06-08days on market $119,900 Active Under Contract 18 DOM
-
2026-06-07days on market $119,900 Active Under Contract 17 DOM
-
2026-06-07days on market $119,900 Active Under Contract 16 DOM
-
2026-06-04days on market $119,900 Active Under Contract 13 DOM
-
2026-06-02days on market $119,900 Active Under Contract 12 DOM
-
2026-06-01days on market $119,900 Active Under Contract 11 DOM
-
2026-05-31status $119,900 Active Under Contract 10 DOM
-
2026-05-31days on market $119,900 Active 10 DOM
-
2026-05-31days on market $119,900 Active 9 DOM
-
2026-05-21$119,900 Active 296-char remark
Show marketing remark (296 chars)
Turnkey and very clean 3-bedroom, 1 3/4 baths with 2 bonus rooms in the basement. Beautiful Pecan hardwood floors throughout, full basement, one-car detached garage with opener, lots of storage. City water and sewer. Immediate occupancy. Monthly dues are $77 and cover trash removal and lawn care
-
2026-05-21$119,900 Active
Show marketing remark (296 chars)
Turnkey and very clean 3-bedroom, 1 3/4 baths with 2 bonus rooms in the basement. Beautiful Pecan hardwood floors throughout, full basement, one-car detached garage with opener, lots of storage. City water and sewer. Immediate occupancy. Monthly dues are $77 and cover trash removal and lawn care
-
2019-12-27soldstatus $51,501
ⓘ Source: listings_history table (triggers on properties + properties_extension) + one-shot
backfill from property_details.listing_events for pre-trigger history.
Tax reassessment forecast MI · Partial reset (capped growth)
- Current annual tax
- $752 · $63/mo
- Projected year-2 tax
- $1,299 · $108/mo
- Expected delta
- +$547/yr (+$46/mo · 72.8%)
ⓘ Screening estimate from a state-policy table — verify with the county assessor before closing.
Climate risk First Street
- Flood 1/10 Low FEMA zone X (unshaded) · 0% chance over 30 yrs
- Wildfire 4/10 Moderate
- Heat 1/10 Low 7 d/yr ≥94°F today · 13 d/yr by 30 yrs out
- Wind 1/10 Low
- Air quality 2/10 Low 0 unhealthy d/yr today · 1 by 30 yrs out
Nearby sold comps map
Loading sold comps map…
Walkable amenities ~0.75 mi
Loading nearby amenities…
Taxation est. · year 1
- Rental income
- $14,624
- − Mortgage interest
- −$6,716
- − Property taxes
- −$752
- − Insurance
- −$600
- − Repairs & maintenance
- −$1,170
- − Management
- −$1,170
- − HOA
- −$924
- − Depreciation
- −$3,488
- Taxable loss
- −$195
- Est. tax savings @ 24.0%
- +$47
- After-tax cash flow
- $1,779/yr
For passive investors: Depreciation is non-cash, so a rental often shows a tax loss while cash-flowing — sheltering income. Rental losses are passive: they offset passive income freely, and up to $25,000/yr can offset ordinary (W-2) income if you actively participate and your MAGI is under $100k (phasing out to $0 by $150k); unused losses carry forward. On sale, claimed depreciation is recaptured at up to 25%, and gains may owe capital-gains tax (a 1031 exchange can defer both). Figures are a year-1 estimate at your 24.0% rate — not tax advice; consult a CPA.
Schools (NCES district)
- District
- Oscoda Area Schools
- NCES district ID
- 2626970
- Math proficiency
- 31% ▼ -7.00%
- Reading proficiency
- 38% ▼ -9.00%
- Median HH income
- $36,275
- Composite
- 28.6/100
- National rank
- #6714
- State rank
- #313 of 540 in MI
Livability — Oscoda
- Score
- 57/100
- State rank
- #641
- US rank
- #21680
Category grades
Schools grade is shown separately in the Schools card above.
Census & demographics
- Population (ZIP)
- 9,281
Population outlook (Iosco County) Hauer SSP2
- Today (2025)
- 24,366 people
- By 2030
- 23,622 · -3.1%
- By 2040
- 22,021 · -9.6%
- By 2050
- 20,877 · -14.3%
- By 2075
- 18,792 · -22.9%
- By 2100
- 15,465 · -36.5%
Race, ethnicity, and origin ACS 2023
- Neighborhood character
- Predominantly White (93%)
- Race & ethnicity
- White 93% Two or more races 4% Hispanic / Latino 3%
- Common ancestry
- Romanian 11% Lithuanian 4% Italian 2%
- Foreign-born
- 2% · Canada, Jamaica
- Languages at home
- 96% English-only · Spanish 2%
Political lean MEDSL · Iosco
- 2024 margin
- Solid R (+30.6) · D 34.0% · R 64.5% · Other 1.5%
- 2008→2024 swing
- -35.7pp toward R · 2008: 5.1pp · 2024: -30.6pp
- All cycles
- 2024: R+30.6 2020: R+28.6 2016: R+30.0 2012: R+5.0 2008: D+5.1
Not yet ingested
- Civics
- —
Market trends
- HPI YoY
- ▼ -97.75%
- Current HPI
- 157.6759
- Rent YoY
- —
- Metro
- —
- State GDP YoY
- ▲ 1.37%
- F500 in state
- 28
Industry mix (Fortune 500 HQ in MI)
| Industry | F500 HQs | Revenue |
|---|---|---|
| Automotive Parts | 3 | $48B |
|
||
| Automotive | 2 | $372B |
|
||
| Chemicals | 1 | $45B |
|
||
| Automotive Retail | 1 | $29B |
|
||
| Healthcare / Medical Devices | 1 | $23B |
|
||
| Automotive Technology | 1 | $20B |
|
||
Price history
+132.8% since first listed3 events — show timeline
- 2026-05-21 Listed $119,900 REALCOMP
- 2026-05-21 Listed $119,900 MiRealSource-MiMLS
- 2019-12-27 Sold (Public Records) $51,501 Public Records
Property tax history
+2.2%/yrLatest (2025): $752 · +3.4% YoY. Source: county tax records.
Cash-flow waterfall
monthlySold comps — $/sqft
last 12 mo · ≤1 miLoading sold comps…