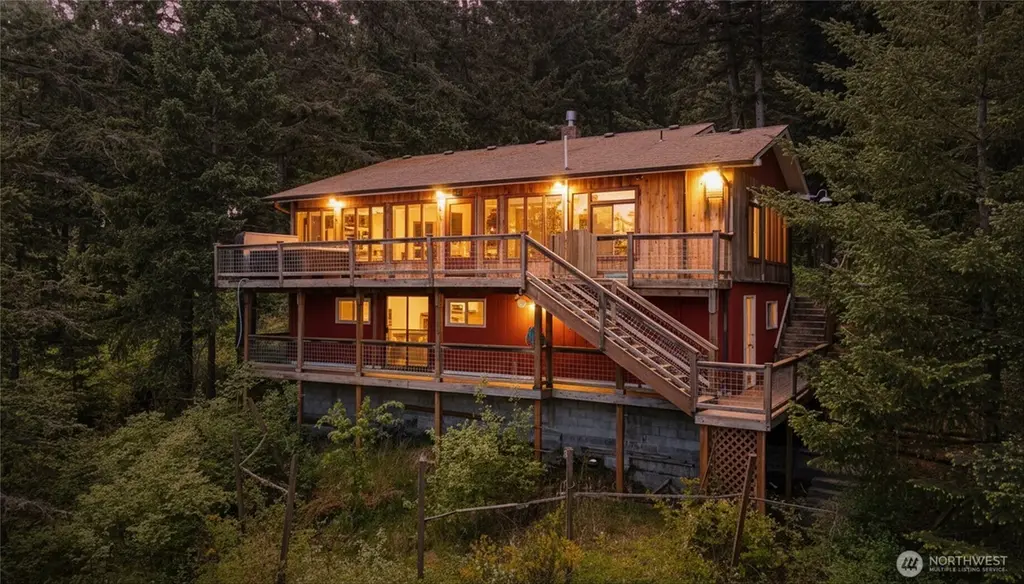
1136 Island Dr · Marietta-Alderwood, WA
Flood risk 1/10 · Minimal
- FEMA flood zone
- X (unshaded)
- Chance of flooding over 30 yrs
- 0.0%
- Est. flood insurance / yr
- $473 – $860
Fire risk 4/10 · Minor
- Est. fire insurance / yr
- $604 – $1,122
Heat risk 1/10 · Minimal
- Hot days now (above 81°F)
- 8 days/yr
- Hot days in 30 yrs
- 22 days/yr
Wind risk 1/10 · Minimal
- Chance of severe wind over 30 yrs
- —
Air-quality risk 5/10 · Moderate
- Unhealthy air days now
- 7 days/yr
- Unhealthy air days in 30 yrs
- 7 days/yr
Risk factors via First Street. Map © Google.
Why this score? — see what drove the D grade
The composite is a weighted blend of 9 inputs, each scored 0–100. Each bar is that input's sub-score; the figure is the points it added to the 100-point composite (weight × sub-score).
- ARV discount +15.0/15.0
- Appreciation +10.0/10.0
- Schools +4.6/10.0
- Cash flow +3.7/30.0
- Rent growth +2.5/5.0
- Livability +2.5/5.0
- Condition / age +2.5/5.0
- 1% rule +0.0/10.0
- DSCR +0.0/10.0
$469,000
🖨 Deal sheet 📄 Offer letter ✓ Due diligence
Listing remarks
Lovingly known as “The Birdhouse, ” this charming two bedroom, one bath home plus office/art bonus room is nestled among beautiful evergreens, offering privacy and peaceful island living. The home features gleaming wood floors, two Trex decks, a new Jotul fireplace, new range, Rinnai on-demand hot water heater, and a wired fast-charge electric vehicle charger. Relax in the nearly new state-of-the-art saltwater hot tub surrounded by nature. The lower partially finished daylight level is heated and plumbed, providing excellent space for a workshop, studio, hobby room, or storage. Homeownership includes access to a swimming lake, playground, saltwater boat launch, beach access, and
Key facts
- New jotul fireplace
- Two trex decks
- Community clubhouse
Tags
Property features AI
Finance
- Other: Located in Lummi Island Scenic Estates; Zoned RF; Lot approx. 0.28 acre
- Financial info: Listing terms: Cash or conventional
- HOA & community: Homeowners association with $99 monthly fee; Community features: boat launch, CCRs, clubhouse, playground
Exterior
- Parking: Off-street parking
- Utilities: Electric and propane energy sources; Community water; Septic sewer system; Power by Puget Sound Energy
- Home design: Single-family residence; One story with basement; Main entry level; Has a view; Located in a cul-de-sac on a paved road
- Construction: Log and wood construction; Composition roof; Poured concrete foundation; Built on lot
- Exterior features: Log and wood exterior; Deck; Hot tub / spa; Outbuildings; Garden space; Wooded setting; Community waterfront / private beach access; Level, sloped and terraced topography
Interior
- Kitchen: Refrigerator; Stove / Range
- Bedrooms: 2 bedrooms (both on main level)
- Flooring: Softwood; Vinyl; Carpet
- Bathrooms: 1 full bath; 1 half bath; One bathtub and one shower
- Heating & cooling: Stove / free-standing heating; No central cooling
- Interior features: French doors; Daylight, partially finished basement
Neighborhood map
What this means for you Summary
Snapshot
- This is a 2-bed/1.5-bath single-family listed at $469k.
Deal economics
- At list price, monthly cash flow is $-1k ($-16k/yr) — negative.
- To cash-flow at today's rent, offer at most $227k (51.6% below list).
- To meet the 1% rule (rent ≥ 1% of price), the offer needs to be $230k (51.0% below list).
- Recommended offer: $227k (51.6% below list) — sets the bar for cash-flow.
- Cap rate 2.8% vs local median 2.1% in Marietta-Alderwood — top-decile yield for the area; either an underpriced asset or a hidden risk that comps aren't pricing in. Stress-test before assuming the spread holds.
Location & tenants
- Location reads: area grade D — affects rentability + tenant quality, not the cash-flow math above.
- Ferndale School District (suburban): math 43% / reading 58% proficiency, ranked #138 of 291 in WA (top 47%) — acceptable for families but not a draw, mixed tenant base, ~2y average lease.
- Zoned schools: Beach Elem (43 students, 67% FRL); Ferndale High School (1,323 students, 48% FRL) — zoned schools average 57% FRL vs 41% district-wide (17 pts higher); higher-poverty schools than district average — tighter screening recommended.
- Market conditions: 31 active listings in the ZIP; 1 comparable units currently listed for rent nearby; 1,190 units permitted in Whatcom County in 2024 (327 in 5+ unit buildings).
Forward outlook
- In year one you build about $50k of equity ($3k loan paydown + $47k appreciation (10.0% local appreciation)).
- Whatcom County population projected at +28% by 2050 — long-run rental-demand tailwind backs the buy-and-hold thesis.
- By year 2, paydown + projected appreciation supports a ~$81k cash-out refi (75% LTV) — recoverable capital for the next deal without selling this one.
Negotiation context
- It's been on market 41 days — a 3% lower offer ($455k) is reasonable based on typical stale-listing flexibility.
- 3 sale attempts since 18y ago with the ask held roughly flat each time — persistent listings suggest the price (not the market) is what's stuck; bring a comps-based counter.
- Current owner paid $245k; list at $469k implies a 91% gain — meaningful room to come down on a strong offer.
Questions for the listing agent
- What do current leases actually rent for vs. the listed asking? Can we see a recent rent roll and the last 12 months of T-12 income?
- It's been on market 41 days. Have you received any prior offers? Is the seller open to a 52% concession, seller financing, or rate buy-down credit?
- Built in 1970 — when were the roof, HVAC, electrical panel, plumbing, and water heater last replaced?
- What does the HOA fee cover, when was the last increase, and are there any pending special assessments or reserve-fund shortfalls?
- Is there a deadline driving the sale (1031 exchange, divorce, estate, relocation)? That informs how much negotiation room exists.
- The area grade is low — what's the realistic commute time and amenity access for the typical tenant pool here? Any planned neighborhood developments (good or bad) we should know about?
- What's the average days-on-market for RENTAL listings here right now (not sales)? A rising rental-DOM trend means longer vacancies and softer asking-rent achievability than the comps imply.
- What's the recent tenant-quality profile in this submarket — average credit score on applications, eviction rate, late-payment / NSF rate, and stable-employment percentage? A property-management company in the area should have these aggregated.
- How much new for-sale + rental construction is in the pipeline within 1–3 miles? Heavy new supply typically softens prices + rents 12–24 months out; constrained supply supports both.
Investment metrics
- 1% rule
- 0.49% ✗
- Cap rate
- 2.79%
- Cash-on-cash
- -12.52%
- DSCR
- 0.44
- GRM
- 17.0
CMA / ARV
- ARV (median comp)
- $581,576
- List price
- $469,000
- Delta
- -19.36%
- Verdict
- UNDERPRICED
- Comps
- 16 within 1.0 mi
Show comp detail 4 sales within ~0.75 mi
| Address | Dist | Beds/Ba | Sqft | Sold | Price | $/sf | Match |
|---|---|---|---|---|---|---|---|
| 1185 Bay St | 0.13mi | 2/1.0 | 1,328 (+5%) | 13mo | $547,000 | $412 | 73 |
| 2965 Dogwood Ter | 0.17mi | 2/2.0 | 1,434 (+13%) | 7mo | $499,000 | $348 | 62 |
| 1178 Scenic Ave | 0.30mi | 1/1.0 (-1) | 1,348 (+6%) | 12mo | $425,000 | $315 | 59 |
| 3040 Mt Vista Dr | 0.36mi | 3/2.0 (+1) | 1,382 (+9%) | 7mo | $640,000 | $463 | 56 |
Match score weights: distance 35% · size 25% · config 20% · recency 20%. Top-matched comps best support the ARV.
Projected returns pro-forma
10.0% appreciation · 3.0% rent growth · sell at horizon
- IRR
- 15.5%
- Equity multiple
- 2.28×
- Total profit
- $168,147
- Equity at exit
- $422,512
- IRR
- 15.1%
- Equity multiple
- 5.29×
- Total profit
- $563,810
- Equity at exit
- $911,164
Cash invested: $131,320 (down + closing). Projections, not guarantees.
Landlord ↔ Tenant lean methodology
- Overall (STATE)
- 28 Tenant-Leaning
- State Washington
- 28 Tenant-Leaning · D+8
- County
- — inherits STATE
- City
- — inherits STATE
ZIP-level market 98262
- Active inventory
- 31
- Price-to-rent
- 17.0×
Monthly cashflow live
- Estimated rent
- $2,300 medium interval (Pro) →
- Mortgage (P&I)
- −$2,459
- Tax from tax record
- −$434 /mo · $5,202/yr
- Insurance
- −$195
- HOA
- −$99
- Vacancy / Maint / Mgmt
- −$483
- Net cashflow
- $-1,370
Break-even live
UW: 25.0% down · 7.5% · 30yr · 1.5% tax · 5.0% vac · 8.0% maint · 8.0% mgmt
Financing live
Cash to close
- Down payment
- $117,250
- Closing costs
- $14,070
- Reserves months
- —
- Total cash needed
- —
Loan-product check · same deal, 3 products live
Conventional
25% down · 7.5% · 30yr
- Down + closing
- —
- Monthly P&I
- —
- Monthly cashflow
- —
- DSCR
- —
- Eligible?
- —
Personal DTI + credit; lowest rate.
DSCR
20% down · 8.5% · 30yr
- Down + closing
- —
- Monthly P&I
- —
- Monthly cashflow
- —
- DSCR
- —
- Eligible?
- —
No personal income docs; deal must DSCR.
Hard money
10% down · 12.0% · 12mo
- Down + closing
- —
- Monthly P&I
- —
- Monthly cashflow
- —
- DSCR
- —
- Eligible?
- —
Short-term bridge; refi at stabilization.
Rent comps 1 comps
| Address | Beds | Baths | Sqft | Rent | $/sqft | DOM | Units | Dist |
|---|---|---|---|---|---|---|---|---|
| 2958 Dogwood Ter Lummi Island, WA | 2.0 | 1.0 | 1325 | $2,300 | $1.74 | 13d | 1 | 0.10mi |
HOA detail
- Monthly dues
- $99 · $1,188/yr
- Likely covers
- waterelectric
Listing history 26 events
-
2026-06-18days on market $469,000 Active 41 DOM
-
2026-06-17days on market $469,000 Active 40 DOM
-
2026-06-16days on market $469,000 Active 39 DOM
-
2026-06-15days on market $469,000 Active 38 DOM
-
2026-06-14days on market $469,000 Active 36 DOM
-
2026-06-13days on market $469,000 Active 35 DOM
-
2026-06-10days on market $469,000 Active 33 DOM
-
2026-06-09days on market $469,000 Active 32 DOM
-
2026-06-08days on market $469,000 Active 31 DOM
-
2026-06-07days on market $469,000 Active 30 DOM
-
2026-06-03days on market $469,000 Active 26 DOM
-
2026-06-02days on market $469,000 Active 25 DOM
-
2026-06-01days on market $469,000 Active 24 DOM
-
2026-05-31days on market $469,000 Active 23 DOM
-
2026-05-30days on market $469,000 Active 22 DOM
-
2026-05-08$469,000 Active
-
2015-12-30soldstatus $245,000 Sold
-
2015-12-30soldstatus $245,000
-
2015-12-07status Pending
-
2015-11-15historical
-
2015-11-13$249,000
-
2008-07-25soldstatus $278,000 Sold
-
2008-07-25soldstatus $278,000
-
2008-07-01historical
-
2008-06-09$289,900
-
2003-07-10soldstatus $151,000
ⓘ Source: listings_history table (triggers on properties + properties_extension) + one-shot
backfill from property_details.listing_events for pre-trigger history.
Tax reassessment forecast WA · Resets to sale price
- Current annual tax
- $5,202 · $434/mo
- Projected year-2 tax
- $5,202 · $434/mo
- Expected delta
- $0/yr ($0/mo · 0.0%)
ⓘ Screening estimate from a state-policy table — verify with the county assessor before closing.
Climate risk First Street
- Flood 1/10 Low FEMA zone X (unshaded) · 0% chance over 30 yrs
- Wildfire 4/10 Moderate
- Heat 1/10 Low 8 d/yr ≥81°F today · 22 d/yr by 30 yrs out
- Wind 1/10 Low
- Air quality 5/10 Major 7 unhealthy d/yr today · 7 by 30 yrs out
Nearby sold comps map
Loading sold comps map…
Walkable amenities ~0.75 mi
Loading nearby amenities…
Taxation est. · year 1
- Rental income
- $27,600
- − Mortgage interest
- −$26,271
- − Property taxes
- −$5,202
- − Insurance
- −$2,345
- − Repairs & maintenance
- −$2,208
- − Management
- −$2,208
- − HOA
- −$1,188
- − Depreciation
- −$13,644
- Taxable loss
- −$25,466
- Est. tax savings @ 24.0%
- +$6,112
- After-tax cash flow
- $-10,333/yr
For passive investors: Depreciation is non-cash, so a rental often shows a tax loss while cash-flowing — sheltering income. Rental losses are passive: they offset passive income freely, and up to $25,000/yr can offset ordinary (W-2) income if you actively participate and your MAGI is under $100k (phasing out to $0 by $150k); unused losses carry forward. On sale, claimed depreciation is recaptured at up to 25%, and gains may owe capital-gains tax (a 1031 exchange can defer both). Figures are a year-1 estimate at your 24.0% rate — not tax advice; consult a CPA.
Schools (NCES district)
- District
- Ferndale School District
- NCES district ID
- 5302850
- Math proficiency
- 43% ▲ 1.00%
- Reading proficiency
- 58% ▲ 4.00%
- Median HH income
- $59,413
- Composite
- 46.06/100
- National rank
- #5494
- State rank
- #138 of 291 in WA
Livability — Marietta-Alderwood
No livability data for this city. (Only ~50 U.S. cities are tracked.)
Census & demographics
- Population (ZIP)
- 1,020
Population outlook (Whatcom County) Hauer SSP2
- Today (2025)
- 240,408 people
- By 2030
- 254,667 · +5.9%
- By 2040
- 281,365 · +17.0%
- By 2050
- 307,592 · +27.9%
- By 2075
- 375,576 · +56.2%
- By 2100
- 421,637 · +75.4%
Race, ethnicity, and origin ACS 2023
- Neighborhood character
- Predominantly White (84%)
- Race & ethnicity
- White 84% Hispanic / Latino 7% Two or more races 4% Asian 3%
- Hispanic origin (detail)
- Mexican 4%
- Common ancestry
- Italian 10% Slovak 5% Iranian 5%
- Foreign-born
- 11% · Canada, China
- Languages at home
- 94% English-only · Spanish 3% Chinese 2% Other Asian/Pacific 1%
Political lean MEDSL · Whatcom
- 2024 margin
- Strong D (+24.9) · D 60.8% · R 35.9% · Other 3.3%
- 2008→2024 swing
- +6.9pp toward D · 2008: 18.0pp · 2024: 24.9pp
- All cycles
- 2024: D+24.9 2020: D+23.9 2016: D+17.7 2012: D+12.1 2008: D+18.0
Not yet ingested
- Civics
- —
Market trends
- HPI YoY
- ▲ 114.22%
- Current HPI
- 434.67
- Rent YoY
- —
- Metro
- —
- State GDP YoY
- ▲ 4.65%
- F500 in state
- 22
Industry mix (Fortune 500 HQ in WA)
| Industry | F500 HQs | Revenue |
|---|---|---|
| Retail | 2 | $269B |
|
||
| Technology / Retail | 1 | $638B |
|
||
| Technology | 1 | $245B |
|
||
| Telecommunications | 1 | $38B |
|
||
| Food / Beverage | 1 | $36B |
|
||
| Automotive / Trucks | 1 | $34B |
|
||
Price history
+210.6% since first listed11 events — show timeline
- 2026-05-08 Listed $469,000 NWMLS as Distributed by MLS Grid
- 2015-12-30 Sold (Public Records) $245,000 Public Records
- 2015-12-30 Sold (MLS) $245,000 NWMLS as Distributed by MLS Grid
- 2015-12-07 Pending — NWMLS as Distributed by MLS Grid
- 2015-11-15 Delisted — NWMLS as Distributed by MLS Grid
- 2015-11-13 Listed $249,000 NWMLS as Distributed by MLS Grid
- 2008-07-25 Sold (Public Records) $278,000 Public Records
- 2008-07-25 Sold (MLS) $278,000 NWMLS as Distributed by MLS Grid
- 2008-07-01 Delisted — NWMLS as Distributed by MLS Grid
- 2008-06-09 Listed $289,900 NWMLS as Distributed by MLS Grid
- 2003-07-10 Sold (Public Records) $151,000 Public Records
Property tax history
+5.1%/yrLatest (2026): $5,202 · +20.5% YoY. Source: county tax records.
Cash-flow waterfall
monthlySold comps — $/sqft
last 12 mo · ≤1 miLoading sold comps…