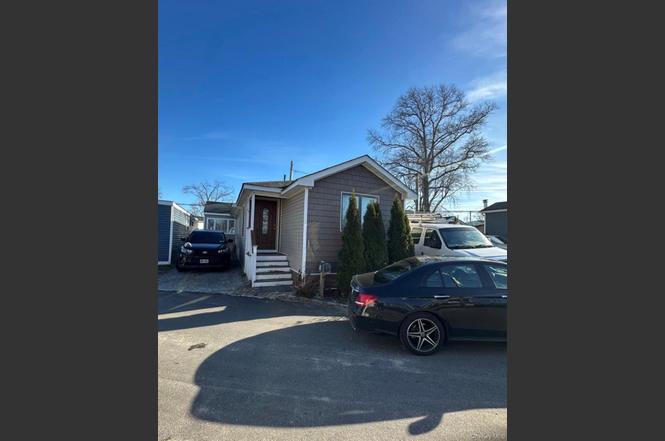
10 Elm Ave · Bay Shore, NY
Flood risk No data
- FEMA flood zone
- —
- Chance of flooding over 30 yrs
- —
- Est. flood insurance / yr
- —
Fire risk No data
- Est. fire insurance / yr
- —
Heat risk No data
- Hot days now (above threshold)
- —
- Hot days in 30 yrs
- —
Wind risk No data
- Chance of severe wind over 30 yrs
- —
Air-quality risk No data
- Unhealthy air days now
- —
- Unhealthy air days in 30 yrs
- —
Risk factors via First Street. Map © Google.
Why this score? — see what drove the B grade
The composite is a weighted blend of 9 inputs, each scored 0–100. Each bar is that input's sub-score; the figure is the points it added to the 100-point composite (weight × sub-score).
- Cash flow +30.0/30.0
- 1% rule +10.0/10.0
- DSCR +10.0/10.0
- ARV discount +7.5/15.0
- Schools +4.8/10.0
- Livability +3.8/5.0
- Rent growth +3.1/5.0
- Condition / age +2.5/5.0
- Appreciation +0.0/10.0
$159,000
🖨 Deal sheet 📄 Offer letter ✓ Due diligence
Listing remarks
Welcome to 10 Elm Avenue in Bay Shore! This well-maintained mobile home offers 3 bedroom and one bath comfortable and affordable living opportunity in a convenient location. Featuring a functional layout with bright living spaces, ample storage, and low-maintenance living, this home is ideal for those seeking simplicity and value. Enjoy easy access to local shopping, dining, major roadways, and public transportation. A great alternative to renting, don’t miss this opportunity to own in Bay Shore!
Key facts
- Bright living spaces
- Functional layout
- Ample storage
Tags
Neighborhood map
What this means for you Summary
Snapshot
- This is a 3-bed/1.0-bath manufactured listed at $159k.
Deal economics
- At list price, monthly cash flow is $611 ($7k/yr) — positive.
- The deal already cash-flows at list — no discount required.
- Meets the 1% rule at list price ($3k rent vs $159k).
- Recommended offer: $149k (6.0% below list) — sets the bar for market timing.
- Cap rate 10.9% vs local median 3.0% in Bay Shore — top-decile yield for the area; either an underpriced asset or a hidden risk that comps aren't pricing in. Stress-test before assuming the spread holds.
Location & tenants
- Location reads 75/100 on livability (#266 in NY, #4,209 nationally) — a middle-class / working-renter tenant base. Strengths: commute A+, employment A+, housing A+; Watch: cost of living F.
- Bay Shore Union Free School District (suburban): math 53% / reading 53% proficiency, ranked #295 of 590 in NY (top 50%) — acceptable for families but not a draw, mixed tenant base, ~2y average lease.
- Zoned schools: Brook Avenue Elementary School (400 students, 54% FRL); Bay Shore Middle School (math 28% / reading 53%, grade F, #409 of 729 statewide, top 56%, 1,298 students, 56% FRL).
- Zoned-school proficiency averages 40% at this address vs 53% district-wide (-12 pts) — the specific schools serving this property underperform the Bay Shore Union Free School District average; the district grade overstates school quality for this exact location.
- Market conditions: Rents rising (+2.4%/yr); 208 active listings in the ZIP; 11 comparable units currently listed for rent nearby; rentals leasing fast (median 13d on market — plan ~1-2 weeks tenant-placement turnaround); high-income renter base; 1,366 units permitted in Suffolk County in 2024 (216 in 5+ unit buildings).
- This rent runs 35% of the median local income ($120k/yr) — at the standard rent-burdened threshold; future hikes will face affordability resistance.
Forward outlook
- Local home prices are declining (-3.0%/yr); year-one equity from $1k of loan paydown is wiped out by about $5k of value loss. Plan a longer hold.
- Suffolk County population projected to shrink 5% by 2050 — rents likely to lag national; underwrite the cash flow, not the appreciation.
- At projected returns (-3.0% appreciation + 2.4% rent growth), your $45k cash investment doubles in ~8 years — after that, you're playing with house money.
Negotiation context
- It's been on market 90 days — a 6% lower offer ($149k) is reasonable based on typical stale-listing flexibility.
Risks & watch-outs
- Watch-outs: HOA is 30% of rent.
Questions for the listing agent
- It's been on market 90 days. Have you received any prior offers? Is the seller open to a 6% concession, seller financing, or rate buy-down credit?
- Built in 1978 — when were the roof, HVAC, electrical panel, plumbing, and water heater last replaced?
- What does the HOA fee cover, when was the last increase, and are there any pending special assessments or reserve-fund shortfalls?
- Why hasn't it sold? Are there any deal-killer items the seller is aware of (foundation, flood, title, zoning, code violations)?
- Is there a deadline driving the sale (1031 exchange, divorce, estate, relocation)? That informs how much negotiation room exists.
- What's the average days-on-market for RENTAL listings here right now (not sales)? A rising rental-DOM trend means longer vacancies and softer asking-rent achievability than the comps imply.
- What's the recent tenant-quality profile in this submarket — average credit score on applications, eviction rate, late-payment / NSF rate, and stable-employment percentage? A property-management company in the area should have these aggregated.
- How much new for-sale + rental construction is in the pipeline within 1–3 miles? Heavy new supply typically softens prices + rents 12–24 months out; constrained supply supports both.
Investment metrics
- 1% rule
- 2.20% ✓
- Cap rate
- 10.90%
- Cash-on-cash
- 16.47%
- DSCR
- 1.73
- GRM
- 3.8
CMA / ARV
No comps found within radius.
Projected returns pro-forma
-3.0% appreciation · 2.37% rent growth · sell at horizon
- IRR
- 6.8%
- Equity multiple
- 1.26×
- Total profit
- $11,642
- Equity at exit
- $23,707
- IRR
- 15.5%
- Equity multiple
- 2.22×
- Total profit
- $54,160
- Equity at exit
- $13,747
Cash invested: $44,520 (down + closing). Projections, not guarantees.
Landlord ↔ Tenant lean methodology
- Overall (STATE)
- 15 Strongly Tenant-Friendly
- State New York
- 15 Strongly Tenant-Friendly · D+10
- County
- — inherits STATE
- City
- — inherits STATE
ZIP-level market 11706
- Rents YoY
- 2.4%
- Active inventory
- 208
- Price-to-rent
- 3.8×
Monthly cashflow live
- Estimated rent
- $3,493 high interval (Pro) →
- Mortgage (P&I)
- −$834
- Tax est. 1.5%
- −$199 /mo · $2,385/yr
- Insurance
- −$66
- HOA
- −$1,050
- Vacancy / Maint / Mgmt
- −$734
- Net cashflow
- $611
Break-even live
UW: 25.0% down · 7.5% · 30yr · 1.5% tax · 5.0% vac · 8.0% maint · 8.0% mgmt
Financing live
Cash to close
- Down payment
- $39,750
- Closing costs
- $4,770
- Reserves months
- —
- Total cash needed
- —
Loan-product check · same deal, 3 products live
Conventional
25% down · 7.5% · 30yr
- Down + closing
- —
- Monthly P&I
- —
- Monthly cashflow
- —
- DSCR
- —
- Eligible?
- —
Personal DTI + credit; lowest rate.
DSCR
20% down · 8.5% · 30yr
- Down + closing
- —
- Monthly P&I
- —
- Monthly cashflow
- —
- DSCR
- —
- Eligible?
- —
No personal income docs; deal must DSCR.
Hard money
10% down · 12.0% · 12mo
- Down + closing
- —
- Monthly P&I
- —
- Monthly cashflow
- —
- DSCR
- —
- Eligible?
- —
Short-term bridge; refi at stabilization.
Rent comps 11 comps
| Address | Beds | Baths | Sqft | Rent | $/sqft | DOM | Units | Dist |
|---|---|---|---|---|---|---|---|---|
| 45 Garfield St Bay Shore, NY | 3.0 | 2.0 | 1355 | $3,999 | $2.95 | 43d | 1 | 0.78mi |
| 1455 E Forks Rd Bay Shore, NY | 3.0 | 1.0 | 1300 | $3,300 | $2.54 | 1d | 1 | 0.79mi |
| 7 Reil Pl Unit 1st floor Bay Shore, NY | 3.0 | 1.0 | 1100 | $3,295 | $3.00 | 13d | 1 | 0.80mi |
| 130 5th Ave Bay Shore, NY | 3.0 | 1.0 | 1200 | $3,195 | $2.66 | 1d | 1 | 0.83mi |
| 54 2nd Ave Bay Shore, NY | 2.0 | 1.0 | 1500 | $3,000 | $2.00 | 43d | 1 | 0.86mi |
| 57 Park Ave Unit 203 Bay Shore, NY | 2.0 | 1.0 | 1028 | $3,400 | $3.31 | 10d | 1 | 0.97mi |
| 143 4th Ave Bay Shore, NY | 2.0 | 1.0–2.0 | 1091 | $5,258 | $4.82 | 1d | 24 | 0.99mi |
| 35 Penataquit Ave Bay Shore, NY | 2.0 | 1.0–1.5 | 637 | $3,120 | $4.89 | 1d | 14 | 1.12mi |
| 179 Orinoco Dr Unit 1 Brightwaters, NY | 2.0 | 1.0 | 700 | $2,750 | $3.93 | 43d | 1 | 1.25mi |
| 29 S Clinton Ave Unit 1 Bay Shore, NY | 2.0 | 1.0 | 750 | $2,975 | $3.97 | 24d | 1 | 1.35mi |
| 405 E Main St Bay Shore, NY | 2.0 | 1.0–2.0 | 750 | $2,950 | $3.93 | 43d | 1 | 1.37mi |
HOA detail
- Monthly dues
- $1,050 · $12,600/yr
Listing history 2 events
-
2026-03-23status Pending
-
2025-12-22$159,000 Active
ⓘ Source: listings_history table (triggers on properties + properties_extension) + one-shot
backfill from property_details.listing_events for pre-trigger history.
Nearby sold comps map
Loading sold comps map…
Walkable amenities ~0.75 mi
Loading nearby amenities…
Taxation est. · year 1
- Rental income
- $41,920
- − Mortgage interest
- −$8,906
- − Property taxes
- −$2,385
- − Insurance
- −$795
- − Repairs & maintenance
- −$3,354
- − Management
- −$3,354
- − HOA
- −$12,600
- − Depreciation
- −$4,625
- Taxable income
- $5,901
- Est. tax owed @ 24.0%
- −$1,416
- After-tax cash flow
- $5,915/yr
For passive investors: Depreciation is non-cash, so a rental often shows a tax loss while cash-flowing — sheltering income. Rental losses are passive: they offset passive income freely, and up to $25,000/yr can offset ordinary (W-2) income if you actively participate and your MAGI is under $100k (phasing out to $0 by $150k); unused losses carry forward. On sale, claimed depreciation is recaptured at up to 25%, and gains may owe capital-gains tax (a 1031 exchange can defer both). Figures are a year-1 estimate at your 24.0% rate — not tax advice; consult a CPA.
Schools (NCES district)
- District
- Bay Shore Union Free School District
- NCES district ID
- 3604080
- Math proficiency
- 53% ▲ 1.00%
- Reading proficiency
- 53% ▼ -2.00%
- Median HH income
- $76,263
- Composite
- 47.79/100
- National rank
- #2230
- State rank
- #295 of 590 in NY
Livability — Bay Shore
- Score
- 75/100
- State rank
- #266
- US rank
- #4209
Category grades
Schools grade is shown separately in the Schools card above.
Census & demographics
- Census place
- Bay Shore, NY
- County
- Suffolk County · 679,920 people
- City population
- 68,976
- Metro
- New York-Newark-Jersey City, NY-NJ-PA
- Population (ZIP)
- 68,976
- Household income
- $119,603
- Rent vs Own
- Severe rent burden
- 1516.0
Population outlook (Suffolk County) Hauer SSP2
- Today (2025)
- 1,505,262 people
- By 2030
- 1,498,318 · -0.5%
- By 2040
- 1,471,101 · -2.3%
- By 2050
- 1,424,848 · -5.3%
- By 2075
- 1,337,157 · -11.2%
- By 2100
- 1,217,720 · -19.1%
Race, ethnicity, and origin ACS 2023
- Neighborhood character
- Diverse neighborhood (Simpson 0.67)
- Race & ethnicity
- Hispanic / Latino 46% White 33% Two or more races 13% Black 11% Asian 6%
- Hispanic origin (detail)
- Mexican 1% Puerto Rican 8% Dominican 5%
- Common ancestry
- Romanian 2% Hispanic 2% Italian 1%
- Foreign-born
- 32% · Canada, Jamaica
- Languages at home
- 52% English-only · Spanish 38% Other Indo-European 6% French/Haitian/Cajun 2%
Political lean MEDSL · Suffolk
- 2024 margin
- Lean R (+10.0) · D 45.0% · R 55.0%
- 2008→2024 swing
- -16.0pp toward R · 2008: 6.0pp · 2024: -10.0pp
- All cycles
- 2024: R+10.0 2020: R+0.0 2016: R+8.2 2012: D+2.9 2008: D+6.0
Not yet ingested
- Civics
- —
Market trends
- HPI YoY
- ▼ -723.52%
- Current HPI
- 311.4019
- Rent YoY
- ▲ 2.37%
- Metro
- New York-Newark-Jersey City, NY-NJ-PA
- State GDP YoY
- ▲ 2.60%
- F500 in state
- 92
Industry mix (Fortune 500 HQ in NY)
| Industry | F500 HQs | Revenue |
|---|---|---|
| Financial Services | 10 | $950B |
|
||
| Consumer Goods | 9 | $162B |
|
||
| Insurance | 4 | $225B |
|
||
| Telecommunications | 2 | $144B |
|
||
| Pharmaceuticals | 2 | $112B |
|
||
| Media / Entertainment | 2 | $69B |
|
||
Price history
2 events — show timeline
- 2026-03-23 Pending — OneKey® MLS as Distributed by MLS Grid
- 2025-12-22 Listed $159,000 OneKey® MLS as Distributed by MLS Grid
Cash-flow waterfall
monthlySold comps — $/sqft
last 12 mo · ≤1 miLoading sold comps…