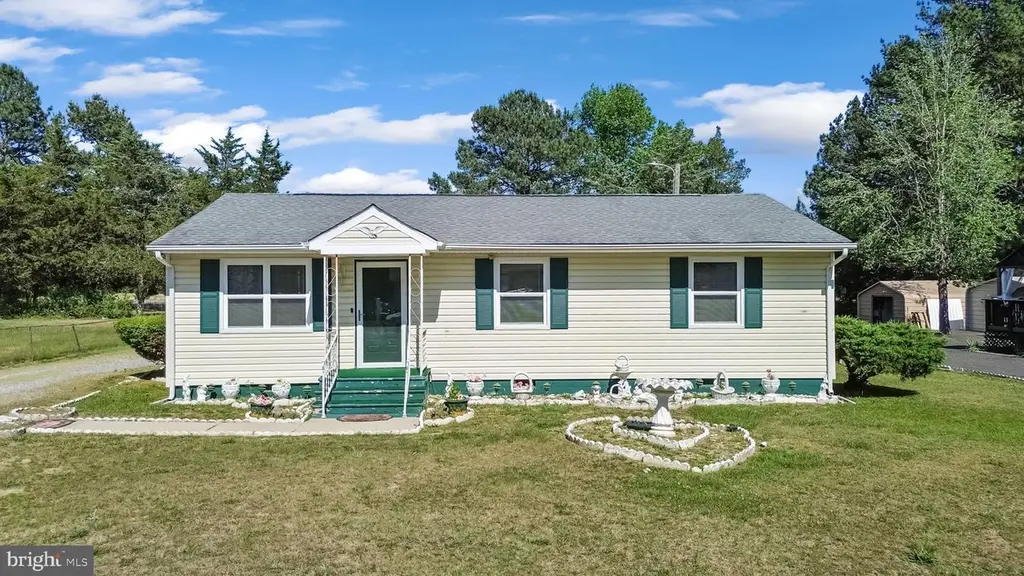
2511 Edgewood Dr · Lake Land'Or, VA
Flood risk 1/10 · Minimal
- FEMA flood zone
- X (unshaded)
- Chance of flooding over 30 yrs
- 0.0%
- Est. flood insurance / yr
- $473 – $860
Fire risk 4/10 · Minor
- Est. fire insurance / yr
- $666 – $1,236
Heat risk 7/10 · Major
- Hot days now (above 106°F)
- 7 days/yr
- Hot days in 30 yrs
- 17 days/yr
Wind risk 5/10 · Moderate
- Chance of severe wind over 30 yrs
- 23.0%
Air-quality risk 1/10 · Minimal
- Unhealthy air days now
- 0 days/yr
- Unhealthy air days in 30 yrs
- 0 days/yr
Risk factors via First Street. Map © Google.
Why this score? — see what drove the C grade
The composite is a weighted blend of 9 inputs, each scored 0–100. Each bar is that input's sub-score; the figure is the points it added to the 100-point composite (weight × sub-score).
- Cash flow +20.8/30.0
- ARV discount +12.9/15.0
- DSCR +6.6/10.0
- 1% rule +4.4/10.0
- Schools +4.4/10.0
- Rent growth +2.5/5.0
- Livability +2.5/5.0
- Condition / age +2.5/5.0
- Appreciation +0.0/10.0
$250,000
🖨 Deal sheet 📄 Offer letter ✓ Due diligence
Listing remarks
This Ruther Glen home is ready for its next chapter and it's looking for the right buyer to write it. Contractors, investors, and first-time flippers, this one is priced to move and the opportunity is real. This 3-bedroom, 1-bath gem offers solid bones and serious upside. The interior features a mix of softwood and carpet flooring throughout, with baseboard heat keeping things simple and cost-effective. The concrete block foundation and composition roof mean you're starting from a place of structural stability, your budget can go straight toward the fun stuff. The location is a hidden gem in itself, close to I-95, right off Route 1, and just 15 minutes from the new Kalahari Resort & W
Key facts
- Close to i-95
- Composition roof
- Built 1977
Tags
Property features AI
Finance
- Other: Above-grade finished area reported as 1,008 (per assessor); Total below-grade area reported as 0; Ground rent paid annually
Exterior
- Parking: Driveway
- Utilities: Public water; Public sewer; Electric hot water
- Home design: Detached property; Fee simple ownership; Built year recorded by assessor
- Construction: Vinyl siding exterior; Slab foundation
- Exterior features: Above-grade and below-grade structures noted
Interior
- Bedrooms: Three bedrooms on the main level
- Bathrooms: One full bathroom on the main level; One full bathroom total
- Heating & cooling: Electric baseboard heating; Window air conditioning units (electric)
- Interior features: No basement
Neighborhood map
What this means for you Summary
Snapshot
- This is a 3-bed/1.0-bath single-family listed at $250k.
Deal economics
- At list price, monthly cash flow is $341 ($4k/yr) — positive.
- The deal already cash-flows at list — no discount required.
- To meet the 1% rule (rent ≥ 1% of price), the offer needs to be $236k (5.8% below list).
- Recommended offer: $236k (5.8% below list) — sets the bar for 1% rule.
- Cap rate 7.9% vs local median 3.6% in Lake Land'Or — top-decile yield for the area; either an underpriced asset or a hidden risk that comps aren't pricing in. Stress-test before assuming the spread holds.
Location & tenants
- Location reads: area grade C — affects rentability + tenant quality, not the cash-flow math above.
- Caroline County Public School District (rural): math 39% / reading 62% proficiency, ranked #95 of 131 in VA (top 72%) — acceptable for families but not a draw, mixed tenant base, ~2y average lease.
- Zoned schools: Lewis And Clark Elementary (math 53% / reading 64%, grade B-, #576 of 1,108 statewide, top 52%, 890 students, 75% FRL); Caroline Middle (math 36% / reading 67%, grade C, #222 of 342 statewide, top 65%, 973 students, 75% FRL); Caroline High (math 46% / reading 76%, grade C+, #242 of 319 statewide, top 76%, 1,251 students, 75% FRL) — zoned schools average 75% FRL vs 44% district-wide (31 pts higher); higher-poverty schools than district average — tighter screening recommended.
- Market conditions: 273 active listings in the ZIP; 4 comparable units currently listed for rent nearby; rentals lingering (median 44d on market — plan ~5-8 weeks vacancy on turnover, expect pricing pressure); 50% of comp listings sitting > 30 days — soft ceiling on asking rent; solid renter incomes; 318 units permitted in Caroline County in 2024 (0 in 5+ unit buildings).
- This rent runs 32% of the median local income ($89k/yr) — at the standard rent-burdened threshold; future hikes will face affordability resistance.
Forward outlook
- Local home prices are declining (-3.0%/yr); year-one equity from $2k of loan paydown is wiped out by about $8k of value loss. Plan a longer hold.
- Caroline County population projected at +8% by 2050 — modest demand growth; plan on rents tracking national, not racing it.
Negotiation context
- It's been on market 27 days — a 2% lower offer ($246k) is reasonable based on typical stale-listing flexibility.
Risks & watch-outs
- Climate carrying-cost: moderate wind risk, 23% chance of damaging wind over 30y; extreme-heat days projected 7→17/yr by 2055 (HVAC capex compounding) — expect insurance premiums to compound above CPI over the hold.
Questions for the listing agent
- Built in 1977 — when were the roof, HVAC, electrical panel, plumbing, and water heater last replaced?
- Is there a deadline driving the sale (1031 exchange, divorce, estate, relocation)? That informs how much negotiation room exists.
- What's the average days-on-market for RENTAL listings here right now (not sales)? A rising rental-DOM trend means longer vacancies and softer asking-rent achievability than the comps imply.
- What's the recent tenant-quality profile in this submarket — average credit score on applications, eviction rate, late-payment / NSF rate, and stable-employment percentage? A property-management company in the area should have these aggregated.
- How much new for-sale + rental construction is in the pipeline within 1–3 miles? Heavy new supply typically softens prices + rents 12–24 months out; constrained supply supports both.
Investment metrics
- 1% rule
- 0.94% ✗
- Cap rate
- 7.93%
- Cash-on-cash
- 5.84%
- DSCR
- 1.26
- GRM
- 8.8
CMA / ARV
- ARV (on-the-fly)
- $284,256
- Comps found
- 7
Show comp detail 7 sales within ~0.75 mi
| Address | Dist | Beds/Ba | Sqft | Sold | Price | $/sf | Match |
|---|---|---|---|---|---|---|---|
| 2508 Quail Oak Dr | 0.10mi | 3/1.0 | 1,008 (0%) | 9mo | $125,000 | $124 | 88 |
| 2409 Quail Oak Dr | 0.17mi | 3/2.0 | 1,008 (0%) | 2mo | $315,000 | $313 | 86 |
| 2412 Quail Oak Dr | 0.23mi | 3/2.0 | 1,008 (0%) | 5mo | $315,000 | $313 | 82 |
| 2416 Quail Oak Dr | 0.19mi | 3/1.0 | 1,008 (0%) | 13mo | $281,000 | $279 | 80 |
| 2521 Quail Oak Dr | 0.14mi | 3/1.0 | 1,008 (0%) | 20mo | $263,925 | $262 | 77 |
| 2601 Deerfield Rd | 0.29mi | 3/1.5 | 982 (-3%) | 12mo | $307,000 | $313 | 70 |
| 2502 Edgewood Dr | 0.07mi | 3/2.0 | 1,152 (+14%) | 11mo | $325,000 | $282 | 60 |
Match score weights: distance 35% · size 25% · config 20% · recency 20%. Top-matched comps best support the ARV.
Projected returns pro-forma
-3.0% appreciation · 3.0% rent growth · sell at horizon
- IRR
- -7.3%
- Equity multiple
- 0.73×
- Total profit
- $-18,890
- Equity at exit
- $37,276
- IRR
- 2.2%
- Equity multiple
- 1.16×
- Total profit
- $11,137
- Equity at exit
- $21,615
Cash invested: $70,000 (down + closing). Projections, not guarantees.
Landlord ↔ Tenant lean methodology
- Overall (STATE)
- 55 Moderately Landlord-Leaning
- State Virginia
- 55 Moderately Landlord-Leaning · D+2
- County
- — inherits STATE
- City
- — inherits STATE
ZIP-level market 22546
- Home prices YoY
- -2.9%
- Active inventory
- 273
- Price-to-rent
- 8.8×
Monthly cashflow live
- Estimated rent
- $2,356 medium interval (Pro) →
- Mortgage (P&I)
- −$1,311
- Tax from tax record
- −$105 /mo · $1,263/yr
- Insurance
- −$104
- HOA
- −$0
- Vacancy / Maint / Mgmt
- −$495
- Net cashflow
- $341
Break-even live
UW: 25.0% down · 7.5% · 30yr · 1.5% tax · 5.0% vac · 8.0% maint · 8.0% mgmt
Financing live
Cash to close
- Down payment
- $62,500
- Closing costs
- $7,500
- Reserves months
- —
- Total cash needed
- —
Loan-product check · same deal, 3 products live
Conventional
25% down · 7.5% · 30yr
- Down + closing
- —
- Monthly P&I
- —
- Monthly cashflow
- —
- DSCR
- —
- Eligible?
- —
Personal DTI + credit; lowest rate.
DSCR
20% down · 8.5% · 30yr
- Down + closing
- —
- Monthly P&I
- —
- Monthly cashflow
- —
- DSCR
- —
- Eligible?
- —
No personal income docs; deal must DSCR.
Hard money
10% down · 12.0% · 12mo
- Down + closing
- —
- Monthly P&I
- —
- Monthly cashflow
- —
- DSCR
- —
- Eligible?
- —
Short-term bridge; refi at stabilization.
Rent comps 4 comps
| Address | Beds | Baths | Sqft | Rent | $/sqft | DOM | Units | Dist |
|---|---|---|---|---|---|---|---|---|
| 2508 Quail Oak Dr Ruther Glen, VA | 3.0 | 2.0 | 1008 | $2,100 | $2.08 | 44d | 1 | 0.12mi |
| 7124 Azalea Dr Ruther Glen, VA | 3.0 | 2.5 | 1440 | $1,900 | $1.32 | 44d | 1 | 0.56mi |
| 7092 Durrette Rd Ruther Glen, VA | 2.0–3.0 | 2.0 | 1500 | $2,260 | $1.51 | 1d | 1 | 0.80mi |
| 18393 Signature Way Ruther Glen, VA | 3.0 | 2.0 | 1368 | $2,407 | $1.76 | 24d | 1 | 1.48mi |
Listing history 14 events
-
2026-06-18days on market $250,000 Active 27 DOM
-
2026-06-17days on market $250,000 Active 26 DOM
-
2026-06-16days on market $250,000 Active 25 DOM
-
2026-06-15days on market $250,000 Active 24 DOM
-
2026-06-13days on market $250,000 Active 22 DOM
-
2026-06-09days on market $250,000 Active 18 DOM
-
2026-06-08days on market $250,000 Active 17 DOM
-
2026-06-07pricedays on market $250,000 Active 16 DOM
-
2026-06-04days on market $260,000 Active 13 DOM
-
2026-06-03days on market $260,000 Active 12 DOM
-
2026-06-02days on market $260,000 Active 11 DOM
-
2026-06-01days on market $260,000 Active 10 DOM
-
2026-05-31days on market $260,000 Active 9 DOM
-
2026-05-22$260,000 Active
ⓘ Source: listings_history table (triggers on properties + properties_extension) + one-shot
backfill from property_details.listing_events for pre-trigger history.
Tax reassessment forecast VA · Resets to sale price
- Current annual tax
- $1,263 · $105/mo
- Projected year-2 tax
- $2,050 · $171/mo
- Expected delta
- +$787/yr (+$66/mo · 62.4%)
ⓘ Screening estimate from a state-policy table — verify with the county assessor before closing.
Climate risk First Street
- Flood 1/10 Low FEMA zone X (unshaded) · 0% chance over 30 yrs
- Wildfire 4/10 Moderate
- Heat 7/10 Severe 7 d/yr ≥106°F today · 17 d/yr by 30 yrs out
- Wind 5/10 Major 23% chance of damaging wind over 30 yrs
- Air quality 1/10 Low 0 unhealthy d/yr today · 0 by 30 yrs out
Nearby sold comps map
Loading sold comps map…
Walkable amenities ~0.75 mi
Loading nearby amenities…
Taxation est. · year 1
- Rental income
- $28,273
- − Mortgage interest
- −$14,004
- − Property taxes
- −$1,263
- − Insurance
- −$1,250
- − Repairs & maintenance
- −$2,262
- − Management
- −$2,262
- − Depreciation
- −$7,273
- Taxable loss
- −$40
- Est. tax savings @ 24.0%
- +$10
- After-tax cash flow
- $4,100/yr
For passive investors: Depreciation is non-cash, so a rental often shows a tax loss while cash-flowing — sheltering income. Rental losses are passive: they offset passive income freely, and up to $25,000/yr can offset ordinary (W-2) income if you actively participate and your MAGI is under $100k (phasing out to $0 by $150k); unused losses carry forward. On sale, claimed depreciation is recaptured at up to 25%, and gains may owe capital-gains tax (a 1031 exchange can defer both). Figures are a year-1 estimate at your 24.0% rate — not tax advice; consult a CPA.
Schools (NCES district)
- District
- Caroline County Public School District
- NCES district ID
- 5100660
- Math proficiency
- 39% ▼ -36.00%
- Reading proficiency
- 62% ▼ -10.00%
- Median HH income
- $58,075
- Composite
- 43.88/100
- National rank
- #2920
- State rank
- #95 of 131 in VA
Livability — Lake Land'Or
No livability data for this city. (Only ~50 U.S. cities are tracked.)
Census & demographics
- County
- Caroline County · 18,392 people
- Metro
- nan
- Population (ZIP)
- 18,392
- Household income
- $89,247
- Rent vs Own
- Severe rent burden
- 192.0
Population outlook (Caroline County) Hauer SSP2
- Today (2025)
- 32,136 people
- By 2030
- 32,973 · +2.6%
- By 2040
- 34,255 · +6.6%
- By 2050
- 34,843 · +8.4%
- By 2075
- 35,134 · +9.3%
- By 2100
- 32,184 · +0.1%
Race, ethnicity, and origin ACS 2023
- Neighborhood character
- Diverse neighborhood (Simpson 0.58)
- Race & ethnicity
- White 58% Black 27% Hispanic / Latino 8% Two or more races 6% Asian 1%
- Hispanic origin (detail)
- Mexican 2%
- Common ancestry
- Lithuanian 4% Italian 2% Romanian 1%
- Foreign-born
- 5% · Canada, South Korea
- Languages at home
- 91% English-only · Spanish 7% Other Indo-European 1%
Political lean MEDSL · Caroline
- 2024 margin
- Lean R (+8.8) · D 45.1% · R 53.9% · Other 1.1%
- 2008→2024 swing
- -20.8pp toward R · 2008: 12.0pp · 2024: -8.8pp
- All cycles
- 2024: R+8.8 2020: R+4.2 2016: R+5.1 2012: D+8.2 2008: D+12.0
Not yet ingested
- Civics
- —
Market trends
- HPI YoY
- ▼ -10.95%
- Current HPI
- 362.5582
- Rent YoY
- —
- Metro
- nan
- State GDP YoY
- ▲ 2.40%
- F500 in state
- 50
Industry mix (Fortune 500 HQ in VA)
| Industry | F500 HQs | Revenue |
|---|---|---|
| Aerospace / Defense | 4 | $236B |
|
||
| Technology / Defense | 3 | $32B |
|
||
| Financial Services | 2 | $176B |
|
||
| Utilities | 2 | $27B |
|
||
| Insurance | 2 | $25B |
|
||
| Technology | 2 | $15B |
|
||
Price history
1 event — show timeline
- 2026-05-22 Listed $260,000 BRIGHT MLS
Property tax history
+4.4%/yrLatest (2025): $1,263 · +29.7% YoY. Source: county tax records.
Cash-flow waterfall
monthlySold comps — $/sqft
last 12 mo · ≤1 miLoading sold comps…