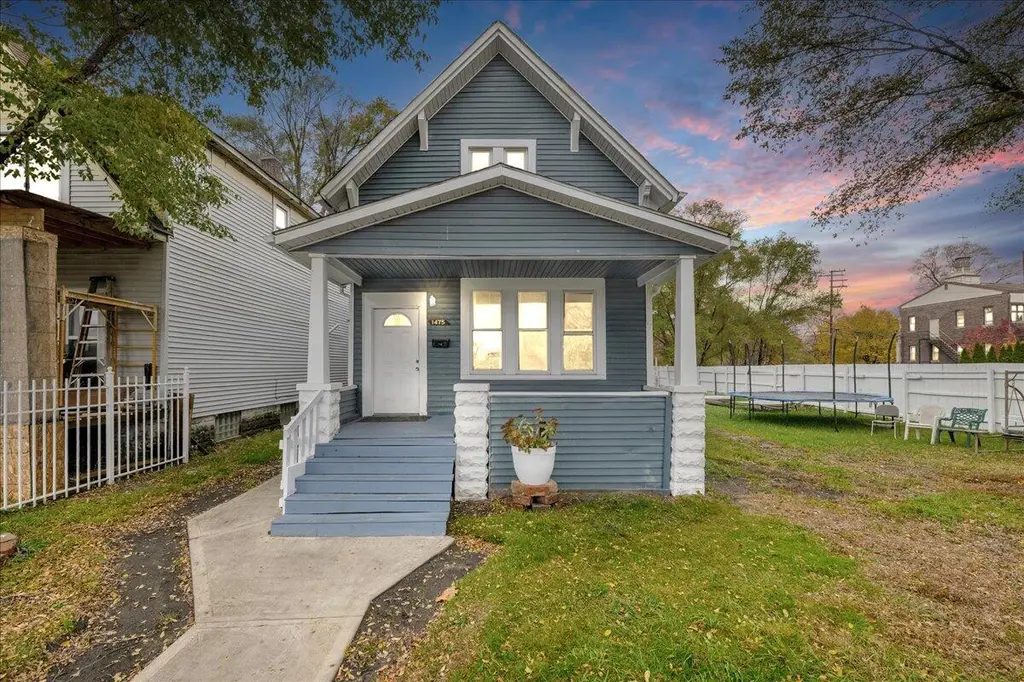
1475 25th St · Detroit, MI
Flood risk 1/10 · Minimal
- FEMA flood zone
- X (unshaded)
- Chance of flooding over 30 yrs
- 0.0%
- Est. flood insurance / yr
- $473 – $860
Fire risk 1/10 · Minimal
- Est. fire insurance / yr
- $784 – $1,456
Heat risk 3/10 · Minor
- Hot days now (above 97°F)
- 7 days/yr
- Hot days in 30 yrs
- 15 days/yr
Wind risk 2/10 · Minimal
- Chance of severe wind over 30 yrs
- —
Air-quality risk 4/10 · Minor
- Unhealthy air days now
- 6 days/yr
- Unhealthy air days in 30 yrs
- 8 days/yr
Risk factors via First Street. Map © Google.
Why this score? — see what drove the F grade
The composite is a weighted blend of 9 inputs, each scored 0–100. Each bar is that input's sub-score; the figure is the points it added to the 100-point composite (weight × sub-score).
- Cash flow +7.4/30.0
- 1% rule +4.3/10.0
- Rent growth +4.3/5.0
- Livability +3.7/5.0
- Appreciation +2.7/10.0
- Condition / age +2.5/5.0
- DSCR +1.5/10.0
- Schools +1.3/10.0
- ARV discount +0.0/15.0
$234,900
🖨 Deal sheet 📄 Offer letter ✓ Due diligence
Listing remarks MLS
Investment Opportunity in Prime SW Detroit! Well-maintained situated on a rare double lot, offering immediate rental income with both units occupied by long-term tenants. The upper unit (1477) features 4 bedrooms, 1 full bath, and a private balcony. The lower unit (1475) offers 3 bedrooms and 1 full bath. Property includes a garage/storage unit and ample parking. Recent updates include newer electrical meters and fresh exterior paint. Ideal for investors seeking a solid, income-producing property with stable tenancy. Conveniently located near major roads, shopping, and dining. Great opportunity to add to your portfolio.
Key facts
- Garage storage unit
- Private balcony
- Double lot
Tags
Property features AI
Finance
- Other: Property classified as residential income / multi-family
- Financial info: Rents listed: $1,000 for the 4+ bedroom unit, $1,000 for the 3-bedroom unit
Exterior
- Parking: 4 parking spaces
- Utilities: Public water; Public sewer / sewer connected; Electricity connected
- Home design: Multi-family residential income property; Vinyl siding
- Construction: Vinyl siding construction
- Exterior features: Lot approximately 3,920 sq ft (0.09 acres); Cross streets: Vernon & 25th
Interior
- Kitchen: No kitchen appliance details provided
- Bedrooms: One unit with 4+ bedrooms; One unit with 3 bedrooms
- Bathrooms: One bathroom in the 4+ bedroom unit; One bathroom in the 3-bedroom unit
- Heating & cooling: Forced-air heating; Natural gas heating
- Interior features: Common-area laundry; Basement
- Laundry & utility: Common-area laundry
Neighborhood map
What this means for you Summary
Snapshot
- This is a 7-bed/1.5-bath townhouse listed at $235k.
Deal economics
- At list price, monthly cash flow is $-305 ($-4k/yr) — negative.
- To cash-flow at today's rent, offer at most $181k (22.9% below list).
- To meet the 1% rule (rent ≥ 1% of price), the offer needs to be $218k (7.1% below list).
- Recommended offer: $181k (22.9% below list) — sets the bar for cash-flow.
- Cap rate 4.7% vs local median 10.2% in Detroit — below-typical yield; the buyer is paying a premium for something (appreciation thesis, condition, location) that the cap rate doesn't capture.
Location & tenants
- Location reads 73/100 on livability (#218 in MI) — a middle-class / working-renter tenant base. Strengths: amenities A+, commute A+, cost of living A+; Watch: schools F, crime F, employment F.
- Detroit Public Schools Community District (urban): math 10% / reading 24% proficiency, ranked #499 of 540 in MI (top 92%) — low school quality limits family demand, transient renter base, plan for 1-2y turnover; 90% free/reduced lunch — lower-income household profile, screen leases tightly.
- Market conditions: Rents rising fast (+7.3%/yr); 105 active listings in the ZIP; 1 comparable units currently listed for rent nearby; lower-income renter base — watch delinquency; 2,639 units permitted in Wayne County in 2024 (1,216 in 5+ unit buildings).
- At $2,182/mo this rent would consume 59% of the median local household income ($44k/yr) (locally 431% of renters already pay >50% of income on rent) — very limited rent-growth headroom before tenants either downsize or default.
Forward outlook
- Local home prices are declining (-3.0%/yr); year-one equity from $2k of loan paydown is wiped out by about $7k of value loss. Plan a longer hold.
- Wayne County population projected at -17% by 2050 — secular population decline; favor cash flow + early exit over multi-decade hold.
Negotiation context
- It's been on market 33 days — a 3% lower offer ($228k) is reasonable based on typical stale-listing flexibility.
- 6 sale attempts with the ask held roughly flat each time — persistent listings suggest the price (not the market) is what's stuck; bring a comps-based counter.
Risks & watch-outs
- Watch-outs: property tax is 3.6% of price; built in 1900 — expect roof / HVAC / electrical / plumbing capex.
Questions for the listing agent
- What do current leases actually rent for vs. the listed asking? Can we see a recent rent roll and the last 12 months of T-12 income?
- It's been on market 33 days. Have you received any prior offers? Is the seller open to a 23% concession, seller financing, or rate buy-down credit?
- Built in 1900 — when were the roof, HVAC, electrical panel, plumbing, and water heater last replaced?
- Property tax is high relative to price — has the assessment been appealed recently, and will the sale trigger a re-assessment?
- Is there a deadline driving the sale (1031 exchange, divorce, estate, relocation)? That informs how much negotiation room exists.
- Schools are F-rated, which usually means shorter tenancies and higher turnover. Who's the typical renter profile here, and what's been the actual vacancy rate?
- Crime grade is F in this area — have there been break-ins, vandalism, or insurance claims at this property in the last 3 years? What carrier currently insures it and at what premium?
- The area grade is low — what's the realistic commute time and amenity access for the typical tenant pool here? Any planned neighborhood developments (good or bad) we should know about?
- What's the average days-on-market for RENTAL listings here right now (not sales)? A rising rental-DOM trend means longer vacancies and softer asking-rent achievability than the comps imply.
- What's the recent tenant-quality profile in this submarket — average credit score on applications, eviction rate, late-payment / NSF rate, and stable-employment percentage? A property-management company in the area should have these aggregated.
- How much new for-sale + rental construction is in the pipeline within 1–3 miles? Heavy new supply typically softens prices + rents 12–24 months out; constrained supply supports both.
Investment metrics
- 1% rule
- 0.93% ✗
- Cap rate
- 4.74%
- Cash-on-cash
- -5.56%
- DSCR
- 0.75
- GRM
- 9.0
CMA / ARV
- ARV (median comp)
- $176,475
- List price
- $234,900
- Delta
- 33.11%
- Verdict
- OVERPRICED
- Comps
- 20 within 1.0 mi
Projected returns pro-forma
-3.0% appreciation · 7.3% rent growth · sell at horizon
- IRR
- -19.7%
- Equity multiple
- 0.28×
- Total profit
- $-47,345
- Equity at exit
- $35,024
- IRR
- -3.9%
- Equity multiple
- 0.68×
- Total profit
- $-20,903
- Equity at exit
- $20,310
Cash invested: $65,772 (down + closing). Projections, not guarantees.
Landlord ↔ Tenant lean methodology
- Overall (STATE)
- 62 Landlord-Friendly
- State Michigan
- 62 Landlord-Friendly · EVEN
- County
- — inherits STATE
- City
- — inherits STATE
ZIP-level market 48216
- Home prices YoY
- -2.3%
- Rents YoY
- 7.3%
- Active inventory
- 105
- Price-to-rent
- 9.0×
Monthly cashflow live
- Estimated rent
- $2,182 medium interval (Pro) →
- Mortgage (P&I)
- −$1,232
- Tax from tax record
- −$699 /mo · $8,390/yr
- Insurance
- −$98
- HOA
- −$0
- Vacancy / Maint / Mgmt
- −$458
- Net cashflow
- $-305
Break-even live
UW: 25.0% down · 7.5% · 30yr · 1.5% tax · 5.0% vac · 8.0% maint · 8.0% mgmt
Financing live
Cash to close
- Down payment
- $58,725
- Closing costs
- $7,047
- Reserves months
- —
- Total cash needed
- —
Loan-product check · same deal, 3 products live
Conventional
25% down · 7.5% · 30yr
- Down + closing
- —
- Monthly P&I
- —
- Monthly cashflow
- —
- DSCR
- —
- Eligible?
- —
Personal DTI + credit; lowest rate.
DSCR
20% down · 8.5% · 30yr
- Down + closing
- —
- Monthly P&I
- —
- Monthly cashflow
- —
- DSCR
- —
- Eligible?
- —
No personal income docs; deal must DSCR.
Hard money
10% down · 12.0% · 12mo
- Down + closing
- —
- Monthly P&I
- —
- Monthly cashflow
- —
- DSCR
- —
- Eligible?
- —
Short-term bridge; refi at stabilization.
Rent comps 1 comps
| Address | Beds | Baths | Sqft | Rent | $/sqft | DOM | Units | Dist |
|---|---|---|---|---|---|---|---|---|
| 1945 Junction St Detroit, MI | 7.0 | 2.0 | 2000 | $2,000 | $1.00 | 2d | 1 | 0.87mi |
Listing history 20 events
-
2026-06-18days on market $234,900 Active 33 DOM
-
2026-06-17days on market $234,900 Active 32 DOM
-
2026-06-15days on market $234,900 Active 30 DOM
-
2026-06-13days on market $234,900 Active 28 DOM
-
2026-06-13days on market $234,900 Active 27 DOM
-
2026-06-09days on market $234,900 Active 24 DOM
-
2026-06-08days on market $234,900 Active 23 DOM
-
2026-06-07days on market $234,900 Active 22 DOM
-
2026-06-04days on market $234,900 Active 19 DOM
-
2026-06-03days on market $234,900 Active 18 DOM
-
2026-06-02days on market $234,900 Active 17 DOM
-
2026-06-01days on market $234,900 Active 16 DOM
-
2026-05-31days on market $234,900 Active 15 DOM
-
2026-05-14status Pending 627-char remark
Show marketing remark (627 chars)
Investment Opportunity in Prime SW Detroit! Well-maintained situated on a rare double lot, offering immediate rental income with both units occupied by long-term tenants. The upper unit (1477) features 4 bedrooms, 1 full bath, and a private balcony. The lower unit (1475) offers 3 bedrooms and 1 full bath. Property includes a garage/storage unit and ample parking. Recent updates include newer electrical meters and fresh exterior paint. Ideal for investors seeking a solid, income-producing property with stable tenancy. Conveniently located near major roads, shopping, and dining. Great opportunity to add to your portfolio.
-
2026-05-01$234,900 Active 627-char remark
Show marketing remark (627 chars)
Investment Opportunity in Prime SW Detroit! Well-maintained situated on a rare double lot, offering immediate rental income with both units occupied by long-term tenants. The upper unit (1477) features 4 bedrooms, 1 full bath, and a private balcony. The lower unit (1475) offers 3 bedrooms and 1 full bath. Property includes a garage/storage unit and ample parking. Recent updates include newer electrical meters and fresh exterior paint. Ideal for investors seeking a solid, income-producing property with stable tenancy. Conveniently located near major roads, shopping, and dining. Great opportunity to add to your portfolio.
-
2026-01-05historical
-
2025-11-08$274,900 Active
-
2025-11-08$274,900 Active
ⓘ Source: listings_history table (triggers on properties + properties_extension) + one-shot
backfill from property_details.listing_events for pre-trigger history.
Tax reassessment forecast MI · Partial reset (capped growth)
- Current annual tax
- $8,390 · $699/mo
- Projected year-2 tax
- $8,390 · $699/mo
- Expected delta
- $0/yr ($0/mo · 0.0%)
ⓘ Screening estimate from a state-policy table — verify with the county assessor before closing.
Climate risk First Street
- Flood 1/10 Low FEMA zone X (unshaded) · 0% chance over 30 yrs
- Wildfire 1/10 Low
- Heat 3/10 Moderate 7 d/yr ≥97°F today · 15 d/yr by 30 yrs out
- Wind 2/10 Low
- Air quality 4/10 Moderate 6 unhealthy d/yr today · 8 by 30 yrs out
Nearby sold comps map
Loading sold comps map…
Walkable amenities ~0.75 mi
Loading nearby amenities…
Taxation est. · year 1
- Rental income
- $26,188
- − Mortgage interest
- −$13,158
- − Property taxes
- −$8,390
- − Insurance
- −$1,174
- − Repairs & maintenance
- −$2,095
- − Management
- −$2,095
- − Depreciation
- −$6,833
- Taxable loss
- −$7,558
- Est. tax savings @ 24.0%
- +$1,814
- After-tax cash flow
- $-1,844/yr
For passive investors: Depreciation is non-cash, so a rental often shows a tax loss while cash-flowing — sheltering income. Rental losses are passive: they offset passive income freely, and up to $25,000/yr can offset ordinary (W-2) income if you actively participate and your MAGI is under $100k (phasing out to $0 by $150k); unused losses carry forward. On sale, claimed depreciation is recaptured at up to 25%, and gains may owe capital-gains tax (a 1031 exchange can defer both). Figures are a year-1 estimate at your 24.0% rate — not tax advice; consult a CPA.
Schools (NCES district)
- District
- Detroit Public Schools Community District
- NCES district ID
- 2601103
- Math proficiency
- 10% ▼ -2.00%
- Reading proficiency
- 24% ▲ 6.00%
- Median HH income
- $25,815
- Composite
- 13.06/100
- National rank
- #9564
- State rank
- #499 of 540 in MI
Livability — Detroit
- Score
- 73/100
- State rank
- #218
- US rank
- #5427
Category grades
Schools grade is shown separately in the Schools card above.
Census & demographics
- Census place
- Detroit, MI
- County
- Wayne County · 1,562,939 people
- City population
- 572,865
- Metro
- Detroit-Warren-Dearborn, MI
- Population (ZIP)
- 5,865
- Household income
- $44,335
- Rent vs Own
- Severe rent burden
- 431.0
Population outlook (Wayne County) Hauer SSP2
- Today (2025)
- 1,675,273 people
- By 2030
- 1,620,300 · -3.3%
- By 2040
- 1,502,341 · -10.3%
- By 2050
- 1,384,039 · -17.4%
- By 2075
- 1,124,592 · -32.9%
- By 2100
- 881,193 · -47.4%
Race, ethnicity, and origin ACS 2023
- Neighborhood character
- Highly diverse neighborhood (Simpson 0.70)
- Race & ethnicity
- Black 37% White 32% Hispanic / Latino 24% Two or more races 10%
- Hispanic origin (detail)
- Mexican 18% Puerto Rican 2%
- Common ancestry
- Romanian 3% Slovak 2% Lithuanian 1%
- Foreign-born
- 8% · Canada, Jamaica
- Languages at home
- 83% English-only · Spanish 15% Arabic 1%
Political lean MEDSL · Wayne
- 2024 margin
- Strong D (+29.0) · D 62.7% · R 33.7% · Other 3.6%
- 2008→2024 swing
- -20.5pp toward R · 2008: 49.5pp · 2024: 29.0pp
- All cycles
- 2024: D+29.0 2020: D+38.1 2016: D+37.3 2012: D+46.9 2008: D+49.5
Not yet ingested
- Civics
- —
Market trends
- HPI YoY
- ▼ -4.60%
- Current HPI
- 194.458
- Rent YoY
- ▲ 7.30%
- Metro
- Detroit-Warren-Dearborn, MI
- State GDP YoY
- ▲ 1.37%
- F500 in state
- 28
Industry mix (Fortune 500 HQ in MI)
| Industry | F500 HQs | Revenue |
|---|---|---|
| Automotive Parts | 3 | $48B |
|
||
| Automotive | 2 | $372B |
|
||
| Chemicals | 1 | $45B |
|
||
| Automotive Retail | 1 | $29B |
|
||
| Healthcare / Medical Devices | 1 | $23B |
|
||
| Automotive Technology | 1 | $20B |
|
||
Price history
-14.6% since first listed9 events — show timeline
- 2026-05-29 Relisted — MiRealSource-MiMLS
- 2026-05-29 Relisted — REALCOMP
- 2026-05-14 Pending — REALCOMP
- 2026-05-14 Pending — MiRealSource-MiMLS
- 2026-05-01 Listed $234,900 REALCOMP
- 2026-05-01 Listed $234,900 MiRealSource-MiMLS
- 2026-01-05 Listing Removed — MiRealSource-MiMLS
- 2025-11-08 Listed $274,900 REALCOMP
- 2025-11-08 Listed $274,900 MiRealSource-MiMLS
Property tax history
+21.0%/yrLatest (2025): $8,390 · +0.3% YoY. Source: county tax records.
Cash-flow waterfall
monthlySold comps — $/sqft
last 12 mo · ≤1 miLoading sold comps…