 Multi-family
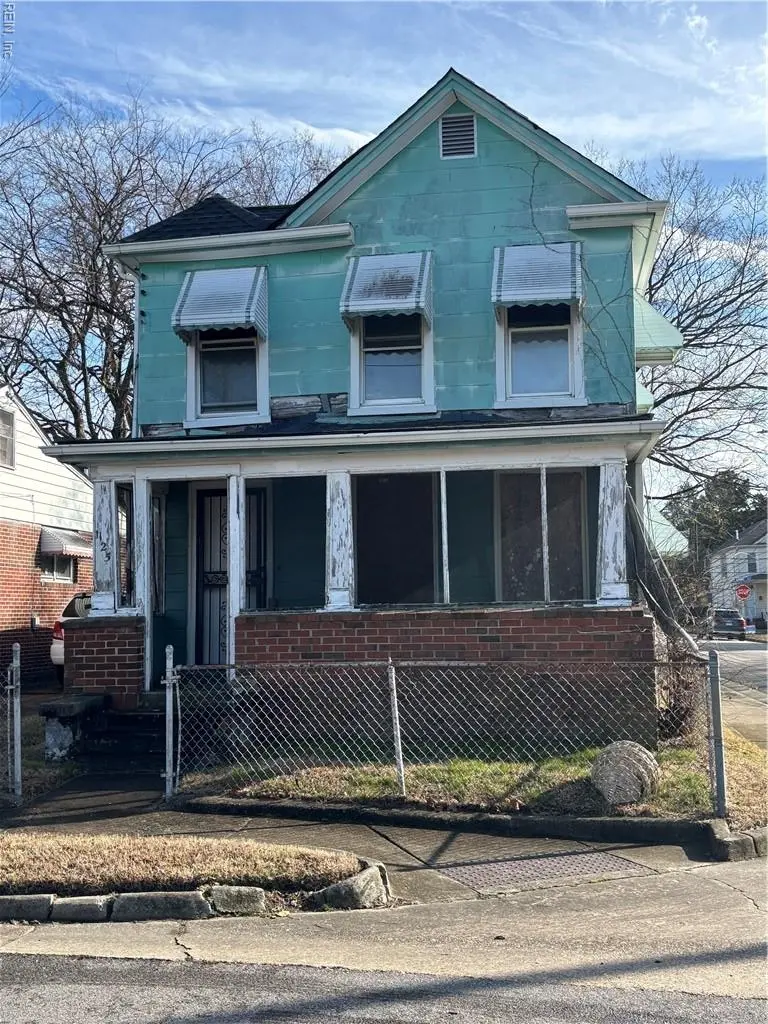
1125 Logan St · Norfolk, VA
Flood risk 6/10 · Moderate
- FEMA flood zone
- X (unshaded)
- Chance of flooding over 30 yrs
- 0.53%
- Est. flood insurance / yr
- $507 – $1,088
Fire risk 1/10 · Minimal
- Est. fire insurance / yr
- $666 – $1,236
Heat risk 9/10 · Severe
- Hot days now (above 104°F)
- 7 days/yr
- Hot days in 30 yrs
- 16 days/yr
Wind risk 8/10 · Major
- Chance of severe wind over 30 yrs
- 80.0%
Air-quality risk 3/10 · Minor
- Unhealthy air days now
- 2 days/yr
- Unhealthy air days in 30 yrs
- 5 days/yr
Risk factors via First Street. Map © Google.
Why this score? — see what drove the B grade
The composite is a weighted blend of 9 inputs, each scored 0–100. Each bar is that input's sub-score; the figure is the points it added to the 100-point composite (weight × sub-score).
- Cash flow +29.5/30.0
- DSCR +10.0/10.0
- 1% rule +8.3/10.0
- ARV discount +7.5/15.0
- Appreciation +5.0/10.0
- Livability +4.2/5.0
- Schools +3.5/10.0
- Rent growth +2.5/5.0
- Condition / age +2.5/5.0
$125,500
🖨 Deal sheet 📄 Offer letter ✓ Due diligence
Multi-family units
County records classify this as Multi-Family (2-4 Unit). Listing-text estimate: 1 unit. estimate disagrees with records
Listing remarks MLS
DUE TO THE CONDITION OF THE HOME, PLEASE BE SURE TO USE EXTREME CAUTION IN AND ON THE PROPERTY. HOLD HARMLESS FORM MUST FORM MUST BE SIGNED BY ALL PARTIES ENTERING THE HOME AND APPROVAL WILL BE GIVEN AFTER IT IS RETURNED TO LISTING AGENT. SELLER TO MAKE NO REPAIRS. PROPERTY BEING SOLD-AS , WHERE-IS. COURT APPROVAL IS REQUIRED SINCE IT IS CHURCH-OWNED PERFECT FOR AN INVESTOR
Key facts
- 2,639 sq ft lot
- Built 1917
- Listed 118 days
Neighborhood map
What this means for you Summary
Snapshot
- This is a 3-bed/2.0-bath multifamily listed at $126k.
Deal economics
- At list price, monthly cash flow is $448 ($5k/yr) — positive.
- The deal already cash-flows at list — no discount required.
- Meets the 1% rule at list price ($2k rent vs $126k).
- Recommended offer: $114k (9.0% below list) — sets the bar for market timing.
- Cap rate 10.6% vs local median 4.0% in Norfolk — top-decile yield for the area; either an underpriced asset or a hidden risk that comps aren't pricing in. Stress-test before assuming the spread holds.
Location & tenants
- Location reads 83/100 on livability (#43 in VA, #1,026 nationally) — a professional / high-income tenant draw. Strengths: amenities A+, commute A+, health & safety A+; Watch: employment C-, crime F.
- Norfolk City Public School District (urban): math 27% / reading 56% proficiency, ranked #118 of 131 in VA (top 90%) — families likely to look elsewhere, expect single-tenant / working-renter base with shorter leases.
- Market conditions: 1 active listings in the ZIP; 20 comparable units currently listed for rent nearby; rentals at typical pace (median 17d on market — plan ~3-4 weeks tenant-placement turnaround); 438 units permitted in Norfolk city in 2024 (273 in 5+ unit buildings).
Forward outlook
- In year one you build about $5k of equity ($868 loan paydown + $4k appreciation (3.0% local appreciation)).
- At projected returns (3.0% appreciation + 3.0% rent growth), your $35k cash investment doubles in ~4 years — after that, you're playing with house money.
- By year 8, paydown + projected appreciation supports a ~$34k cash-out refi (75% LTV) — recoverable capital for the next deal without selling this one.
Negotiation context
- It's been on market 118 days — a 9% lower offer ($114k) is reasonable based on typical stale-listing flexibility.
- 2 sale attempts; this cycle's ask has dropped $32k (20%) from the opening price — seller is motivated, your offer sets the floor, not the list.
Risks & watch-outs
- Watch-outs: built in 1917 — expect roof / HVAC / electrical / plumbing capex.
- Climate carrying-cost: major flood risk; severe wind risk, 80% chance of damaging wind over 30y; extreme-heat days projected 7→16/yr by 2055 (HVAC capex compounding) — expect insurance premiums to compound above CPI over the hold.
Questions for the listing agent
- It's been on market 118 days. Have you received any prior offers? Is the seller open to a 9% concession, seller financing, or rate buy-down credit?
- Built in 1917 — when were the roof, HVAC, electrical panel, plumbing, and water heater last replaced?
- Why hasn't it sold? Are there any deal-killer items the seller is aware of (foundation, flood, title, zoning, code violations)?
- Is there a deadline driving the sale (1031 exchange, divorce, estate, relocation)? That informs how much negotiation room exists.
- Schools are A-rated — typically a magnet for longer-tenancy family renters. What's the average tenant stay here, and is there a school-zone premium baked into asking?
- Crime grade is F in this area — have there been break-ins, vandalism, or insurance claims at this property in the last 3 years? What carrier currently insures it and at what premium?
- What's the average days-on-market for RENTAL listings here right now (not sales)? A rising rental-DOM trend means longer vacancies and softer asking-rent achievability than the comps imply.
- What's the recent tenant-quality profile in this submarket — average credit score on applications, eviction rate, late-payment / NSF rate, and stable-employment percentage? A property-management company in the area should have these aggregated.
- How much new apartment / multifamily construction is in the pipeline within 1–3 miles? Heavy new supply (>2% of stock underway) typically softens rents 12–24 months out; light construction supports rent growth.
Investment metrics
- 1% rule
- 1.33% ✓
- Cap rate
- 10.58%
- Cash-on-cash
- 15.31%
- DSCR
- 1.68
- GRM
- 6.3
CMA / ARV
- ARV (median comp)
- $266,711
- List price
- $125,500
- Delta
- -52.95%
- Verdict
- UNDERPRICED
- Comps
- 20 within 1.0 mi
Projected returns pro-forma
3.0% appreciation · 3.0% rent growth · sell at horizon
- IRR
- 21.9%
- Equity multiple
- 2.24×
- Total profit
- $43,708
- Equity at exit
- $56,430
- IRR
- 22.9%
- Equity multiple
- 4.29×
- Total profit
- $115,627
- Equity at exit
- $86,966
Cash invested: $35,140 (down + closing). Projections, not guarantees.
Landlord ↔ Tenant lean methodology
- Overall (STATE)
- 55 Moderately Landlord-Leaning
- State Virginia
- 55 Moderately Landlord-Leaning · D+2
- County
- — inherits STATE
- City
- — inherits STATE
ZIP-level market 23501
- Active inventory
- 1
- Price-to-rent
- 6.3×
Monthly cashflow live
- Estimated rent
- $1,671 high interval (Pro) →
- Mortgage (P&I)
- −$658
- Tax from tax record
- −$161 /mo · $1,935/yr
- Insurance
- −$52
- HOA
- −$0
- Vacancy / Maint / Mgmt
- −$351
- Net cashflow
- $448
Break-even live
UW: 25.0% down · 7.5% · 30yr · 1.5% tax · 5.0% vac · 8.0% maint · 8.0% mgmt
Financing live
Cash to close
- Down payment
- $31,375
- Closing costs
- $3,765
- Reserves months
- —
- Total cash needed
- —
Loan-product check · same deal, 3 products live
Conventional
25% down · 7.5% · 30yr
- Down + closing
- —
- Monthly P&I
- —
- Monthly cashflow
- —
- DSCR
- —
- Eligible?
- —
Personal DTI + credit; lowest rate.
DSCR
20% down · 8.5% · 30yr
- Down + closing
- —
- Monthly P&I
- —
- Monthly cashflow
- —
- DSCR
- —
- Eligible?
- —
No personal income docs; deal must DSCR.
Hard money
10% down · 12.0% · 12mo
- Down + closing
- —
- Monthly P&I
- —
- Monthly cashflow
- —
- DSCR
- —
- Eligible?
- —
Short-term bridge; refi at stabilization.
Rent comps 20 comps
| Address | Beds | Baths | Sqft | Rent | $/sqft | DOM | Units | Dist |
|---|---|---|---|---|---|---|---|---|
| 1111 Charleston St Norfolk, VA | 2.0 | 1.0 | 822 | $1,425 | $1.73 | 43d | 1 | 0.08mi |
| 7472 Major Ave Norfolk, VA | 4.0 | 1.5 | 1400 | $2,600 | $1.86 | 17d | 1 | 0.20mi |
| 7704 Enfield Ave Norfolk, VA | 2.0 | 1.0 | 725 | $1,250 | $1.72 | 23d | 1 | 0.26mi |
| 7304 Major Ave Norfolk, VA | 3.0 | 2.0 | 944 | $2,100 | $2.22 | 43d | 1 | 0.36mi |
| 7872 Ogden Ave Norfolk, VA | 1.0–3.0 | 1.0–2.0 | 963 | $1,515 | $1.57 | 43d | 1 | 0.54mi |
| 7730 Ruthven Rd Norfolk, VA | 3.0 | 1.0 | 1056 | $1,750 | $1.66 | 23d | 1 | 0.62mi |
| 7715 Harrisons Rd Norfolk, VA | 2.0 | 1.0 | 1004 | $1,645 | $1.64 | 23d | 1 | 0.73mi |
| 7715 Harrisons Rd Norfolk, VA | 2.0 | 1.0 | 862 | $1,620 | $1.88 | 16d | 8 | 0.73mi |
| 7715 Harrison Rd Unit 7720-5 Norfolk, VA | 2.0 | 1.0 | 1004 | $1,645 | $1.64 | 43d | 1 | 0.73mi |
| 502 Grantham Rd Norfolk, VA | 1.0–2.0 | 1.0 | 740 | $1,128 | $1.52 | 43d | 3 | 0.74mi |
| 307 W Little Creek Rd Unit C Norfolk, VA | 2.0 | 1.0 | 830 | $1,395 | $1.68 | 10d | 1 | 0.97mi |
| 1226 Richmond Cres Norfolk, VA | 2.0 | 2.0 | 1000 | $2,000 | $2.00 | 17d | 1 | 1.13mi |
| 1226 Richmond Cres Norfolk, VA | 2.0 | 2.0 | 1000 | $2,000 | $2.00 | 2d | 1 | 1.13mi |
| 412 Forrest Ave Unit 2 Norfolk, VA | 2.0 | 1.0 | 1003 | $1,145 | $1.14 | 14d | 1 | 1.36mi |
| 412 Forrest Ave Unit 2 Norfolk, VA | 2.0 | 1.0 | 1003 | $1,145 | $1.14 | 4d | 1 | 1.36mi |
| 223 Woodview Ave Unit B Norfolk, VA | 2.0 | 1.0 | 751 | $1,250 | $1.66 | 7d | 1 | 1.40mi |
| 218 Granby Park Dr Unit B Norfolk, VA | 3.0 | 1.0 | 1330 | $1,795 | $1.35 | 4d | 1 | 1.41mi |
| 218 Granby Park Dr Unit B Norfolk, VA | 3.0 | 1.0 | 1330 | $1,695 | $1.27 | 3d | 1 | 1.41mi |
| 218 Granby Park Dr Unit B Norfolk, VA | 3.0 | 1.0 | 1330 | $1,745 | $1.31 | 12d | 1 | 1.41mi |
| 8600 Glen Myrtle Ave Norfolk, VA | 1.0–2.0 | 1.0 | 820 | $1,589 | $1.94 | 2d | 18 | 1.47mi |
Listing history 16 events
-
2026-06-18days on market $125,500 Active 118 DOM
-
2026-06-17days on market $125,500 Active 117 DOM
-
2026-06-16days on market $125,500 Active 116 DOM
-
2026-06-15days on market $125,500 Active 115 DOM
-
2026-06-13days on market $125,500 Active 113 DOM
-
2026-06-09days on market $125,500 Active 109 DOM
-
2026-06-08days on market $125,500 Active 108 DOM
-
2026-06-07days on market $125,500 Active 107 DOM
-
2026-06-03days on market $125,500 Active 103 DOM
-
2026-06-02days on market $125,500 Active 102 DOM
-
2026-06-01days on market $125,500 Active 101 DOM
-
2026-05-31days on market $125,500 Active 100 DOM
-
2026-05-06price $125,500 376-char remark
Show marketing remark (376 chars)
DUE TO THE CONDITION OF THE HOME, PLEASE BE SURE TO USE EXTREME CAUTION IN AND ON THE PROPERTY. HOLD HARMLESS FORM MUST FORM MUST BE SIGNED BY ALL PARTIES ENTERING THE HOME AND APPROVAL WILL BE GIVEN AFTER IT IS RETURNED TO LISTING AGENT. SELLER TO MAKE NO REPAIRS. PROPERTY BEING SOLD-AS , WHERE-IS. COURT APPROVAL IS REQUIRED SINCE IT IS CHURCH-OWNED PERFECT FOR AN INVESTOR
-
2026-03-19status Active 376-char remark
Show marketing remark (376 chars)
DUE TO THE CONDITION OF THE HOME, PLEASE BE SURE TO USE EXTREME CAUTION IN AND ON THE PROPERTY. HOLD HARMLESS FORM MUST FORM MUST BE SIGNED BY ALL PARTIES ENTERING THE HOME AND APPROVAL WILL BE GIVEN AFTER IT IS RETURNED TO LISTING AGENT. SELLER TO MAKE NO REPAIRS. PROPERTY BEING SOLD-AS , WHERE-IS. COURT APPROVAL IS REQUIRED SINCE IT IS CHURCH-OWNED PERFECT FOR AN INVESTOR
-
2026-03-09historical Active Under Contract 376-char remark
Show marketing remark (376 chars)
DUE TO THE CONDITION OF THE HOME, PLEASE BE SURE TO USE EXTREME CAUTION IN AND ON THE PROPERTY. HOLD HARMLESS FORM MUST FORM MUST BE SIGNED BY ALL PARTIES ENTERING THE HOME AND APPROVAL WILL BE GIVEN AFTER IT IS RETURNED TO LISTING AGENT. SELLER TO MAKE NO REPAIRS. PROPERTY BEING SOLD-AS , WHERE-IS. COURT APPROVAL IS REQUIRED SINCE IT IS CHURCH-OWNED PERFECT FOR AN INVESTOR
-
2026-02-20$157,300 Active 376-char remark
Show marketing remark (376 chars)
DUE TO THE CONDITION OF THE HOME, PLEASE BE SURE TO USE EXTREME CAUTION IN AND ON THE PROPERTY. HOLD HARMLESS FORM MUST FORM MUST BE SIGNED BY ALL PARTIES ENTERING THE HOME AND APPROVAL WILL BE GIVEN AFTER IT IS RETURNED TO LISTING AGENT. SELLER TO MAKE NO REPAIRS. PROPERTY BEING SOLD-AS , WHERE-IS. COURT APPROVAL IS REQUIRED SINCE IT IS CHURCH-OWNED PERFECT FOR AN INVESTOR
ⓘ Source: listings_history table (triggers on properties + properties_extension) + one-shot
backfill from property_details.listing_events for pre-trigger history.
Tax reassessment forecast VA · Resets to sale price
- Current annual tax
- $1,935 · $161/mo
- Projected year-2 tax
- $1,935 · $161/mo
- Expected delta
- $0/yr ($0/mo · 0.0%)
ⓘ Screening estimate from a state-policy table — verify with the county assessor before closing.
Climate risk First Street
- Flood 6/10 Major FEMA zone X (unshaded) · 53% chance over 30 yrs
- Wildfire 1/10 Low
- Heat 9/10 Extreme 7 d/yr ≥104°F today · 16 d/yr by 30 yrs out
- Wind 8/10 Severe 80% chance of damaging wind over 30 yrs
- Air quality 3/10 Moderate 2 unhealthy d/yr today · 5 by 30 yrs out
Nearby sold comps map
Loading sold comps map…
Walkable amenities ~0.75 mi
Loading nearby amenities…
Taxation est. · year 1
- Rental income
- $20,052
- − Mortgage interest
- −$7,030
- − Property taxes
- −$1,935
- − Insurance
- −$628
- − Repairs & maintenance
- −$1,604
- − Management
- −$1,604
- − Depreciation
- −$3,651
- Taxable income
- $3,601
- Est. tax owed @ 24.0%
- −$864
- After-tax cash flow
- $4,517/yr
For passive investors: Depreciation is non-cash, so a rental often shows a tax loss while cash-flowing — sheltering income. Rental losses are passive: they offset passive income freely, and up to $25,000/yr can offset ordinary (W-2) income if you actively participate and your MAGI is under $100k (phasing out to $0 by $150k); unused losses carry forward. On sale, claimed depreciation is recaptured at up to 25%, and gains may owe capital-gains tax (a 1031 exchange can defer both). Figures are a year-1 estimate at your 24.0% rate — not tax advice; consult a CPA.
Schools (NCES district)
- District
- Norfolk City Public School District
- NCES district ID
- 5102670
- Math proficiency
- 27% ▼ -44.00%
- Reading proficiency
- 56% ▼ -10.00%
- Median HH income
- $44,358
- Composite
- 35.08/100
- National rank
- #5026
- State rank
- #118 of 131 in VA
Livability — Norfolk
- Score
- 83/100
- State rank
- #43
- US rank
- #1026
Category grades
Schools grade is shown separately in the Schools card above.
Census & demographics
- Census place
- Norfolk, VA
Population outlook (Norfolk County) Hauer SSP2
- Today (2025)
- 249,032 people
- By 2030
- 252,347 · +1.3%
- By 2040
- 253,644 · +1.9%
- By 2050
- 251,913 · +1.2%
- By 2075
- 245,281 · -1.5%
- By 2100
- 219,548 · -11.8%
Not yet ingested
- Political lean
- —
- Race & ethnicity
- —
- Common origin
- —
- Civics
- —
Market trends
- HPI YoY
- —
- Current HPI
- —
- Rent YoY
- —
- Metro
- —
- State GDP YoY
- ▲ 2.40%
- F500 in state
- 50
Industry mix (Fortune 500 HQ in VA)
| Industry | F500 HQs | Revenue |
|---|---|---|
| Aerospace / Defense | 4 | $236B |
|
||
| Technology / Defense | 3 | $32B |
|
||
| Financial Services | 2 | $176B |
|
||
| Utilities | 2 | $27B |
|
||
| Insurance | 2 | $25B |
|
||
| Technology | 2 | $15B |
|
||
Price history
-20.2% since first listed4 events — show timeline
- 2026-05-06 Price Changed $125,500 REINMLS
- 2026-03-19 Relisted — REINMLS
- 2026-03-09 Contingent — REINMLS
- 2026-02-20 Listed $157,300 REINMLS
Property tax history
+5.5%/yrLatest (2025): $1,935 · +13.5% YoY. Source: county tax records.
Cash-flow waterfall
monthlySold comps — $/sqft
last 12 mo · ≤1 miLoading sold comps…