222 Charles Ave · Portsmouth, VA
Flood risk 4/10 · Minor
- FEMA flood zone
- X (unshaded)
- Chance of flooding over 30 yrs
- 0.13%
- Est. flood insurance / yr
- $507 – $1,088
Fire risk 1/10 · Minimal
- Est. fire insurance / yr
- $666 – $1,236
Heat risk 9/10 · Severe
- Hot days now (above 106°F)
- 7 days/yr
- Hot days in 30 yrs
- 16 days/yr
Wind risk 8/10 · Major
- Chance of severe wind over 30 yrs
- 80.0%
Air-quality risk 5/10 · Moderate
- Unhealthy air days now
- 6 days/yr
- Unhealthy air days in 30 yrs
- 7 days/yr
Risk factors via First Street. Map © Google.
Why this score? — see what drove the D grade
The composite is a weighted blend of 9 inputs, each scored 0–100. Each bar is that input's sub-score; the figure is the points it added to the 100-point composite (weight × sub-score).
- Appreciation +10.0/10.0
- ARV discount +7.3/15.0
- Cash flow +7.1/30.0
- Schools +3.9/10.0
- Livability +3.7/5.0
- Rent growth +3.5/5.0
- Condition / age +2.5/5.0
- 1% rule +1.3/10.0
- DSCR +1.3/10.0
$219,900
🖨 Deal sheet (PDF) 📄 Offer letter ✓ Due diligence
Listing remarks MLS
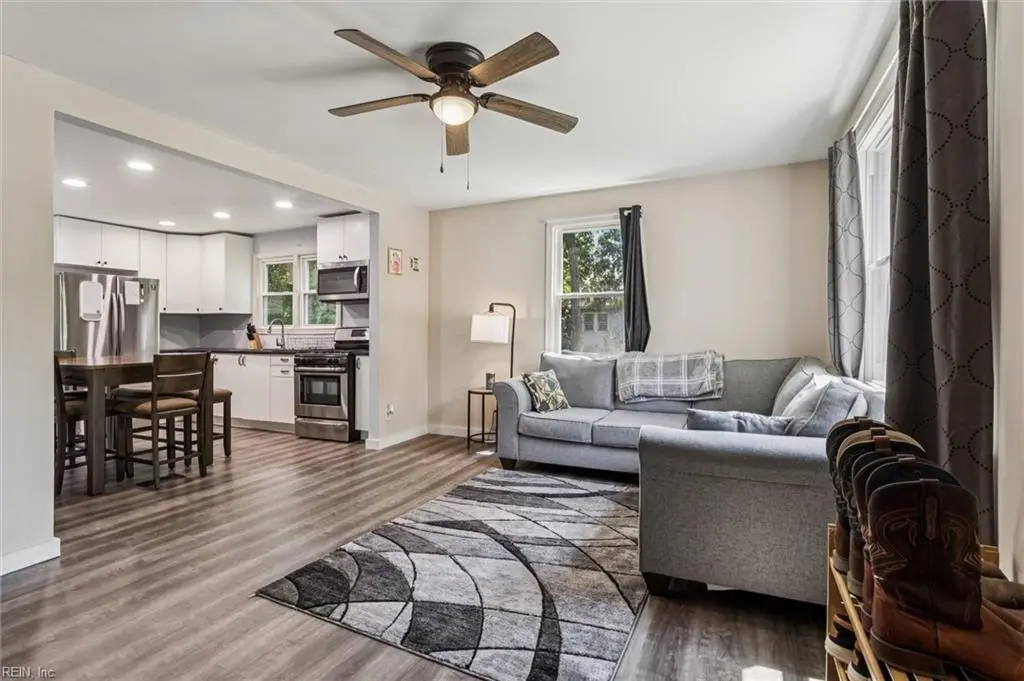
Come and see this one first! This charming 2 bedroom home is fully updated with modern finishings, an updated kitchen, baths, and living area. It has an oversized backyard with a detached 1 car garage / workshop, and it in close proximity to food, shopping, and the interstate. Boasting tons of natural light, this super clean move in ready home is perfect.
Key facts
- Updated kitchen
- Move in ready
- Oversized backyard
Tags
Neighborhood map
What this means for you Summary
Snapshot
- This is a 2-bed/1.0-bath single-family listed at $220k.
Deal economics
- At list price, monthly cash flow is $-317 ($-4k/yr) — negative.
- To cash-flow at today's rent, offer at most $164k (25.5% below list).
- To meet the 1% rule (rent ≥ 1% of price), the offer needs to be $139k (36.8% below list).
- Recommended offer: $139k (36.8% below list) — sets the bar for 1% rule.
Location & tenants
- Location reads 73/100 on livability (#172 in VA) — a middle-class / working-renter tenant base. Strengths: amenities A+, cost of living A+, housing A+; Watch: employment C-, crime F, commute F.
- Portsmouth City Public School District (urban): math 34% / reading 58% proficiency, ranked #107 of 131 in VA (top 82%) — families likely to look elsewhere, expect single-tenant / working-renter base with shorter leases.
- Market conditions: Rents rising (+4.0%/yr); 64 active listings in the ZIP; 25 comparable units currently listed for rent nearby; rentals at typical pace (median 25d on market — plan ~3-4 weeks tenant-placement turnaround); 300 units permitted in Portsmouth city in 2024 (112 in 5+ unit buildings).
- This rent runs 34% of the median local income ($49k/yr) — at the standard rent-burdened threshold; future hikes will face affordability resistance.
Forward outlook
- In year one you build about $24k of equity ($2k loan paydown + $22k appreciation (10.0% local appreciation)).
- By year 2, paydown + projected appreciation supports a ~$38k cash-out refi (75% LTV) — recoverable capital for the next deal without selling this one.
Negotiation context
- It's been on market 64 days — a 6% lower offer ($207k) is reasonable based on typical stale-listing flexibility.
- 6 sale attempts since 3y ago with the ask held roughly flat each time — persistent listings suggest the price (not the market) is what's stuck; bring a comps-based counter.
Risks & watch-outs
- Watch-outs: built in 1950 — expect roof / HVAC / electrical / plumbing capex.
- Climate carrying-cost: severe wind risk, 80% chance of damaging wind over 30y; extreme-heat days projected 7→16/yr by 2055 (HVAC capex compounding) — expect insurance premiums to compound above CPI over the hold.
Questions for the listing agent
- What do current leases actually rent for vs. the listed asking? Can we see a recent rent roll and the last 12 months of T-12 income?
- It's been on market 64 days. Have you received any prior offers? Is the seller open to a 37% concession, seller financing, or rate buy-down credit?
- Built in 1950 — when were the roof, HVAC, electrical panel, plumbing, and water heater last replaced?
- Why hasn't it sold? Are there any deal-killer items the seller is aware of (foundation, flood, title, zoning, code violations)?
- Is there a deadline driving the sale (1031 exchange, divorce, estate, relocation)? That informs how much negotiation room exists.
- Schools are B-rated — typically a magnet for longer-tenancy family renters. What's the average tenant stay here, and is there a school-zone premium baked into asking?
- Crime grade is F in this area — have there been break-ins, vandalism, or insurance claims at this property in the last 3 years? What carrier currently insures it and at what premium?
- The area grade is low — what's the realistic commute time and amenity access for the typical tenant pool here? Any planned neighborhood developments (good or bad) we should know about?
- What's the average days-on-market for RENTAL listings here right now (not sales)? A rising rental-DOM trend means longer vacancies and softer asking-rent achievability than the comps imply.
- What's the recent tenant-quality profile in this submarket — average credit score on applications, eviction rate, late-payment / NSF rate, and stable-employment percentage? A property-management company in the area should have these aggregated.
- How much new for-sale + rental construction is in the pipeline within 1–3 miles? Heavy new supply typically softens prices + rents 12–24 months out; constrained supply supports both.
Investment metrics
- 1% rule
- 0.63% ✗
- Cap rate
- 4.56%
- Cash-on-cash
- -6.17%
- DSCR
- 0.73
- GRM
- 13.2
CMA / ARV
- ARV (median comp)
- $218,853
- List price
- $219,900
- Delta
- 0.48%
- Verdict
- FAIR
- Comps
- 20 within 1.0 mi
Show comp detail 12 sales within ~0.75 mi
| Address | Dist | Beds/Ba | Sqft | Sold | Price | $/sf | Match |
|---|---|---|---|---|---|---|---|
| 222 Charles Ave | 0.00mi | 2/1.0 | 822 (0%) | 0mo | $219,900 | $268 | 100 |
| 321 Beacon Rd | 0.26mi | 3/1.0 (+1) | 864 (+5%) | 1mo | $155,000 | $179 | 73 |
| 521 Beacon Rd | 0.42mi | 3/1.0 (+1) | 864 (+5%) | 1mo | $135,000 | $156 | 66 |
| 3302 Elliott Ave | 0.49mi | 2/1.0 | 772 (-6%) | 6mo | $185,000 | $240 | 62 |
| 30 Manly St | 0.31mi | 2/1.0 | 918 (+12%) | 8mo | $140,000 | $153 | 60 |
| 3312 Knox St | 0.56mi | 2/1.0 | 770 (-6%) | 5mo | $210,000 | $273 | 59 |
| 4004 Deep Creek Blvd | 0.36mi | 2/1.0 | 720 (-12%) | 5mo | $190,000 | $264 | 58 |
| 218 Castlewood Rd | 0.68mi | 3/1.0 (+1) | 864 (+5%) | 3mo | $136,000 | $157 | 53 |
| 801 Finchley Rd | 0.71mi | 2/1.0 | 755 (-8%) | 1mo | $195,000 | $258 | 52 |
| 4409 Deep Creek Blvd | 0.61mi | 3/1.5 (+1) | 864 (+5%) | 7mo | $230,000 | $266 | 50 |
| 2707 Arcadia Ave | 0.60mi | 2/1.0 | 700 (-15%) | 4mo | $205,000 | $293 | 44 |
| 18 Neville St | 0.72mi | 2/1.0 | 698 (-15%) | 0mo | $198,000 | $284 | 41 |
Match score weights: distance 35% · size 25% · config 20% · recency 20%. Top-matched comps best support the ARV.
Projected returns pro-forma
10.0% appreciation · 3.97% rent growth · sell at horizon
- IRR
- 20.1%
- Equity multiple
- 2.64×
- Total profit
- $100,910
- Equity at exit
- $198,103
- IRR
- 18.6%
- Equity multiple
- 6.13×
- Total profit
- $315,832
- Equity at exit
- $427,217
Cash invested: $61,572 (down + closing). Projections, not guarantees.
Landlord ↔ Tenant lean methodology
- Overall (STATE)
- 55 Moderately Landlord-Leaning
- State Virginia
- 55 Moderately Landlord-Leaning · D+2
- County
- — inherits STATE
- City
- — inherits STATE
ZIP-level market 23702
- Home prices YoY
- 5.2%
- Rents YoY
- 4.0%
- Active inventory
- 64
- Price-to-rent
- 13.2×
Monthly cashflow live
- Estimated rent
- $1,389 high interval (Pro) →
- Mortgage (P&I)
- −$1,153
- Tax from tax record
- −$169 /mo · $2,029/yr
- Insurance
- −$92
- HOA
- −$0
- Vacancy / Maint / Mgmt
- −$292
- Net cashflow
- $-317
Break-even live
Sensitivity live
| Price | -10% $-192 | -5% $-255 | +0% $-317 | +5% $-379 | +10% $-441 |
|---|---|---|---|---|---|
| Rent | -10% $-427 | -5% $-372 | +0% $-317 | +5% $-262 | +10% $-207 |
| Rate | -1.0pp $-206 | -0.5pp $-261 | base $-317 | +0.5pp $-374 | +1.0pp $-432 |
UW: 25.0% down · 7.5% · 30yr · 1.5% tax · 5.0% vac · 8.0% maint · 8.0% mgmt
Financing live
Cash to close
- Down payment
- $54,975
- Closing costs
- $6,597
- Reserves months
- —
- Total cash needed
- —
Loan-product check · same deal, 3 products live
Conventional
25% down · 7.5% · 30yr
- Down + closing
- —
- Monthly P&I
- —
- Monthly cashflow
- —
- DSCR
- —
- Eligible?
- —
Personal DTI + credit; lowest rate.
DSCR
20% down · 8.5% · 30yr
- Down + closing
- —
- Monthly P&I
- —
- Monthly cashflow
- —
- DSCR
- —
- Eligible?
- —
No personal income docs; deal must DSCR.
Hard money
10% down · 12.0% · 12mo
- Down + closing
- —
- Monthly P&I
- —
- Monthly cashflow
- —
- DSCR
- —
- Eligible?
- —
Short-term bridge; refi at stabilization.
Rent comps 25 comps
| Address | Beds | Baths | Sqft | Rent | $/sqft | DOM | Units | Dist |
|---|---|---|---|---|---|---|---|---|
| 21 DeKalb Ave Portsmouth, VA | 2.0 | 1.0 | 984 | $1,550 | $1.58 | 44d | 1 | 0.17mi |
| 3724 Deep Creek Blvd Unit 3754 Portsmouth, VA | 2.0 | 1.0 | 900 | $995 | $1.11 | 13d | 1 | 0.19mi |
| 3724 Deep Creek Blvd Unit 3728 Portsmouth, VA | 2.0 | 1.0 | 900 | $995 | $1.11 | 24d | 1 | 0.19mi |
| 70 Manly St Portsmouth, VA | 2.0 | 1.0 | 1000 | $1,350 | $1.35 | 44d | 1 | 0.29mi |
| 231 Edison Ave Portsmouth, VA | 2.0 | 1.5 | 1100 | $1,275 | $1.16 | 20d | 1 | 0.49mi |
| 231 Edison Ave Unit 231 Portsmouth, VA | 2.0 | 1.5 | 1050 | $1,275 | $1.21 | 11d | 1 | 0.49mi |
| 11 Carver Cir Portsmouth, VA | 2.0 | 1.0 | 695 | $1,395 | $2.01 | 44d | 1 | 0.52mi |
| 1 Shelby St Portsmouth, VA | 2.0 | 1.0 | 700 | $1,250 | $1.79 | 24d | 1 | 0.56mi |
| 49 Carver Cir Portsmouth, VA | 2.0 | 2.0 | 800 | $1,450 | $1.81 | 24d | 1 | 0.61mi |
| 3304 Killian Ave Portsmouth, VA | 3.0 | 1.0 | 800 | $2,000 | $2.50 | 24d | 1 | 0.66mi |
| 2810 Roanoke Ave Portsmouth, VA | 3.0 | 1.5 | 1100 | $2,100 | $1.91 | 44d | 1 | 0.77mi |
| 98 Francis St Portsmouth, VA | 2.0 | 2.0 | 984 | $1,395 | $1.42 | 15d | 1 | 0.95mi |
| 102 Francis St #98 Portsmouth, VA | 2.0 | 1.5 | 1000 | $1,395 | $1.40 | 17d | 1 | 0.95mi |
| 104 Cushing St Unit 104 Portsmouth, VA | 1.0 | 1.0 | 700 | $1,095 | $1.56 | 21d | 1 | 1.00mi |
| 104 Cushing St Portsmouth, VA | 1.0 | 1.0 | 700 | $1,200 | $1.71 | 21d | 1 | 1.00mi |
| 9 Seminole Dr Portsmouth, VA | 1.0–2.0 | 1.0 | 545 | $1,155 | $2.12 | 45d | 5 | 1.06mi |
| 9 Seminole Dr Unit SEB08-N Portsmouth, VA | 2.0 | 1.0 | 610 | $1,050 | $1.72 | 44d | 1 | 1.10mi |
| 1915 Des Moines Ave Portsmouth, VA | 3.0 | 1.0 | 1070 | $1,700 | $1.59 | 24d | 1 | 1.15mi |
| 1915 Des Moines Ave Portsmouth, VA | 3.0 | 1.0 | 1070 | $1,700 | $1.59 | 17d | 1 | 1.15mi |
| 1915 Lansing Ave Portsmouth, VA | 3.0 | 1.0 | 1085 | $1,675 | $1.54 | 4d | 1 | 1.18mi |
| 18 Cooper Dr Portsmouth, VA | 2.0 | 1.0 | 920 | $1,400 | $1.52 | 18d | 1 | 1.33mi |
| 2756 Peach St Portsmouth, VA | 2.0 | 1.5 | 1040 | $1,495 | $1.44 | 24d | 1 | 1.34mi |
| 2007 Elm Ave Portsmouth, VA | 3.0 | 1.0 | 903 | $1,300 | $1.44 | 21d | 1 | 1.40mi |
| 2906 Chestnut St Unit 1328007P Portsmouth, VA | 2.0 | 1.0 | 947 | $4,650 | $4.91 | 8d | 1 | 1.41mi |
| 1416 Richmond Ave Portsmouth, VA | 2.0 | 1.0 | 1024 | $1,150 | $1.12 | 44d | 1 | 1.45mi |
Listing history 25 events
-
2026-06-13statusdays on market $219,900 Under Contract 64 DOM
-
2026-06-09days on market $219,900 Active Under Contract 63 DOM
-
2026-06-08days on market $219,900 Active Under Contract 62 DOM
-
2026-06-07days on market $219,900 Active Under Contract 61 DOM
-
2026-06-03days on market $219,900 Active Under Contract 57 DOM
-
2026-06-02days on market $219,900 Active Under Contract 56 DOM
-
2026-06-01days on market $219,900 Active Under Contract 55 DOM
-
2026-05-31days on market $219,900 Active Under Contract 54 DOM
-
2026-05-15historical Active Under Contract 357-char remark
Show marketing remark (357 chars)
Come and see this one first! This charming 2 bedroom home is fully updated with modern finishings, an updated kitchen, baths, and living area. It has an oversized backyard with a detached 1 car garage / workshop, and it in close proximity to food, shopping, and the interstate. Boasting tons of natural light, this super clean move in ready home is perfect.
-
2026-04-30status Active 357-char remark
Show marketing remark (357 chars)
Come and see this one first! This charming 2 bedroom home is fully updated with modern finishings, an updated kitchen, baths, and living area. It has an oversized backyard with a detached 1 car garage / workshop, and it in close proximity to food, shopping, and the interstate. Boasting tons of natural light, this super clean move in ready home is perfect.
-
2026-04-16historical Active Under Contract 357-char remark
Show marketing remark (357 chars)
Come and see this one first! This charming 2 bedroom home is fully updated with modern finishings, an updated kitchen, baths, and living area. It has an oversized backyard with a detached 1 car garage / workshop, and it in close proximity to food, shopping, and the interstate. Boasting tons of natural light, this super clean move in ready home is perfect.
-
2026-04-07$219,900 Active 357-char remark
Show marketing remark (357 chars)
Come and see this one first! This charming 2 bedroom home is fully updated with modern finishings, an updated kitchen, baths, and living area. It has an oversized backyard with a detached 1 car garage / workshop, and it in close proximity to food, shopping, and the interstate. Boasting tons of natural light, this super clean move in ready home is perfect.
-
2026-03-31historical
-
2026-02-28status Active
-
2026-01-25historical Active Under Contract
-
2025-10-21price $219,900
-
2025-09-02$224,900 Active
-
2025-08-29historical $2,000
-
2025-07-25$2,000
-
2023-09-13soldstatus $200,000
-
2023-08-07status Under Contract
-
2023-07-31historical Active Under Contract
-
2023-07-25$195,000 Active
-
2010-06-22soldstatus $83,500
-
2005-03-09soldstatus $112,000
ⓘ Source: listings_history table (triggers on properties + properties_extension) + one-shot
backfill from property_details.listing_events for pre-trigger history.
Tax reassessment forecast VA · Resets to sale price
- Current annual tax
- $2,029 · $169/mo
- Projected year-2 tax
- $2,029 · $169/mo
- Expected delta
- $0/yr ($0/mo · 0.0%)
ⓘ Screening estimate from a state-policy table — verify with the county assessor before closing.
Climate risk First Street
- Flood 4/10 Moderate FEMA zone X (unshaded) · 13% chance over 30 yrs
- Wildfire 1/10 Low
- Heat 9/10 Extreme 7 d/yr ≥106°F today · 16 d/yr by 30 yrs out
- Wind 8/10 Severe 80% chance of damaging wind over 30 yrs
- Air quality 5/10 Major 6 unhealthy d/yr today · 7 by 30 yrs out
Nearby sold comps map
Loading sold comps map…
Walkable amenities ~0.75 mi
Loading nearby amenities…
Taxation est. · year 1
- Rental income
- $16,664
- − Mortgage interest
- −$12,318
- − Property taxes
- −$2,029
- − Insurance
- −$1,100
- − Repairs & maintenance
- −$1,333
- − Management
- −$1,333
- − Depreciation
- −$6,397
- Taxable loss
- −$7,845
- Est. tax savings @ 24.0%
- +$1,883
- After-tax cash flow
- $-1,919/yr
For passive investors: Depreciation is non-cash, so a rental often shows a tax loss while cash-flowing — sheltering income. Rental losses are passive: they offset passive income freely, and up to $25,000/yr can offset ordinary (W-2) income if you actively participate and your MAGI is under $100k (phasing out to $0 by $150k); unused losses carry forward. On sale, claimed depreciation is recaptured at up to 25%, and gains may owe capital-gains tax (a 1031 exchange can defer both). Figures are a year-1 estimate at your 24.0% rate — not tax advice; consult a CPA.
Schools (NCES district)
- District
- Portsmouth City Public School District
- NCES district ID
- 5103000
- Math proficiency
- 34% ▼ -40.00%
- Reading proficiency
- 58% ▼ -12.00%
- Median HH income
- $46,152
- Composite
- 39.01/100
- National rank
- #4071
- State rank
- #107 of 131 in VA
Livability — Portsmouth
- Score
- 73/100
- State rank
- #172
- US rank
- #5381
Category grades
Schools grade is shown separately in the Schools card above.
Census & demographics
- Census place
- Portsmouth, VA
- County
- Portsmouth City · 96,366 people
- City population
- 96,366
- Metro
- Virginia Beach-Norfolk-Newport News, VA-NC
- Population (ZIP)
- 12,485
- Household income
- $48,835
- Rent vs Own
- Severe rent burden
- 534.0
Population outlook (Portsmouth County) Hauer SSP2
- Today (2025)
- 96,730 people
- By 2030
- 96,760 · +0.0%
- By 2040
- 96,573 · -0.2%
- By 2050
- 95,606 · -1.2%
- By 2075
- 93,579 · -3.3%
- By 2100
- 83,756 · -13.4%
Race, ethnicity, and origin ACS 2023
- Neighborhood character
- Diverse neighborhood (Simpson 0.62)
- Race & ethnicity
- Black 50% White 35% Two or more races 9% Hispanic / Latino 8%
- Hispanic origin (detail)
- Mexican 2% Puerto Rican 3%
- Common ancestry
- Lithuanian 1% Italian 1% Slovak 1%
- Foreign-born
- 4% · Canada, South Korea
- Languages at home
- 95% English-only · Spanish 4%
Political lean MEDSL · Portsmouth
- 2024 margin
- Solid D (+38.6) · D 68.6% · R 30.0% · Other 1.4%
- 2008→2024 swing
- -0.7pp no change · 2008: 39.3pp · 2024: 38.6pp
- All cycles
- 2024: D+38.6 2020: D+40.8 2016: D+36.5 2012: D+39.6 2008: D+39.3
Not yet ingested
- Civics
- —
Market trends
- HPI YoY
- ▲ 16.70%
- Current HPI
- 340.0817
- Rent YoY
- ▲ 3.97%
- Metro
- Virginia Beach-Norfolk-Newport News, VA-NC
- State GDP YoY
- ▲ 2.40%
- F500 in state
- 50
Industry mix (Fortune 500 HQ in VA)
| Industry | F500 HQs | Revenue |
|---|---|---|
| Aerospace / Defense | 4 | $236B |
|
||
| Technology / Defense | 3 | $32B |
|
||
| Financial Services | 2 | $176B |
|
||
| Utilities | 2 | $27B |
|
||
| Insurance | 2 | $25B |
|
||
| Technology | 2 | $15B |
|
||
Price history
+96.3% since first listed17 events — show timeline
- 2026-05-15 Contingent — REINMLS
- 2026-04-30 Relisted — REINMLS
- 2026-04-16 Contingent — REINMLS
- 2026-04-07 Listed $219,900 REINMLS
- 2026-03-31 Listing Removed — REINMLS
- 2026-02-28 Relisted — REINMLS
- 2026-01-25 Contingent — REINMLS
- 2025-10-21 Price Changed $219,900 REINMLS
- 2025-09-02 Listed $224,900 REINMLS
- 2025-08-29 Rental Removed $2,000 REINMLS
- 2025-07-25 Listed for Rent $2,000 REINMLS
- 2023-09-13 Sold (Public Records) $200,000 Public Records
- 2023-08-07 Pending — REINMLS
- 2023-07-31 Contingent — REINMLS
- 2023-07-25 Listed $195,000 REINMLS
- 2010-06-22 Sold (Public Records) $83,500 Public Records
- 2005-03-09 Sold (Public Records) $112,000 Public Records
Property tax history
+3.1%/yrLatest (2025): $2,029 · +2.5% YoY. Source: county tax records.
Cash-flow waterfall
monthlySold comps — $/sqft
last 12 mo · ≤1 miLoading sold comps…