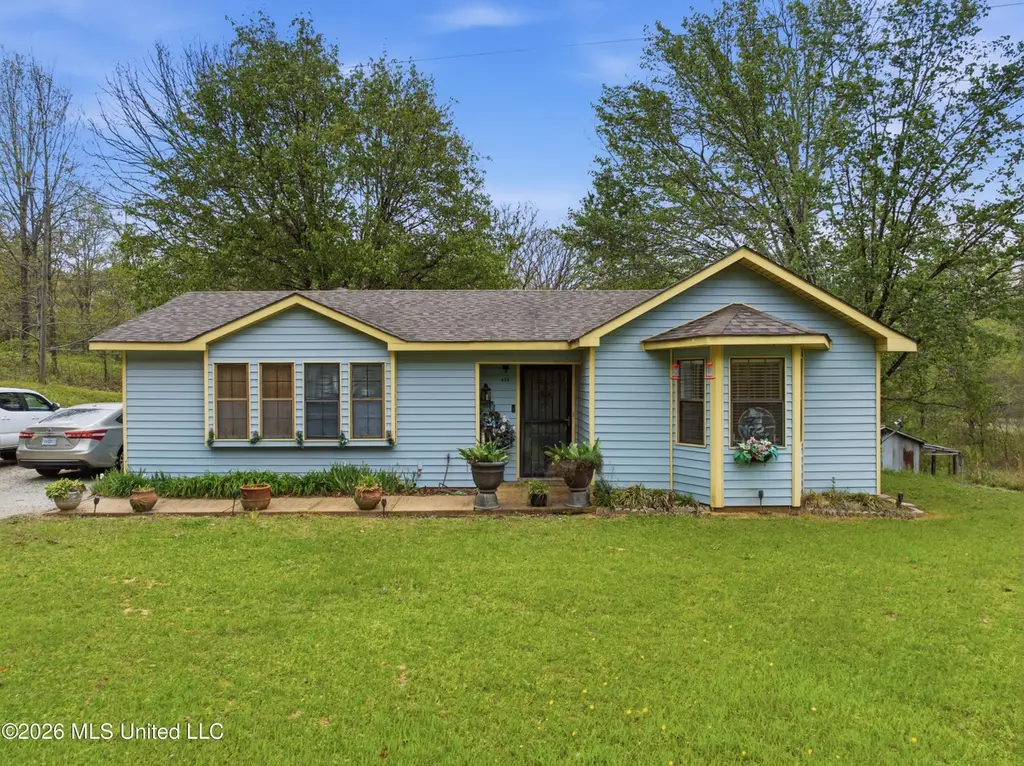
436 Flag Lake Rd · Strayhorn, MS
Flood risk 1/10 · Minimal
- FEMA flood zone
- X (unshaded)
- Chance of flooding over 30 yrs
- 0.0%
- Est. flood insurance / yr
- $507 – $1,088
Fire risk 5/10 · Moderate
- Est. fire insurance / yr
- $1,241 – $2,305
Heat risk 6/10 · Moderate
- Hot days now (above 109°F)
- 7 days/yr
- Hot days in 30 yrs
- 21 days/yr
Wind risk 4/10 · Minor
- Chance of severe wind over 30 yrs
- 19.0%
Air-quality risk 2/10 · Minimal
- Unhealthy air days now
- 0 days/yr
- Unhealthy air days in 30 yrs
- 2 days/yr
Risk factors via First Street. Map © Google.
Why this score? — see what drove the D grade
The composite is a weighted blend of 9 inputs, each scored 0–100. Each bar is that input's sub-score; the figure is the points it added to the 100-point composite (weight × sub-score).
- Cash flow +10.2/30.0
- Appreciation +8.7/10.0
- ARV discount +6.5/15.0
- DSCR +2.9/10.0
- Rent growth +2.5/5.0
- Livability +2.5/5.0
- Condition / age +2.5/5.0
- Schools +2.3/10.0
- 1% rule +1.8/10.0
$176,440
🖨 Deal sheet (PDF) 📄 Offer letter ✓ Due diligence
Listing remarks
Charming 3 Bedroom, 2 Bath Home with an Open Floor Plan on a Beautiful 1 Acre Lot in Sarah, MS ~ Covered Front Entry ~ Great Room ~ Breakfast/Dining Room ~ Kitchen with Eat-At Breakfast Bar ~ Primary Bedroom with Private Bath ~ 2 Additional Bedrooms & a Full Bath ~ Back Patio with Spacious Deck & Pergola ~ Small Storage Shed ~ 18x21 Detached Metal Garage/Storage Building ~ 1,800 sq ft Barn with Horse Stalls ~ Located in a 100% USDA Eligible Financing Area ~ Call for Your Private Showing Today!
Key facts
- 1 acre lot
- Built 1991
- Listed 4 days
Property features AI
Finance
- Other: Lot size approximately 1 acre (212 x 213); Zoned for single family residential; Horse amenities: barn, boarding facilities, hay storage, stables
Exterior
- Parking: Driveway (gravel)
- Security: Smoke detector(s); Carbon monoxide detector(s)
- Utilities: Well water; Septic tank; Electricity connected; Propane available; Cable available; Water connected; Sewer connected
- Home design: Single family residence; House; One story; Move-in ready
- Construction: Vinyl construction; Slab foundation; Architectural shingle roof; Built (year source: assessor)
- Exterior features: Deck; Patio; Private yard; Few trees; Front yard; Rectangular lot; Barn(s); Pergola; Shed(s); Stable(s); Additional storage
Interior
- Kitchen: Dishwasher; Free‑standing electric range; Microwave
- Bedrooms: Primary bedroom on main level; Additional bedrooms on main level
- Flooring: Laminate; Linoleum
- Bathrooms: 2 full bathrooms
- Heating & cooling: Central heating; Central air conditioning
- Interior features: Open floorplan; Breakfast bar; Ceiling fan(s); Eat-in kitchen; Laminate counters; Dead bolt locks; Hinged patio door; Metal insulated door; Security door; Storm door(s); Aluminum window frames; Bay window(s); Blinds; Window screens
- Laundry & utility: Washer/Dryer included; Electric dryer hookup; Laundry closet on main level; Water heater
Neighborhood map
What this means for you Summary
Snapshot
- This is a 3-bed/2.0-bath single-family listed at $176k.
Deal economics
- At list price, monthly cash flow is $-99 ($-1k/yr) — negative.
- To cash-flow at today's rent, offer at most $159k (9.9% below list).
- To meet the 1% rule (rent ≥ 1% of price), the offer needs to be $120k (32.0% below list).
- Recommended offer: $120k (32.0% below list) — sets the bar for 1% rule.
Location & tenants
- Location reads: area grade D — affects rentability + tenant quality, not the cash-flow math above.
- Tate County School District (rural): math 28% / reading 27% proficiency, ranked #74 of 130 in MS (top 57%) — low school quality limits family demand, transient renter base, plan for 1-2y turnover; 69% free/reduced lunch — lower-income household profile, screen leases tightly.
- Zoned schools: Strayhorn Elementary School (math 34% / reading 37%, grade F, #150 of 375 statewide, top 40%, 406 students, 99% FRL); Strayhorn High School (math 32% / reading 32%, grade F, #80 of 197 statewide, top 42%, 309 students, 99% FRL) — zoned schools average 99% FRL vs 69% district-wide (30 pts higher); higher-poverty schools than district average — tighter screening recommended.
- Market conditions: 22 active listings in the ZIP; 1 comparable units currently listed for rent nearby; 114 units permitted in Tate County in 2024 (0 in 5+ unit buildings).
Forward outlook
- In year one you build about $14k of equity ($1k loan paydown + $13k appreciation (7.4% local appreciation)).
- Tate County population projected at -14% by 2050 — secular population decline; favor cash flow + early exit over multi-decade hold.
- By year 3, paydown + projected appreciation supports a ~$36k cash-out refi (75% LTV) — recoverable capital for the next deal without selling this one.
Negotiation context
- Only 4 days on market — expect competitive offers; lowballing is unlikely to land.
- 2 sale attempts since 23y ago with the ask held roughly flat each time — persistent listings suggest the price (not the market) is what's stuck; bring a comps-based counter.
Risks & watch-outs
- Climate carrying-cost: moderate wildfire risk; extreme-heat days projected 7→21/yr by 2055 (HVAC capex compounding) — expect insurance premiums to compound above CPI over the hold.
Questions for the listing agent
- What do current leases actually rent for vs. the listed asking? Can we see a recent rent roll and the last 12 months of T-12 income?
- Is there a deadline driving the sale (1031 exchange, divorce, estate, relocation)? That informs how much negotiation room exists.
- The area grade is low — what's the realistic commute time and amenity access for the typical tenant pool here? Any planned neighborhood developments (good or bad) we should know about?
- What's the average days-on-market for RENTAL listings here right now (not sales)? A rising rental-DOM trend means longer vacancies and softer asking-rent achievability than the comps imply.
- What's the recent tenant-quality profile in this submarket — average credit score on applications, eviction rate, late-payment / NSF rate, and stable-employment percentage? A property-management company in the area should have these aggregated.
- How much new for-sale + rental construction is in the pipeline within 1–3 miles? Heavy new supply typically softens prices + rents 12–24 months out; constrained supply supports both.
Investment metrics
- 1% rule
- 0.68% ✗
- Cap rate
- 5.62%
- Cash-on-cash
- -2.41%
- DSCR
- 0.89
- GRM
- 12.3
CMA / ARV
- ARV (on-the-fly)
- $172,755
- Comps found
- 1
Show comp detail 1 sale within ~0.75 mi
| Address | Dist | Beds/Ba | Sqft | Sold | Price | $/sf | Match |
|---|---|---|---|---|---|---|---|
| 436 Flag Lake Rd | 0.00mi | 3/2.0 | 1,070 (+2%) | 1mo | $176,440 | $165 | 95 |
Match score weights: distance 35% · size 25% · config 20% · recency 20%. Top-matched comps best support the ARV.
Projected returns pro-forma
7.43% appreciation · 3.0% rent growth · sell at horizon
- IRR
- 16.8%
- Equity multiple
- 2.21×
- Total profit
- $59,892
- Equity at exit
- $127,252
- IRR
- 16.2%
- Equity multiple
- 4.61×
- Total profit
- $178,290
- Equity at exit
- $246,374
Cash invested: $49,403 (down + closing). Projections, not guarantees.
Landlord ↔ Tenant lean methodology
- Overall (STATE)
- 90 Strongly Landlord-Friendly
- State Mississippi
- 90 Strongly Landlord-Friendly · R+11
- County
- — inherits STATE
- City
- — inherits STATE
ZIP-level market 38665
- Home prices YoY
- 3.1%
- Active inventory
- 22
- Price-to-rent
- 12.3×
Monthly cashflow live
- Estimated rent
- $1,200 medium interval (Pro) →
- Mortgage (P&I)
- −$925
- Tax from tax record
- −$48 /mo · $581/yr
- Insurance
- −$74
- HOA
- −$0
- Vacancy / Maint / Mgmt
- −$252
- Net cashflow
- $-99
Break-even live
Sensitivity live
| Price | -10% $1 | -5% $-49 | +0% $-99 | +5% $-149 | +10% $-199 |
|---|---|---|---|---|---|
| Rent | -10% $-194 | -5% $-147 | +0% $-99 | +5% $-52 | +10% $-4 |
| Rate | -1.0pp $-10 | -0.5pp $-54 | base $-99 | +0.5pp $-145 | +1.0pp $-191 |
UW: 25.0% down · 7.5% · 30yr · 1.5% tax · 5.0% vac · 8.0% maint · 8.0% mgmt
Financing live
Cash to close
- Down payment
- $44,110
- Closing costs
- $5,293
- Reserves months
- —
- Total cash needed
- —
Loan-product check · same deal, 3 products live
Conventional
25% down · 7.5% · 30yr
- Down + closing
- —
- Monthly P&I
- —
- Monthly cashflow
- —
- DSCR
- —
- Eligible?
- —
Personal DTI + credit; lowest rate.
DSCR
20% down · 8.5% · 30yr
- Down + closing
- —
- Monthly P&I
- —
- Monthly cashflow
- —
- DSCR
- —
- Eligible?
- —
No personal income docs; deal must DSCR.
Hard money
10% down · 12.0% · 12mo
- Down + closing
- —
- Monthly P&I
- —
- Monthly cashflow
- —
- DSCR
- —
- Eligible?
- —
Short-term bridge; refi at stabilization.
Rent comps 1 comps
| Address | Beds | Baths | Sqft | Rent | $/sqft | DOM | Units | Dist |
|---|---|---|---|---|---|---|---|---|
| 965 Flag Lake Rd Sarah, MS | 3.0 | 2.0 | 1456 | $1,200 | $0.82 | 3d | 1 | 0.45mi |
Listing history 5 events
-
2026-04-14status Pending
-
2026-04-10$176,440 Active
-
2021-10-11historical
-
2003-01-02$91,340
-
2000-05-10soldstatus
ⓘ Source: listings_history table (triggers on properties + properties_extension) + one-shot
backfill from property_details.listing_events for pre-trigger history.
Tax reassessment forecast MS · Resets to sale price
- Current annual tax
- $581 · $48/mo
- Projected year-2 tax
- $1,394 · $116/mo
- Expected delta
- +$813/yr (+$68/mo · 140.1%)
ⓘ Screening estimate from a state-policy table — verify with the county assessor before closing.
Climate risk First Street
- Flood 1/10 Low FEMA zone X (unshaded) · 0% chance over 30 yrs
- Wildfire 5/10 Major
- Heat 6/10 Major 7 d/yr ≥109°F today · 21 d/yr by 30 yrs out
- Wind 4/10 Moderate 19% chance of damaging wind over 30 yrs
- Air quality 2/10 Low 0 unhealthy d/yr today · 2 by 30 yrs out
Nearby sold comps map
Loading sold comps map…
Walkable amenities ~0.75 mi
Loading nearby amenities…
Taxation est. · year 1
- Rental income
- $14,400
- − Mortgage interest
- −$9,883
- − Property taxes
- −$581
- − Insurance
- −$882
- − Repairs & maintenance
- −$1,152
- − Management
- −$1,152
- − Depreciation
- −$5,133
- Taxable loss
- −$4,383
- Est. tax savings @ 24.0%
- +$1,052
- After-tax cash flow
- $-138/yr
For passive investors: Depreciation is non-cash, so a rental often shows a tax loss while cash-flowing — sheltering income. Rental losses are passive: they offset passive income freely, and up to $25,000/yr can offset ordinary (W-2) income if you actively participate and your MAGI is under $100k (phasing out to $0 by $150k); unused losses carry forward. On sale, claimed depreciation is recaptured at up to 25%, and gains may owe capital-gains tax (a 1031 exchange can defer both). Figures are a year-1 estimate at your 24.0% rate — not tax advice; consult a CPA.
Schools (NCES district)
- District
- Tate County School District
- NCES district ID
- 2804230
- Math proficiency
- 28% ▼ -11.00%
- Reading proficiency
- 27% ▼ -6.00%
- Median HH income
- $41,975
- Composite
- 23.38/100
- National rank
- #7903
- State rank
- #74 of 130 in MS
Livability — Strayhorn
No livability data for this city. (Only ~50 U.S. cities are tracked.)
Census & demographics
- Census place
- Strayhorn, MS
- Population (ZIP)
- 3,817
Population outlook (Tate County) Hauer SSP2
- Today (2025)
- 27,577 people
- By 2030
- 26,872 · -2.6%
- By 2040
- 25,319 · -8.2%
- By 2050
- 23,590 · -14.5%
- By 2075
- 19,500 · -29.3%
- By 2100
- 15,468 · -43.9%
Race, ethnicity, and origin ACS 2023
- Neighborhood character
- Predominantly White (95%)
- Race & ethnicity
- White 95% Black 3% Hispanic / Latino 2%
- Common ancestry
- Slovak 1%
- Foreign-born
- 2% · Canada
- Languages at home
- 98% English-only · Spanish 2%
Political lean MEDSL · Tate
- 2024 margin
- Solid R (+43.8) · D 27.6% · R 71.4%
- 2008→2024 swing
- -22.8pp toward R · 2008: -20.9pp · 2024: -43.8pp
- All cycles
- 2024: R+43.8 2020: R+34.5 2016: R+31.4 2012: R+18.4 2008: R+20.9
Not yet ingested
- Civics
- —
Market trends
- HPI YoY
- ▲ 7.43%
- Current HPI
- 246.5952
- Rent YoY
- —
- Metro
- —
- State GDP YoY
- —
- F500 in state
- 0
Price history
+93.2% since first listed5 events — show timeline
- 2026-04-14 Pending — MLSU
- 2026-04-10 Listed $176,440 MLSU
- 2021-10-11 Listing Removed — MLSU
- 2003-01-02 Listed $91,340 MLSU
- 2000-05-10 Sold (Public Records) — Public Records
Property tax history
-0.7%/yrLatest (2025): $581 · +7.6% YoY. Source: county tax records.
Cash-flow waterfall
monthlySold comps — $/sqft
last 12 mo · ≤1 miLoading sold comps…