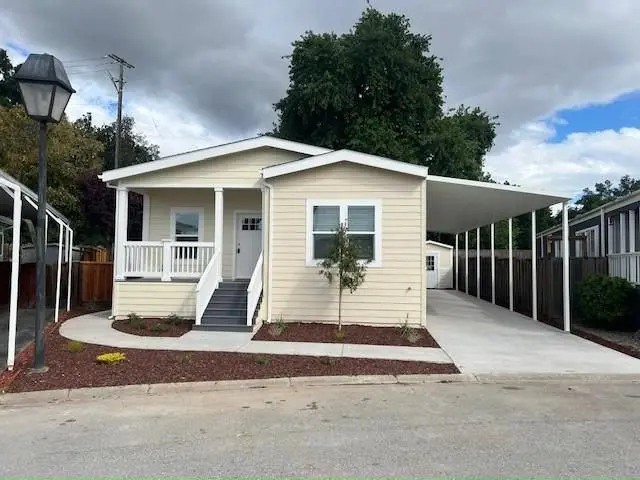
6130 Monterey Hwy, #052 Plan · San Jose, CA
Flood risk 3/10 · Minor
- FEMA flood zone
- D
- Chance of flooding over 30 yrs
- 0.18%
- Est. flood insurance / yr
- $544 – $1,084
Fire risk 7/10 · Major
- Est. fire insurance / yr
- $659 – $1,223
Heat risk 5/10 · Moderate
- Hot days now (above 96°F)
- 7 days/yr
- Hot days in 30 yrs
- 15 days/yr
Wind risk 1/10 · Minimal
- Chance of severe wind over 30 yrs
- —
Air-quality risk 8/10 · Major
- Unhealthy air days now
- 15 days/yr
- Unhealthy air days in 30 yrs
- 16 days/yr
Risk factors via First Street. Map © Google.
Why this score? — see what drove the D- grade
The composite is a weighted blend of 9 inputs, each scored 0–100. Each bar is that input's sub-score; the figure is the points it added to the 100-point composite (weight × sub-score).
- Cash flow +13.2/30.0
- Schools +4.9/10.0
- Condition / age +4.8/5.0
- DSCR +4.0/10.0
- Livability +3.9/5.0
- 1% rule +3.7/10.0
- Rent growth +2.5/5.0
- ARV discount +0.0/15.0
- Appreciation +0.0/10.0
$485,995
🖨 Deal sheet (PDF) 📄 Offer letter ✓ Due diligence
Listing remarks
Beautiful brand-new Skyline Stone Harbor Series, 3BD 2BA, 1560 sq. ft. home on a larger perimeter lot, with a spacious yard fenced in for privacy. It has an extended concrete driveway and awning, a spacious kitchen with tall cabinets, tile backsplash, granite counter tops, with stainless steel appliances, central heat and AC, lots of windows, crown molding, light and bright. Don't miss your opportunity, call today for a private showing!
Key facts
- Spacious yard
- Tall cabinets
- Granite counter tops
Tags
Property features AI
Finance
- Other: Listing status: Active
- Financial info: Listing price $485,995
Exterior
- Home design: Plan home (new construction plan: 6130 Monterey Hwy, #052); Single-level (plan)
- Construction: 1560 living area
- Exterior features: Located on Monterey Highway in San Jose
Interior
- Bedrooms: 3 bedrooms
- Bathrooms: 2 full bathrooms
- Interior features: Open living area
Neighborhood map
What this means for you Summary
Snapshot
- This is a 3-bed/2.0-bath manufactured listed at $486k. Condition is rated excellent.
Deal economics
- At list price, monthly cash flow is $-11 ($-130/yr) — negative.
- To cash-flow at today's rent, offer at most $484k (0.3% below list).
- To meet the 1% rule (rent ≥ 1% of price), the offer needs to be $424k (12.8% below list).
- Recommended offer: $424k (12.8% below list) — sets the bar for 1% rule.
- Cap rate 6.3% vs local median 1.6% in San Jose — top-decile yield for the area; either an underpriced asset or a hidden risk that comps aren't pricing in. Stress-test before assuming the spread holds.
Location & tenants
- Location reads 78/100 on livability (#68 in CA, #2,559 nationally) — a middle-class / working-renter tenant base. Strengths: amenities A+, commute A+, employment A+; Watch: crime F, cost of living F.
- Oak Grove Elementary (urban): math 47% / reading 54% proficiency, ranked #339 of 1,400 in CA (top 24%) — acceptable for families but not a draw, mixed tenant base, ~2y average lease.
- Zoned schools: Ledesma (Rita) Elementary (463 students, 30% FRL); Bernal Intermediate (636 students, 29% FRL); Evergreen Valley High (math 76% / reading 83%, grade A-, #45 of 1,170 statewide, top 4%, 2,767 students, 13% FRL).
- Zoned-school proficiency averages 80% at this address vs 50% district-wide (+29 pts) — the actual schools serving this property are materially stronger than the Oak Grove Elementary average implies; a family-tenant draw the district grade alone would hide.
- Market conditions: 29 active listings in the ZIP; 10 comparable units currently listed for rent nearby; rentals leasing fast (median 5d on market — plan ~1-2 weeks tenant-placement turnaround); high-income renter base; 3,838 units permitted in Santa Clara County in 2024 (1,886 in 5+ unit buildings).
Forward outlook
- Local home prices are declining (-3.0%/yr); year-one equity from $3k of loan paydown is wiped out by about $15k of value loss. Plan a longer hold.
- Santa Clara County population projected at +24% by 2050 — long-run rental-demand tailwind backs the buy-and-hold thesis.
Negotiation context
- It's been on market 20 days — a 2% lower offer ($479k) is reasonable based on typical stale-listing flexibility.
Risks & watch-outs
- Climate carrying-cost: major wildfire risk; extreme-heat days projected 7→15/yr by 2055 (HVAC capex compounding) — expect insurance premiums to compound above CPI over the hold.
Questions for the listing agent
- What do current leases actually rent for vs. the listed asking? Can we see a recent rent roll and the last 12 months of T-12 income?
- Is there a deadline driving the sale (1031 exchange, divorce, estate, relocation)? That informs how much negotiation room exists.
- Crime grade is F in this area — have there been break-ins, vandalism, or insurance claims at this property in the last 3 years? What carrier currently insures it and at what premium?
- The area grade is low — what's the realistic commute time and amenity access for the typical tenant pool here? Any planned neighborhood developments (good or bad) we should know about?
- What's the average days-on-market for RENTAL listings here right now (not sales)? A rising rental-DOM trend means longer vacancies and softer asking-rent achievability than the comps imply.
- What's the recent tenant-quality profile in this submarket — average credit score on applications, eviction rate, late-payment / NSF rate, and stable-employment percentage? A property-management company in the area should have these aggregated.
- How much new for-sale + rental construction is in the pipeline within 1–3 miles? Heavy new supply typically softens prices + rents 12–24 months out; constrained supply supports both.
Investment metrics
- 1% rule
- 0.87% ✗
- Cap rate
- 6.27%
- Cash-on-cash
- -0.10%
- DSCR
- 1.00
- GRM
- 9.6
CMA / ARV
- ARV (on-the-fly)
- $379,080
- Comps found
- 12
Show comp detail 12 sales within ~0.75 mi
| Address | Dist | Beds/Ba | Sqft | Sold | Price | $/sf | Match |
|---|---|---|---|---|---|---|---|
| 6130 Monterey Rd #99 | 0.10mi | 3/2.0 | 1,560 (0%) | 5mo | $378,000 | $242 | 91 |
| 6130 Monterey Rd #316 | 0.01mi | 3/2.0 | 1,600 (+3%) | 7mo | $345,000 | $216 | 89 |
| 6130 Monterey Rd #46 | 0.01mi | 3/2.0 | 1,560 (0%) | 21mo | $382,000 | $245 | 82 |
| 6130 Monterey Hwy #266 | 0.01mi | 3/2.0 | 1,534 (-2%) | 18mo | $400,000 | $261 | 82 |
| 6130 Monterey Hwy #217 | 0.01mi | 3/2.0 | 1,503 (-4%) | 16mo | $403,500 | $268 | 80 |
| 6130 Monterey Rd #215 | 0.01mi | 3/2.0 | 1,582 (+1%) | 20mo | $390,000 | $247 | 80 |
| 6130 Monterey Hwy #94 | 0.01mi | 3/2.0 | 1,650 (+6%) | 21mo | $292,000 | $177 | 72 |
| 6130 Monterey Rd #174 | 0.01mi | 3/2.0 | 1,440 (-8%) | 19mo | $330,000 | $229 | 70 |
| 6130 Monterey Rd #260 | 0.01mi | 3/2.0 | 1,344 (-14%) | 8mo | $405,000 | $301 | 70 |
| 6130 Monterey Rd #87 | 0.01mi | 3/2.0 | 1,782 (+14%) | 16mo | $373,500 | $210 | 62 |
| 6130 Monterey Rd #25 | 0.01mi | 2/2.0 (-1) | 1,368 (-12%) | 14mo | $290,000 | $212 | 62 |
| 6130 Monterey Rd #237 | 0.19mi | 3/2.0 | 1,440 (-8%) | 22mo | $350,000 | $243 | 60 |
Match score weights: distance 35% · size 25% · config 20% · recency 20%. Top-matched comps best support the ARV.
Projected returns pro-forma
-3.0% appreciation · 3.0% rent growth · sell at horizon
- IRR
- -16.5%
- Equity multiple
- 0.42×
- Total profit
- $-79,379
- Equity at exit
- $72,463
- IRR
- -8.2%
- Equity multiple
- 0.49×
- Total profit
- $-69,751
- Equity at exit
- $42,020
Cash invested: $136,079 (down + closing). Projections, not guarantees.
Landlord ↔ Tenant lean methodology
- Overall (CITY)
- 0 Strongly Tenant-Friendly
- State California
- 18 Strongly Tenant-Friendly · D+13
- County
- — inherits STATE
- City San Jose
- 0 Strongly Tenant-Friendly · D+24
ZIP-level market 95138
- Home prices YoY
- -6.5%
- Active inventory
- 29
- Price-to-rent
- 9.6×
Monthly cashflow live
- Estimated rent
- $4,238 high interval (Pro) →
- Mortgage (P&I)
- −$2,549
- Tax est. 1.5%
- −$607 /mo · $7,290/yr
- Insurance
- −$202
- HOA
- −$0
- Vacancy / Maint / Mgmt
- −$890
- Net cashflow
- $-11
Break-even live
Sensitivity live
| Price | -10% $325 | -5% $157 | +0% $-11 | +5% $-179 | +10% $-347 |
|---|---|---|---|---|---|
| Rent | -10% $-346 | -5% $-178 | +0% $-11 | +5% $157 | +10% $324 |
| Rate | -1.0pp $234 | -0.5pp $113 | base $-11 | +0.5pp $-137 | +1.0pp $-265 |
UW: 25.0% down · 7.5% · 30yr · 1.5% tax · 5.0% vac · 8.0% maint · 8.0% mgmt
Financing live
Cash to close
- Down payment
- $121,499
- Closing costs
- $14,580
- Reserves months
- —
- Total cash needed
- —
Loan-product check · same deal, 3 products live
Conventional
25% down · 7.5% · 30yr
- Down + closing
- —
- Monthly P&I
- —
- Monthly cashflow
- —
- DSCR
- —
- Eligible?
- —
Personal DTI + credit; lowest rate.
DSCR
20% down · 8.5% · 30yr
- Down + closing
- —
- Monthly P&I
- —
- Monthly cashflow
- —
- DSCR
- —
- Eligible?
- —
No personal income docs; deal must DSCR.
Hard money
10% down · 12.0% · 12mo
- Down + closing
- —
- Monthly P&I
- —
- Monthly cashflow
- —
- DSCR
- —
- Eligible?
- —
Short-term bridge; refi at stabilization.
Rent comps 10 comps
| Address | Beds | Baths | Sqft | Rent | $/sqft | DOM | Units | Dist |
|---|---|---|---|---|---|---|---|---|
| 6100 Monterey Rd San Jose, CA | 1.0–3.0 | 1.0–3.0 | 950 | $4,464 | $4.70 | 0d | 9 | 0.16mi |
| 7011 Rodling Dr Unit E San Jose, CA | 2.0 | 2.5 | 1093 | $3,400 | $3.11 | 45d | 1 | 0.25mi |
| 1075 Esparanza Way San Jose, CA | 3.0 | 3.0 | 1439 | $4,300 | $2.99 | 5d | 1 | 0.50mi |
| 7060 Cypress Point Ct San Jose, CA | 3.0 | 3.0 | 1850 | $4,000 | $2.16 | 5d | 1 | 0.87mi |
| 206 Martinvale Ln San Jose, CA | 3.0 | 2.0 | 1300 | $4,300 | $3.31 | 0d | 1 | 0.88mi |
| 6818 Chroma Ct San Jose, CA | 3.0 | 3.0 | 1563 | $4,295 | $2.75 | 12d | 1 | 1.05mi |
| 6670 Emergent Way San Jose, CA | 1.0–3.0 | 1.0–2.0 | 1024 | $4,953 | $4.83 | 0d | 4 | 1.12mi |
| 6568 Vision Ct San Jose, CA | 2.0 | 2.0 | 1096 | $4,200 | $3.83 | 0d | 1 | 1.15mi |
| 6809 Canine Ct San Jose, CA | 3.0 | 3.0 | 1822 | $4,375 | $2.40 | 0d | 1 | 1.17mi |
| 303 Martinvale Ln San Jose, CA | 4.0 | 2.0 | 1350 | $4,600 | $3.41 | 21d | 1 | 1.32mi |
Listing history 14 events
-
2026-06-21days on market $485,995 Active 20 DOM
-
2026-06-18days on market $485,995 Active 17 DOM
-
2026-06-17days on market $485,995 Active 16 DOM
-
2026-06-16days on market $485,995 Active 15 DOM
-
2026-06-15days on market $485,995 Active 14 DOM
-
2026-06-13days on market $485,995 Active 12 DOM
-
2026-06-13days on market $485,995 Active 11 DOM
-
2026-06-09days on market $485,995 Active 8 DOM
-
2026-06-08days on market $485,995 Active 7 DOM
-
2026-06-07days on market $485,995 Active 6 DOM
-
2026-06-05days on market $485,995 Active 3 DOM
-
2026-06-03days on market $485,995 Active 2 DOM
-
2026-06-02remarks 440-char remark
-
2026-06-02$485,995 Active 1 DOM
ⓘ Source: listings_history table (triggers on properties + properties_extension) + one-shot
backfill from property_details.listing_events for pre-trigger history.
Climate risk First Street
- Flood 3/10 Moderate FEMA zone D · 18% chance over 30 yrs
- Wildfire 7/10 Severe
- Heat 5/10 Major 7 d/yr ≥96°F today · 15 d/yr by 30 yrs out
- Wind 1/10 Low
- Air quality 8/10 Severe 15 unhealthy d/yr today · 16 by 30 yrs out
Nearby sold comps map
Loading sold comps map…
Walkable amenities ~0.75 mi
Loading nearby amenities…
Taxation est. · year 1
- Rental income
- $50,852
- − Mortgage interest
- −$27,223
- − Property taxes
- −$7,290
- − Insurance
- −$2,430
- − Repairs & maintenance
- −$4,068
- − Management
- −$4,068
- − Depreciation
- −$14,138
- Taxable loss
- −$8,365
- Est. tax savings @ 24.0%
- +$2,008
- After-tax cash flow
- $1,878/yr
For passive investors: Depreciation is non-cash, so a rental often shows a tax loss while cash-flowing — sheltering income. Rental losses are passive: they offset passive income freely, and up to $25,000/yr can offset ordinary (W-2) income if you actively participate and your MAGI is under $100k (phasing out to $0 by $150k); unused losses carry forward. On sale, claimed depreciation is recaptured at up to 25%, and gains may owe capital-gains tax (a 1031 exchange can defer both). Figures are a year-1 estimate at your 24.0% rate — not tax advice; consult a CPA.
Condition & rehab AI · 3 photos
This Skyline Stone Harbor Series manufactured home is in excellent condition with a spacious kitchen, hardwood flooring, and a well-maintained exterior. It is move-in ready and would benefit from minor aesthetic improvements to further enhance its value.
Value-add opportunities
- Both Painting the exterior and interior walls — Enhances curb appeal and interior aesthetics.
- Both Landscaping improvements — Enhances curb appeal and adds value to the property.
Renovation cost estimate screening
Value-add ROI direction
- Both Painting the exterior and interior walls — Enhances curb appeal and interior aesthetics. ↑
- Both Landscaping improvements — Enhances curb appeal and adds value to the property. ↑
ⓘ Cost ranges are severity-bucket heuristics (US national rule-of-thumb). Get contractor quotes + a written scope before underwriting a rehab budget.
Schools (NCES district)
- District
- Oak Grove Elementary
- NCES district ID
- 0627810
- Math proficiency
- 47% ▲ 1.00%
- Reading proficiency
- 54% ▬ 0.00%
- Median HH income
- $92,404
- Composite
- 49.23/100
- National rank
- #4382
- State rank
- #339 of 1400 in CA
Livability — San Jose
- Score
- 78/100
- State rank
- #68
- US rank
- #2559
Category grades
Schools grade is shown separately in the Schools card above.
Census & demographics
- Census place
- San Jose, CA
- County
- Santa Clara County · 1,806,974 people
- City population
- 954,479
- Metro
- San Jose-Sunnyvale-Santa Clara, CA
- Population (ZIP)
- 18,960
- Household income
- $204,476
- Rent vs Own
- Severe rent burden
- 254.0
Population outlook (Santa Clara County) Hauer SSP2
- Today (2025)
- 2,179,074 people
- By 2030
- 2,301,297 · +5.6%
- By 2040
- 2,528,195 · +16.0%
- By 2050
- 2,712,135 · +24.5%
- By 2075
- 2,998,701 · +37.6%
- By 2100
- 2,931,429 · +34.5%
Race, ethnicity, and origin ACS 2023
- Neighborhood character
- Diverse neighborhood (Simpson 0.66)
- Race & ethnicity
- Asian 49% Hispanic / Latino 25% Two or more races 17% White 17% Black 4%
- Hispanic origin (detail)
- Mexican 21%
- Common ancestry
- Russian 1% Lithuanian 1% Italian 1%
- Foreign-born
- 40% · Vietnam, Canada, China
- Languages at home
- 40% English-only · Spanish 16% Vietnamese 13% Other Indo-European 10%
Political lean MEDSL · Santa Clara
- 2024 margin
- Solid D (+40.0) · D 68.1% · R 28.1% · Other 3.8%
- 2008→2024 swing
- -0.9pp no change · 2008: 40.9pp · 2024: 40.0pp
- All cycles
- 2024: D+40.0 2020: D+47.4 2016: D+52.5 2012: D+42.1 2008: D+40.9
Not yet ingested
- Civics
- —
Market trends
- HPI YoY
- ▼ -120.53%
- Current HPI
- 1737.74
- Rent YoY
- —
- Metro
- San Jose-Sunnyvale-Santa Clara, CA
- State GDP YoY
- ▲ 3.21%
- F500 in state
- 116
Industry mix (Fortune 500 HQ in CA)
| Industry | F500 HQs | Revenue |
|---|---|---|
| Technology | 27 | $1,492B |
|
||
| Financial Services | 3 | $174B |
|
||
| Retail | 3 | $44B |
|
||
| Insurance | 3 | $26B |
|
||
| Media / Entertainment | 2 | $115B |
|
||
| Pharmaceuticals / Biotech | 2 | $62B |
|
||
Cash-flow waterfall
monthlySold comps — $/sqft
last 12 mo · ≤1 miLoading sold comps…