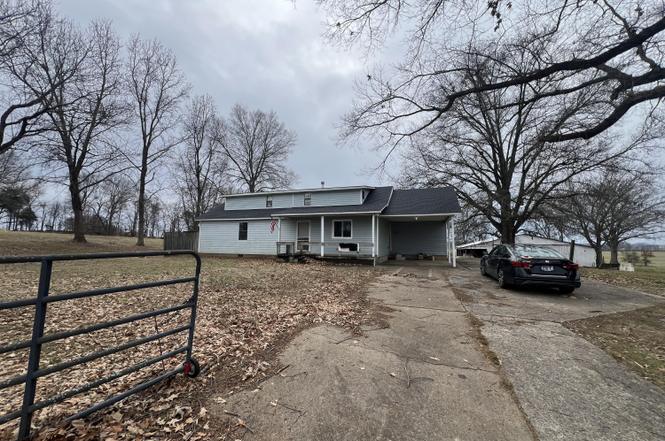
1527 Ashley Rd · Fowlkes, TN
Flood risk 1/10 · Minimal
- FEMA flood zone
- X (unshaded)
- Chance of flooding over 30 yrs
- 0.0%
- Est. flood insurance / yr
- $473 – $860
Fire risk 1/10 · Minimal
- Est. fire insurance / yr
- $949 – $1,763
Heat risk 6/10 · Moderate
- Hot days now (above 108°F)
- 7 days/yr
- Hot days in 30 yrs
- 20 days/yr
Wind risk 4/10 · Minor
- Chance of severe wind over 30 yrs
- 14.0%
Air-quality risk 1/10 · Minimal
- Unhealthy air days now
- 0 days/yr
- Unhealthy air days in 30 yrs
- 0 days/yr
Risk factors via First Street. Map © Google.
Why this score? — see what drove the D grade
The composite is a weighted blend of 9 inputs, each scored 0–100. Each bar is that input's sub-score; the figure is the points it added to the 100-point composite (weight × sub-score).
- Cash flow +15.5/30.0
- ARV discount +7.5/15.0
- DSCR +4.8/10.0
- 1% rule +3.4/10.0
- Schools +3.3/10.0
- Rent growth +2.5/5.0
- Livability +2.5/5.0
- Condition / age +2.5/5.0
- Appreciation +0.0/10.0
$159,000
🖨 Deal sheet (PDF) 📄 Offer letter ✓ Due diligence
Listing remarks
Escape to peaceful rural living just minutes from Dyersburg, yet conveniently located in the county for that true countryside feel. This 4-bedroom, 2-bathroom home sits on expansive 5.7 acres, offering privacy and room to roam behind a gated entry with a paved driveway. The home features a spacious layout with an unfinished basement ready for your custom finishing touches - perfect for additional living space, storage, or a workshop. Enjoy peace of mind with a roof that's only about 2 years old. Highlighting the property is a 64x64 barn, ideal for equipment storage, livestock, hobbies, or even converting into a multipurpose space. This gem is a fantastic starter home brimming with so much p
Key facts
- Unfinished basement
- Paved driveway
- Expansive acres
Tags
Neighborhood map
What this means for you Summary
Snapshot
- This is a 4-bed/2.0-bath single-family listed at $159k.
Deal economics
- At list price, monthly cash flow is $65 ($781/yr) — positive.
- The deal already cash-flows at list — no discount required.
- To meet the 1% rule (rent ≥ 1% of price), the offer needs to be $134k (15.9% below list).
- Recommended offer: $134k (15.9% below list) — sets the bar for 1% rule.
Location & tenants
- Location reads: area grade D — affects rentability + tenant quality, not the cash-flow math above.
- Dyer County (rural): math 40% / reading 38% proficiency, ranked #16 of 139 in TN (top 12%) — families likely to look elsewhere, expect single-tenant / working-renter base with shorter leases.
- Zoned schools: Holice Powell Elementary (math 52% / reading 32%, grade F, #191 of 952 statewide, top 22%, 261 students, 0% FRL); Three Oaks Middle School (math 33% / reading 35%, grade F, #70 of 333 statewide, top 21%, 405 students, 0% FRL); Dyer County High School (math 21% / reading 48%, grade F, #41 of 332 statewide, top 15%, 1,070 students, 0% FRL) — zoned schools average 0% FRL vs 54% district-wide (54 pts lower); this property's tenant base skews higher-income than the district average.
- Market conditions: 66 active listings in the ZIP; 74 units permitted in Dyer County in 2024 (6 in 5+ unit buildings).
Forward outlook
- Local home prices are declining (-3.0%/yr); year-one equity from $1k of loan paydown is wiped out by about $5k of value loss. Plan a longer hold.
- Dyer County population projected at -13% by 2050 — secular population decline; favor cash flow + early exit over multi-decade hold.
Negotiation context
- Only 10 days on market — expect competitive offers; lowballing is unlikely to land.
- 2 sale attempts with the ask held roughly flat each time — persistent listings suggest the price (not the market) is what's stuck; bring a comps-based counter.
Risks & watch-outs
- Climate carrying-cost: extreme-heat days projected 7→20/yr by 2055 (HVAC capex compounding) — expect insurance premiums to compound above CPI over the hold.
Questions for the listing agent
- Is there a deadline driving the sale (1031 exchange, divorce, estate, relocation)? That informs how much negotiation room exists.
- The area grade is low — what's the realistic commute time and amenity access for the typical tenant pool here? Any planned neighborhood developments (good or bad) we should know about?
- What's the average days-on-market for RENTAL listings here right now (not sales)? A rising rental-DOM trend means longer vacancies and softer asking-rent achievability than the comps imply.
- What's the recent tenant-quality profile in this submarket — average credit score on applications, eviction rate, late-payment / NSF rate, and stable-employment percentage? A property-management company in the area should have these aggregated.
- How much new for-sale + rental construction is in the pipeline within 1–3 miles? Heavy new supply typically softens prices + rents 12–24 months out; constrained supply supports both.
Investment metrics
- 1% rule
- 0.84% ✗
- Cap rate
- 6.78%
- Cash-on-cash
- 1.75%
- DSCR
- 1.08
- GRM
- 9.9
CMA / ARV
No comps found within radius.
Projected returns pro-forma
-3.0% appreciation · 3.0% rent growth · sell at horizon
- IRR
- -13.5%
- Equity multiple
- 0.51×
- Total profit
- $-21,667
- Equity at exit
- $23,707
- IRR
- -4.7%
- Equity multiple
- 0.69×
- Total profit
- $-13,719
- Equity at exit
- $13,747
Cash invested: $44,520 (down + closing). Projections, not guarantees.
Landlord ↔ Tenant lean methodology
- Overall (STATE)
- 87 Strongly Landlord-Friendly
- State Tennessee
- 87 Strongly Landlord-Friendly · R+13
- County
- — inherits STATE
- City
- — inherits STATE
ZIP-level market 38024
- Home prices YoY
- -28.5%
- Active inventory
- 66
- Price-to-rent
- 9.9×
Monthly cashflow live
- Estimated rent
- $1,337 medium interval (Pro) →
- Mortgage (P&I)
- −$834
- Tax from tax record
- −$91 /mo · $1,092/yr
- Insurance
- −$66
- HOA
- −$0
- Vacancy / Maint / Mgmt
- −$281
- Net cashflow
- $65
Break-even live
Sensitivity live
| Price | -10% $155 | -5% $110 | +0% $65 | +5% $20 | +10% $-25 |
|---|---|---|---|---|---|
| Rent | -10% $-41 | -5% $12 | +0% $65 | +5% $118 | +10% $171 |
| Rate | -1.0pp $145 | -0.5pp $105 | base $65 | +0.5pp $24 | +1.0pp $-18 |
UW: 25.0% down · 7.5% · 30yr · 1.5% tax · 5.0% vac · 8.0% maint · 8.0% mgmt
Financing live
Cash to close
- Down payment
- $39,750
- Closing costs
- $4,770
- Reserves months
- —
- Total cash needed
- —
Loan-product check · same deal, 3 products live
Conventional
25% down · 7.5% · 30yr
- Down + closing
- —
- Monthly P&I
- —
- Monthly cashflow
- —
- DSCR
- —
- Eligible?
- —
Personal DTI + credit; lowest rate.
DSCR
20% down · 8.5% · 30yr
- Down + closing
- —
- Monthly P&I
- —
- Monthly cashflow
- —
- DSCR
- —
- Eligible?
- —
No personal income docs; deal must DSCR.
Hard money
10% down · 12.0% · 12mo
- Down + closing
- —
- Monthly P&I
- —
- Monthly cashflow
- —
- DSCR
- —
- Eligible?
- —
Short-term bridge; refi at stabilization.
Listing history 4 events
-
2026-03-17status Pending
-
2026-03-11status Active
-
2026-01-06status Pending
-
2025-12-31$159,000 Active
ⓘ Source: listings_history table (triggers on properties + properties_extension) + one-shot
backfill from property_details.listing_events for pre-trigger history.
Tax reassessment forecast TN · Resets to sale price
- Current annual tax
- $1,092 · $91/mo
- Projected year-2 tax
- $1,129 · $94/mo
- Expected delta
- +$37/yr (+$3/mo · 3.4%)
ⓘ Screening estimate from a state-policy table — verify with the county assessor before closing.
Climate risk First Street
- Flood 1/10 Low FEMA zone X (unshaded) · 0% chance over 30 yrs
- Wildfire 1/10 Low
- Heat 6/10 Major 7 d/yr ≥108°F today · 20 d/yr by 30 yrs out
- Wind 4/10 Moderate 14% chance of damaging wind over 30 yrs
- Air quality 1/10 Low 0 unhealthy d/yr today · 0 by 30 yrs out
Nearby sold comps map
Loading sold comps map…
Walkable amenities ~0.75 mi
Loading nearby amenities…
Taxation est. · year 1
- Rental income
- $16,042
- − Mortgage interest
- −$8,906
- − Property taxes
- −$1,092
- − Insurance
- −$795
- − Repairs & maintenance
- −$1,283
- − Management
- −$1,283
- − Depreciation
- −$4,625
- Taxable loss
- −$1,943
- Est. tax savings @ 24.0%
- +$466
- After-tax cash flow
- $1,247/yr
For passive investors: Depreciation is non-cash, so a rental often shows a tax loss while cash-flowing — sheltering income. Rental losses are passive: they offset passive income freely, and up to $25,000/yr can offset ordinary (W-2) income if you actively participate and your MAGI is under $100k (phasing out to $0 by $150k); unused losses carry forward. On sale, claimed depreciation is recaptured at up to 25%, and gains may owe capital-gains tax (a 1031 exchange can defer both). Figures are a year-1 estimate at your 24.0% rate — not tax advice; consult a CPA.
Schools (NCES district)
- District
- Dyer County
- NCES district ID
- 4701050
- Math proficiency
- 40% ▼ -14.00%
- Reading proficiency
- 38% ▼ -1.00%
- Median HH income
- $44,865
- Composite
- 33.19/100
- National rank
- #5536
- State rank
- #16 of 139 in TN
Livability — Fowlkes
No livability data for this city. (Only ~50 U.S. cities are tracked.)
Census & demographics
- County
- Dyer County · 25,952 people
- Metro
- Dyersburg, TN
- Population (ZIP)
- 25,952
- Household income
- $57,061
- Rent vs Own
- Severe rent burden
- 939.0
Population outlook (Dyer County) Hauer SSP2
- Today (2025)
- 36,770 people
- By 2030
- 35,863 · -2.5%
- By 2040
- 33,989 · -7.6%
- By 2050
- 32,124 · -12.6%
- By 2075
- 28,702 · -21.9%
- By 2100
- 25,745 · -30.0%
Race, ethnicity, and origin ACS 2023
- Neighborhood character
- Predominantly White (74%)
- Race & ethnicity
- White 74% Black 19% Two or more races 4% Hispanic / Latino 3%
- Common ancestry
- Italian 2% Romanian 2% Serbian 2%
- Foreign-born
- 2% · Canada
- Languages at home
- 97% English-only · Spanish 2%
Political lean MEDSL · Dyer
- 2024 margin
- Solid R (+61.8) · D 18.8% · R 80.6%
- 2008→2024 swing
- -24.1pp toward R · 2008: -37.7pp · 2024: -61.8pp
- All cycles
- 2024: R+61.8 2020: R+57.1 2016: R+55.4 2012: R+44.7 2008: R+37.7
Not yet ingested
- Civics
- —
Market trends
- HPI YoY
- ▼ -64.52%
- Current HPI
- 162.1695
- Rent YoY
- —
- Metro
- Dyersburg, TN
- State GDP YoY
- ▲ 2.78%
- F500 in state
- 22
Industry mix (Fortune 500 HQ in TN)
| Industry | F500 HQs | Revenue |
|---|---|---|
| Healthcare | 3 | $91B |
|
||
| Retail | 3 | $72B |
|
||
| Transportation / Logistics | 1 | $88B |
|
||
| Paper / Packaging | 1 | $19B |
|
||
| Insurance | 1 | $13B |
|
||
| Energy | 1 | $12B |
|
||
Price history
4 events — show timeline
- 2026-03-17 Pending — CWTAR
- 2026-03-11 Relisted — CWTAR
- 2026-01-06 Pending — CWTAR
- 2025-12-31 Listed $159,000 CWTAR
Property tax history
+3.3%/yrLatest (2025): $1,092 · +49.4% YoY. Source: county tax records.
Cash-flow waterfall
monthlySold comps — $/sqft
last 12 mo · ≤1 miLoading sold comps…