134 W College St · Henry, TN
Flood risk 1/10 · Minimal
- FEMA flood zone
- X (unshaded)
- Chance of flooding over 30 yrs
- 0.0%
- Est. flood insurance / yr
- $507 – $1,088
Fire risk 3/10 · Minor
- Est. fire insurance / yr
- $949 – $1,763
Heat risk 5/10 · Moderate
- Hot days now (above 107°F)
- 7 days/yr
- Hot days in 30 yrs
- 20 days/yr
Wind risk 4/10 · Minor
- Chance of severe wind over 30 yrs
- 12.0%
Air-quality risk 1/10 · Minimal
- Unhealthy air days now
- 0 days/yr
- Unhealthy air days in 30 yrs
- 0 days/yr
Risk factors via First Street. Map © Google.
Why this score? — see what drove the C- grade
The composite is a weighted blend of 9 inputs, each scored 0–100. Each bar is that input's sub-score; the figure is the points it added to the 100-point composite (weight × sub-score).
- Cash flow +15.0/30.0
- Appreciation +8.9/10.0
- ARV discount +7.5/15.0
- 1% rule +5.0/10.0
- DSCR +5.0/10.0
- Livability +2.9/5.0
- Rent growth +2.5/5.0
- Schools +2.5/10.0
- Condition / age +1.0/5.0
$19,200
🖨 Deal sheet (PDF) 📄 Offer letter ✓ Due diligence
Listing remarks
INVESTORS CHECK OUT THIS. Buyer/buyers agent to verify any/all pertinent information. Do not approach homes without contacting sellers agent. Home is occupied. Listed for tax appraisal amount. Any offers will be presented. Will sell below tax appraisal amount.
Key facts
- 6,098 sq ft lot
- Built 1927
- Listed 82 days
Property features AI
Exterior
- Parking: No garage
- Utilities: Public water; Septic tank sewer
- Home design: Single-family residence; One-story
- Construction: Built with other/unspecified construction materials
- Exterior features: No exterior features listed; No fencing
Interior
- Bedrooms: One bedroom on the main level
- Bathrooms: Two full bathrooms
- Heating & cooling: No heating system specified; No cooling system specified
- Interior features: No built-in appliances listed; Crawl space basement
Neighborhood map
What this means for you Summary
Snapshot
- This is a 2-bed/2.0-bath single-family listed at $19k. Condition is rated poor.
Deal economics
- At list price, monthly cash flow is $529 ($6k/yr) — positive.
- The deal already cash-flows at list — no discount required.
- Meets the 1% rule at list price ($837 rent vs $19k).
- Recommended offer: $18k (6.0% below list) — sets the bar for market timing.
Location & tenants
- Location reads 57/100 on livability (#334 in TN) — a working-class tenant base; expect higher turnover. Strengths: cost of living A+, housing A; Watch: health & safety C-, crime F, amenities F.
- Henry County (rural): math 30% / reading 30% proficiency, ranked #60 of 139 in TN (top 43%) — families likely to look elsewhere, expect single-tenant / working-renter base with shorter leases.
- Zoned schools: Henry Elementary (math 32% / reading 22%, grade F, #496 of 952 statewide, top 55%, 335 students, 0% FRL) — zoned schools average 0% FRL vs 55% district-wide (55 pts lower); this property's tenant base skews higher-income than the district average.
- Market conditions: 13 active listings in the ZIP; 19 units permitted in Henry County in 2024 (0 in 5+ unit buildings).
Forward outlook
- In year one you build about $2k of equity ($133 loan paydown + $2k appreciation (7.9% local appreciation)).
- Henry County population projected to shrink 10% by 2050 — rents likely to lag national; underwrite the cash flow, not the appreciation.
- At projected returns (7.9% appreciation + 3.0% rent growth), your $5k cash investment doubles in ~1 year — after that, you're playing with house money.
Negotiation context
- It's been on market 82 days — a 6% lower offer ($18k) is reasonable based on typical stale-listing flexibility.
Risks & watch-outs
- Watch-outs: built in 1927 — expect roof / HVAC / electrical / plumbing capex.
- Climate carrying-cost: extreme-heat days projected 7→20/yr by 2055 (HVAC capex compounding) — expect insurance premiums to compound above CPI over the hold.
Questions for the listing agent
- It's been on market 82 days. Have you received any prior offers? Is the seller open to a 6% concession, seller financing, or rate buy-down credit?
- Have any recent inspections been done? Can we get a copy of the seller's disclosures and any deferred-maintenance estimates?
- Built in 1927 — when were the roof, HVAC, electrical panel, plumbing, and water heater last replaced?
- Why hasn't it sold? Are there any deal-killer items the seller is aware of (foundation, flood, title, zoning, code violations)?
- Is there a deadline driving the sale (1031 exchange, divorce, estate, relocation)? That informs how much negotiation room exists.
- Schools are F-rated, which usually means shorter tenancies and higher turnover. Who's the typical renter profile here, and what's been the actual vacancy rate?
- Crime grade is F in this area — have there been break-ins, vandalism, or insurance claims at this property in the last 3 years? What carrier currently insures it and at what premium?
- What's the average days-on-market for RENTAL listings here right now (not sales)? A rising rental-DOM trend means longer vacancies and softer asking-rent achievability than the comps imply.
- What's the recent tenant-quality profile in this submarket — average credit score on applications, eviction rate, late-payment / NSF rate, and stable-employment percentage? A property-management company in the area should have these aggregated.
- How much new for-sale + rental construction is in the pipeline within 1–3 miles? Heavy new supply typically softens prices + rents 12–24 months out; constrained supply supports both.
Investment metrics
- 1% rule
- 4.36% ✓
- Cap rate
- 39.34%
- Cash-on-cash
- 118.02%
- DSCR
- 6.25
- GRM
- 1.9
CMA / ARV
No comps found within radius.
Projected returns pro-forma
7.86% appreciation · 3.0% rent growth · sell at horizon
- IRR
- —
- Equity multiple
- 8.70×
- Total profit
- $41,421
- Equity at exit
- $14,398
- IRR
- —
- Equity multiple
- 18.70×
- Total profit
- $95,180
- Equity at exit
- $28,403
Cash invested: $5,376 (down + closing). Projections, not guarantees.
Landlord ↔ Tenant lean methodology
- Overall (STATE)
- 87 Strongly Landlord-Friendly
- State Tennessee
- 87 Strongly Landlord-Friendly · R+13
- County
- — inherits STATE
- City
- — inherits STATE
ZIP-level market 38231
- Home prices YoY
- 2.8%
- Active inventory
- 13
- Price-to-rent
- 1.9×
Monthly cashflow live
- Estimated rent
- $837 medium interval (Pro) →
- Mortgage (P&I)
- −$101
- Tax est. 1.5%
- −$24 /mo · $288/yr
- Insurance
- −$8
- HOA
- −$0
- Vacancy / Maint / Mgmt
- −$176
- Net cashflow
- $529
Break-even live
Sensitivity live
| Price | -10% $542 | -5% $535 | +0% $529 | +5% $522 | +10% $515 |
|---|---|---|---|---|---|
| Rent | -10% $463 | -5% $496 | +0% $529 | +5% $562 | +10% $595 |
| Rate | -1.0pp $538 | -0.5pp $534 | base $529 | +0.5pp $524 | +1.0pp $519 |
UW: 25.0% down · 7.5% · 30yr · 1.5% tax · 5.0% vac · 8.0% maint · 8.0% mgmt
Financing live
Cash to close
- Down payment
- $4,800
- Closing costs
- $576
- Reserves months
- —
- Total cash needed
- —
Loan-product check · same deal, 3 products live
Conventional
25% down · 7.5% · 30yr
- Down + closing
- —
- Monthly P&I
- —
- Monthly cashflow
- —
- DSCR
- —
- Eligible?
- —
Personal DTI + credit; lowest rate.
DSCR
20% down · 8.5% · 30yr
- Down + closing
- —
- Monthly P&I
- —
- Monthly cashflow
- —
- DSCR
- —
- Eligible?
- —
No personal income docs; deal must DSCR.
Hard money
10% down · 12.0% · 12mo
- Down + closing
- —
- Monthly P&I
- —
- Monthly cashflow
- —
- DSCR
- —
- Eligible?
- —
Short-term bridge; refi at stabilization.
Listing history 16 events
-
2026-06-21days on market $19,200 Active 82 DOM
-
2026-06-18days on market $19,200 Active 80 DOM
-
2026-06-17days on market $19,200 Active 79 DOM
-
2026-06-16days on market $19,200 Active 78 DOM
-
2026-06-15days on market $19,200 Active 77 DOM
-
2026-06-13days on market $19,200 Active 75 DOM
-
2026-06-12days on market $19,200 Active 74 DOM
-
2026-06-09days on market $19,200 Active 71 DOM
-
2026-06-08days on market $19,200 Active 70 DOM
-
2026-06-08days on market $19,200 Active 69 DOM
-
2026-06-07days on market $19,200 Active 68 DOM
-
2026-06-03days on market $19,200 Active 65 DOM
-
2026-06-02days on market $19,200 Active 64 DOM
-
2026-06-01days on market $19,200 Active 63 DOM
-
2026-05-31days on market $19,200 Active 62 DOM
-
2026-03-30$19,200 Active
ⓘ Source: listings_history table (triggers on properties + properties_extension) + one-shot
backfill from property_details.listing_events for pre-trigger history.
Climate risk First Street
- Flood 1/10 Low FEMA zone X (unshaded) · 0% chance over 30 yrs
- Wildfire 3/10 Moderate
- Heat 5/10 Major 7 d/yr ≥107°F today · 20 d/yr by 30 yrs out
- Wind 4/10 Moderate 12% chance of damaging wind over 30 yrs
- Air quality 1/10 Low 0 unhealthy d/yr today · 0 by 30 yrs out
Nearby sold comps map
Loading sold comps map…
Walkable amenities ~0.75 mi
Loading nearby amenities…
Taxation est. · year 1
- Rental income
- $10,047
- − Mortgage interest
- −$1,075
- − Property taxes
- −$288
- − Insurance
- −$96
- − Repairs & maintenance
- −$804
- − Management
- −$804
- − Depreciation
- −$559
- Taxable income
- $6,422
- Est. tax owed @ 24.0%
- −$1,541
- After-tax cash flow
- $4,804/yr
For passive investors: Depreciation is non-cash, so a rental often shows a tax loss while cash-flowing — sheltering income. Rental losses are passive: they offset passive income freely, and up to $25,000/yr can offset ordinary (W-2) income if you actively participate and your MAGI is under $100k (phasing out to $0 by $150k); unused losses carry forward. On sale, claimed depreciation is recaptured at up to 25%, and gains may owe capital-gains tax (a 1031 exchange can defer both). Figures are a year-1 estimate at your 24.0% rate — not tax advice; consult a CPA.
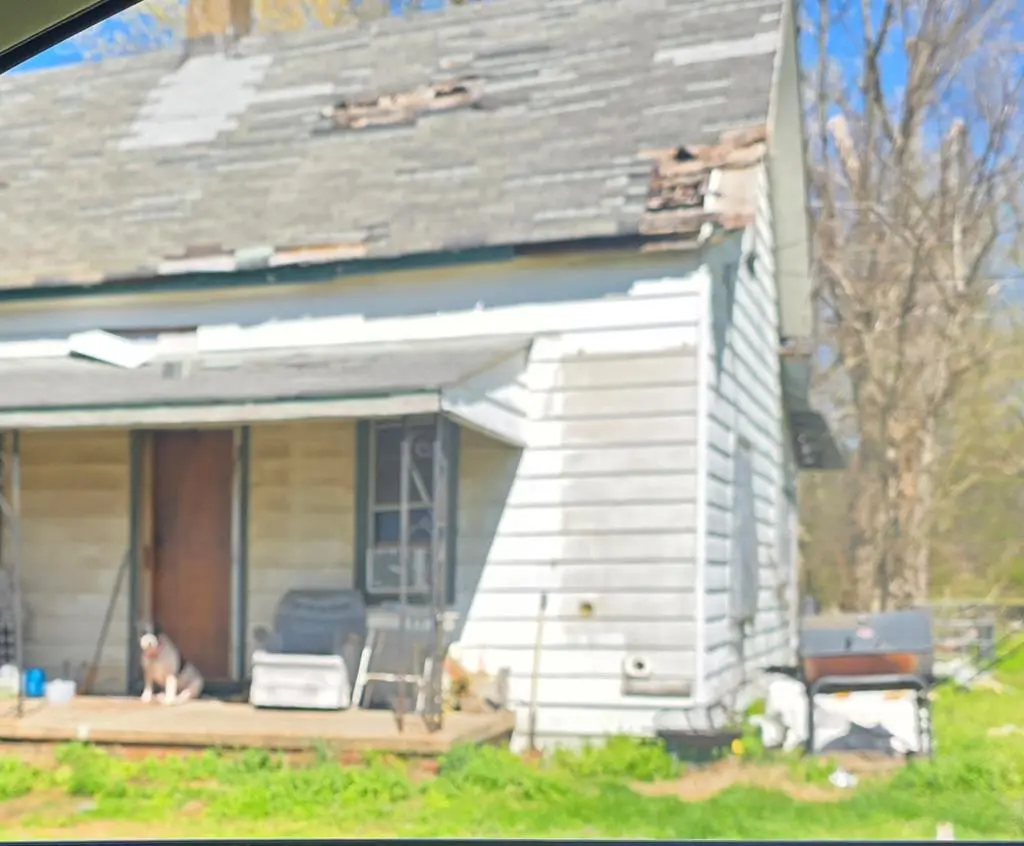
Condition & rehab AI · 2 photos
This home requires extensive repairs, including a new roof and siding, to improve its condition and value. Significant updates are needed to make it move-in ready.
Repairs flagged
- Major roof — Damaged shingles
- Major exterior siding — Peeling paint and siding damage
Value-add opportunities
- Resale new roof — A new roof would significantly improve the home's appearance and value
- Resale new siding and paint — New siding and paint would enhance the home's curb appeal and value
- Both interior updates — Interior updates would improve the home's livability and attract more buyers/renters
Renovation cost estimate screening
| Repair item | Severity | Est. cost |
|---|---|---|
| roof · Damaged shingles | Major | $15,000–50,000 |
| exterior siding · Peeling paint and siding damage | Major | $15,000–50,000 |
| Total estimated repair cost · 2 items | $30,000–100,000 |
Value-add ROI direction
- Resale new roof — A new roof would significantly improve the home's appearance and value ↑
- Resale new siding and paint — New siding and paint would enhance the home's curb appeal and value ↑
- Both interior updates — Interior updates would improve the home's livability and attract more buyers/renters ↑
ⓘ Cost ranges are severity-bucket heuristics (US national rule-of-thumb). Get contractor quotes + a written scope before underwriting a rehab budget.
Schools (NCES district)
- District
- Henry County
- NCES district ID
- 4701830
- Math proficiency
- 30% ▼ -3.00%
- Reading proficiency
- 30% ▼ -6.00%
- Median HH income
- $41,770
- Composite
- 25.42/100
- National rank
- #7457
- State rank
- #60 of 139 in TN
Livability — Henry
- Score
- 57/100
- State rank
- #334
- US rank
- #22148
Category grades
Schools grade is shown separately in the Schools card above.
Census & demographics
- Census place
- Henry, TN
- Population (ZIP)
- 2,012
Population outlook (Henry County) Hauer SSP2
- Today (2025)
- 31,750 people
- By 2030
- 31,277 · -1.5%
- By 2040
- 30,064 · -5.3%
- By 2050
- 28,675 · -9.7%
- By 2075
- 25,767 · -18.8%
- By 2100
- 22,318 · -29.7%
Race, ethnicity, and origin ACS 2023
- Neighborhood character
- Predominantly White (86%)
- Race & ethnicity
- White 86% Hispanic / Latino 7% Black 6% Two or more races 3%
- Hispanic origin (detail)
- Mexican 6%
- Common ancestry
- Slovak 2% Serbian 2% Lithuanian 1%
- Foreign-born
- 4% · Canada
- Languages at home
- 96% English-only · Spanish 3% German/W. Germanic 1%
Political lean MEDSL · Henry
- 2024 margin
- Solid R (+55.3) · D 21.8% · R 77.1% · Other 1.1%
- 2008→2024 swing
- -33.0pp toward R · 2008: -22.4pp · 2024: -55.3pp
- All cycles
- 2024: R+55.3 2020: R+51.1 2016: R+49.8 2012: R+30.2 2008: R+22.4
Not yet ingested
- Civics
- —
Market trends
- HPI YoY
- ▲ 7.86%
- Current HPI
- 290.6775
- Rent YoY
- —
- Metro
- —
- State GDP YoY
- ▲ 2.78%
- F500 in state
- 22
Industry mix (Fortune 500 HQ in TN)
| Industry | F500 HQs | Revenue |
|---|---|---|
| Healthcare | 3 | $91B |
|
||
| Retail | 3 | $72B |
|
||
| Transportation / Logistics | 1 | $88B |
|
||
| Paper / Packaging | 1 | $19B |
|
||
| Insurance | 1 | $13B |
|
||
| Energy | 1 | $12B |
|
||
Price history
1 event — show timeline
- 2026-03-30 Listed $19,200 TVAR
Cash-flow waterfall
monthlySold comps — $/sqft
last 12 mo · ≤1 miLoading sold comps…