219 W Beachwood Loop · Tool, TX
Flood risk 1/10 · Minimal
- FEMA flood zone
- X (unshaded)
- Chance of flooding over 30 yrs
- 0.0%
- Est. flood insurance / yr
- $507 – $1,088
Fire risk 3/10 · Minor
- Est. fire insurance / yr
- $1,222 – $2,270
Heat risk 6/10 · Moderate
- Hot days now (above 109°F)
- 7 days/yr
- Hot days in 30 yrs
- 24 days/yr
Wind risk 6/10 · Moderate
- Chance of severe wind over 30 yrs
- 60.0%
Air-quality risk 2/10 · Minimal
- Unhealthy air days now
- 0 days/yr
- Unhealthy air days in 30 yrs
- 1 days/yr
Risk factors via First Street. Map © Google.
Why this score? — see what drove the F grade
The composite is a weighted blend of 9 inputs, each scored 0–100. Each bar is that input's sub-score; the figure is the points it added to the 100-point composite (weight × sub-score).
- ARV discount +7.3/15.0
- Appreciation +5.5/10.0
- Cash flow +4.9/30.0
- Schools +4.3/10.0
- Livability +3.3/5.0
- Rent growth +2.5/5.0
- Condition / age +2.5/5.0
- 1% rule +0.5/10.0
- DSCR +0.0/10.0
$270,000
🖨 Deal sheet 📄 Offer letter ✓ Due diligence
Listing remarks MLS
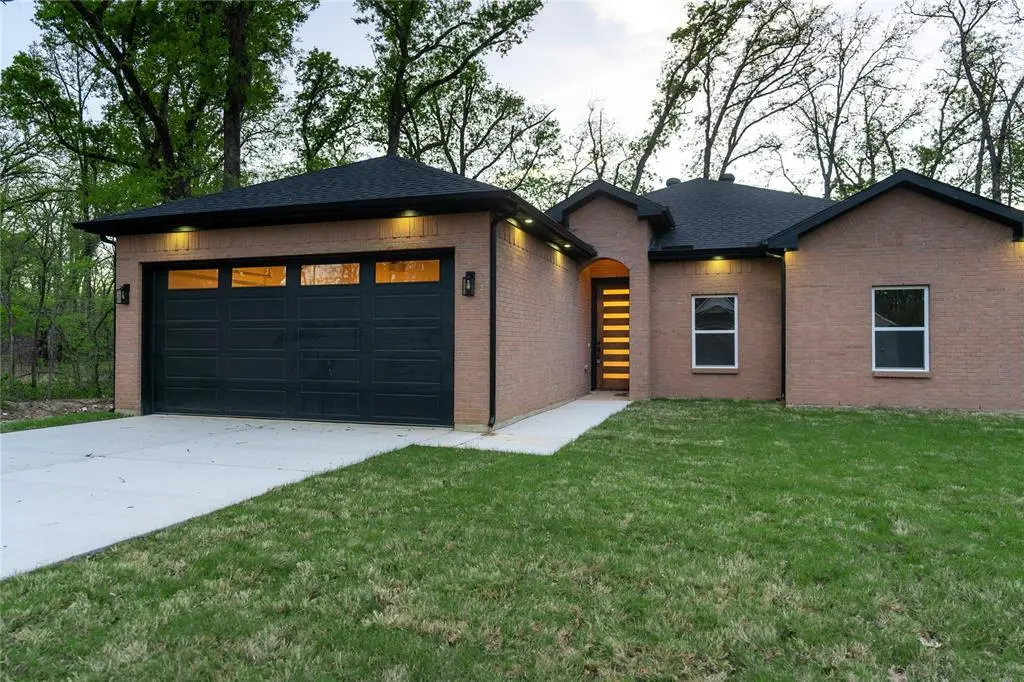
This newly constructed 4-bedroom, 2-bath home offers a thoughtful blend of modern design and everyday functionality, situated on a quiet neighborhood in Trinidad, Texas. Featuring a classic red brick exterior with sleek black accents, the home delivers strong curb appeal with a contemporary touch. Inside, an open-concept layout creates a seamless flow between the living, dining, and kitchen areas—ideal for both daily living and entertaining. The kitchen is equipped with a large island, ample workspace, and abundant natural light that enhances the home’s bright and inviting atmosphere. The private primary suite provides a comfortable retreat, complete with a spacious walk-in closet and a well-appointed bathroom featuring a double vanity, separate bathtub, and dedicated shower. Additional highlights include a two-car garage, generous secondary bedrooms, and a layout designed for convenience and comfort. This home combines modern finishes with a practical floor plan, making it a strong option for a variety of lifestyles.
Key facts
- 6,970 sq ft lot
- 2 garage spots
- Built 2026
Neighborhood map
What this means for you Summary
Snapshot
- This is a 4-bed/2.0-bath single-family listed at $270k.
Deal economics
- At list price, monthly cash flow is $-647 ($-8k/yr) — negative.
- To cash-flow at today's rent, offer at most $156k (42.3% below list).
- To meet the 1% rule (rent ≥ 1% of price), the offer needs to be $150k (44.6% below list).
- Recommended offer: $150k (44.6% below list) — sets the bar for 1% rule.
- Cap rate 3.4% vs local median 2.8% in Tool — meaningfully above typical; check what's discounted (condition, days-on-market, listing class) to confirm the premium yield is real.
Location & tenants
- Location reads 66/100 on livability (#651 in TX) — a middle-class / working-renter tenant base. Strengths: crime A+, cost of living A+, housing A+; Watch: employment D, amenities F, commute F.
- Malakoff ISD (town): math 48% / reading 54% proficiency, ranked #187 of 826 in TX (top 23%) — acceptable for families but not a draw, mixed tenant base, ~2y average lease; 61% free/reduced lunch — lower-income household profile, screen leases tightly.
- Market conditions: 162 active listings in the ZIP; 2 comparable units currently listed for rent nearby; 263 units permitted in Henderson County in 2024 (0 in 5+ unit buildings).
Forward outlook
- In year one you build about $5k of equity ($2k loan paydown + $3k appreciation (1.0% local appreciation)).
- By year 7, paydown + projected appreciation supports a ~$32k cash-out refi (75% LTV) — recoverable capital for the next deal without selling this one.
Negotiation context
- It's been on market 88 days — a 6% lower offer ($254k) is reasonable based on typical stale-listing flexibility.
Risks & watch-outs
- Climate carrying-cost: major wind risk, 60% chance of damaging wind over 30y; extreme-heat days projected 7→24/yr by 2055 (HVAC capex compounding) — expect insurance premiums to compound above CPI over the hold.
Questions for the listing agent
- What do current leases actually rent for vs. the listed asking? Can we see a recent rent roll and the last 12 months of T-12 income?
- It's been on market 88 days. Have you received any prior offers? Is the seller open to a 45% concession, seller financing, or rate buy-down credit?
- Why hasn't it sold? Are there any deal-killer items the seller is aware of (foundation, flood, title, zoning, code violations)?
- Is there a deadline driving the sale (1031 exchange, divorce, estate, relocation)? That informs how much negotiation room exists.
- The area grade is low — what's the realistic commute time and amenity access for the typical tenant pool here? Any planned neighborhood developments (good or bad) we should know about?
- What's the average days-on-market for RENTAL listings here right now (not sales)? A rising rental-DOM trend means longer vacancies and softer asking-rent achievability than the comps imply.
- What's the recent tenant-quality profile in this submarket — average credit score on applications, eviction rate, late-payment / NSF rate, and stable-employment percentage? A property-management company in the area should have these aggregated.
- How much new for-sale + rental construction is in the pipeline within 1–3 miles? Heavy new supply typically softens prices + rents 12–24 months out; constrained supply supports both.
Investment metrics
- 1% rule
- 0.55% ✗
- Cap rate
- 3.42%
- Cash-on-cash
- -10.26%
- DSCR
- 0.54
- GRM
- 15.1
CMA / ARV
- ARV (median comp)
- $268,629
- List price
- $270,000
- Delta
- 0.51%
- Verdict
- FAIR
- Comps
- 20 within 1.0 mi
Show comp detail 12 sales within ~0.75 mi
| Address | Dist | Beds/Ba | Sqft | Sold | Price | $/sf | Match |
|---|---|---|---|---|---|---|---|
| 212 E Beachwood Loop | 0.05mi | 3/2.0 (-1) | 1,500 (+11%) | 1mo | $272,500 | $182 | 73 |
| 102 Channelview | 0.47mi | 3/2.0 (-1) | 1,450 (+8%) | 2mo | $269,000 | $186 | 59 |
| 206 E Beachwood Loop | 0.11mi | 3/2.0 (-1) | 1,502 (+11%) | 16mo | $265,000 | $176 | 58 |
| 118 Channelview Dr | 0.43mi | 3/2.0 (-1) | 1,467 (+9%) | 4mo | $258,900 | $176 | 57 |
| 215 W Beachwood Loop | 0.06mi | 3/2.0 (-1) | 1,540 (+14%) | 16mo | $257,999 | $168 | 55 |
| 114 Westwood Dr | 0.67mi | 3/2.0 (-1) | 1,320 (-2%) | 9mo | $251,000 | $190 | 52 |
| 114 Quail Run Rd | 0.30mi | 3/2.0 (-1) | 1,500 (+11%) | 13mo | $269,000 | $179 | 52 |
| 122 Oakwood Dr | 0.43mi | 3/2.0 (-1) | 1,480 (+10%) | 9mo | $285,000 | $193 | 51 |
| 105 Oakwood Dr | 0.52mi | 3/2.0 (-1) | 1,500 (+11%) | 4mo | $289,900 | $193 | 48 |
| 100 Indian Blanket Ln | 0.35mi | 3/2.5 (-1) | 1,534 (+14%) | 8mo | $345,000 | $225 | 47 |
| 107 Lakeview Dr | 0.37mi | 3/2.0 (-1) | 1,500 (+11%) | 15mo | $289,000 | $193 | 47 |
| 215 Lakeview Dr | 0.33mi | 3/3.0 (-1) | 1,537 (+14%) | 11mo | $475,000 | $309 | 43 |
Match score weights: distance 35% · size 25% · config 20% · recency 20%. Top-matched comps best support the ARV.
Projected returns pro-forma
1.03% appreciation · 3.0% rent growth · sell at horizon
- IRR
- -9.4%
- Equity multiple
- 0.53×
- Total profit
- $-35,675
- Equity at exit
- $92,659
- IRR
- -3.5%
- Equity multiple
- 0.57×
- Total profit
- $-32,828
- Equity at exit
- $123,511
Cash invested: $75,600 (down + closing). Projections, not guarantees.
Landlord ↔ Tenant lean methodology
- Overall (STATE)
- 87 Strongly Landlord-Friendly
- State Texas
- 87 Strongly Landlord-Friendly · R+5
- County
- — inherits STATE
- City
- — inherits STATE
ZIP-level market 75163
- Home prices YoY
- 0.5%
- Active inventory
- 162
- Price-to-rent
- 15.1×
Monthly cashflow live
- Estimated rent
- $1,495 medium interval (Pro) →
- Mortgage (P&I)
- −$1,416
- Tax from tax record
- −$299 /mo · $3,590/yr
- Insurance
- −$112
- HOA
- −$0
- Vacancy / Maint / Mgmt
- −$314
- Net cashflow
- $-647
Break-even live
UW: 25.0% down · 7.5% · 30yr · 1.5% tax · 5.0% vac · 8.0% maint · 8.0% mgmt
Financing live
Cash to close
- Down payment
- $67,500
- Closing costs
- $8,100
- Reserves months
- —
- Total cash needed
- —
Loan-product check · same deal, 3 products live
Conventional
25% down · 7.5% · 30yr
- Down + closing
- —
- Monthly P&I
- —
- Monthly cashflow
- —
- DSCR
- —
- Eligible?
- —
Personal DTI + credit; lowest rate.
DSCR
20% down · 8.5% · 30yr
- Down + closing
- —
- Monthly P&I
- —
- Monthly cashflow
- —
- DSCR
- —
- Eligible?
- —
No personal income docs; deal must DSCR.
Hard money
10% down · 12.0% · 12mo
- Down + closing
- —
- Monthly P&I
- —
- Monthly cashflow
- —
- DSCR
- —
- Eligible?
- —
Short-term bridge; refi at stabilization.
Rent comps 2 comps
| Address | Beds | Baths | Sqft | Rent | $/sqft | DOM | Units | Dist |
|---|---|---|---|---|---|---|---|---|
| 102 Plumthicket Ln Trinidad, TX | 3.0 | 2.0 | 1200 | $1,495 | $1.25 | 43d | 1 | 0.99mi |
| 100 Plumthicket Ln Trinidad, TX | 3.0 | 2.0 | 1200 | $1,495 | $1.25 | 43d | 1 | 1.00mi |
Listing history 22 events
-
2026-06-19days on market $270,000 Active 88 DOM
-
2026-06-18days on market $270,000 Active 87 DOM
-
2026-06-17days on market $270,000 Active 86 DOM
-
2026-06-16days on market $270,000 Active 85 DOM
-
2026-06-15days on market $270,000 Active 84 DOM
-
2026-06-14days on market $270,000 Active 82 DOM
-
2026-06-12days on market $270,000 Active 81 DOM
-
2026-06-09days on market $270,000 Active 78 DOM
-
2026-06-08days on market $270,000 Active 77 DOM
-
2026-06-07days on market $270,000 Active 76 DOM
-
2026-06-02days on market $270,000 Active 71 DOM
-
2026-06-01days on market $270,000 Active 70 DOM
-
2026-05-31days on market $270,000 Active 69 DOM
-
2026-05-30days on market $270,000 Active 68 DOM
-
2026-03-23$270,000 Active 1054-char remark
Show marketing remark (1054 chars)
This newly constructed 4-bedroom, 2-bath home offers a thoughtful blend of modern design and everyday functionality, situated on a quiet neighborhood in Trinidad, Texas. Featuring a classic red brick exterior with sleek black accents, the home delivers strong curb appeal with a contemporary touch. Inside, an open-concept layout creates a seamless flow between the living, dining, and kitchen areas—ideal for both daily living and entertaining. The kitchen is equipped with a large island, ample workspace, and abundant natural light that enhances the home’s bright and inviting atmosphere. The private primary suite provides a comfortable retreat, complete with a spacious walk-in closet and a well-appointed bathroom featuring a double vanity, separate bathtub, and dedicated shower. Additional highlights include a two-car garage, generous secondary bedrooms, and a layout designed for convenience and comfort. This home combines modern finishes with a practical floor plan, making it a strong option for a variety of lifestyles.
-
2024-11-05soldstatus
-
2024-03-14soldstatus
-
2023-06-09soldstatus
-
2023-06-09soldstatus
-
2023-04-19soldstatus
-
2022-01-05soldstatus
-
2022-01-05soldstatus
ⓘ Source: listings_history table (triggers on properties + properties_extension) + one-shot
backfill from property_details.listing_events for pre-trigger history.
Tax reassessment forecast TX · Resets to sale price
- Current annual tax
- $3,590 · $299/mo
- Projected year-2 tax
- $4,941 · $412/mo
- Expected delta
- +$1,351/yr (+$113/mo · 37.6%)
ⓘ Screening estimate from a state-policy table — verify with the county assessor before closing.
Climate risk First Street
- Flood 1/10 Low FEMA zone X (unshaded) · 0% chance over 30 yrs
- Wildfire 3/10 Moderate
- Heat 6/10 Major 7 d/yr ≥109°F today · 24 d/yr by 30 yrs out
- Wind 6/10 Major 60% chance of damaging wind over 30 yrs
- Air quality 2/10 Low 0 unhealthy d/yr today · 1 by 30 yrs out
Nearby sold comps map
Loading sold comps map…
Walkable amenities ~0.75 mi
Loading nearby amenities…
Taxation est. · year 1
- Rental income
- $17,940
- − Mortgage interest
- −$15,124
- − Property taxes
- −$3,590
- − Insurance
- −$1,350
- − Repairs & maintenance
- −$1,435
- − Management
- −$1,435
- − Depreciation
- −$7,855
- Taxable loss
- −$12,849
- Est. tax savings @ 24.0%
- +$3,084
- After-tax cash flow
- $-4,675/yr
For passive investors: Depreciation is non-cash, so a rental often shows a tax loss while cash-flowing — sheltering income. Rental losses are passive: they offset passive income freely, and up to $25,000/yr can offset ordinary (W-2) income if you actively participate and your MAGI is under $100k (phasing out to $0 by $150k); unused losses carry forward. On sale, claimed depreciation is recaptured at up to 25%, and gains may owe capital-gains tax (a 1031 exchange can defer both). Figures are a year-1 estimate at your 24.0% rate — not tax advice; consult a CPA.
Schools (NCES district)
- District
- Malakoff ISD
- NCES district ID
- 4828780
- Math proficiency
- 48% ▼ -14.00%
- Reading proficiency
- 54% ▼ -5.00%
- Median HH income
- $38,970
- Composite
- 42.54/100
- National rank
- #3200
- State rank
- #187 of 826 in TX
Livability — Tool
- Score
- 66/100
- State rank
- #651
- US rank
- #12292
Category grades
Schools grade is shown separately in the Schools card above.
Census & demographics
- Population (ZIP)
- 2,569
Population outlook (Henderson County) Hauer SSP2
- Today (2025)
- 80,471 people
- By 2030
- 80,608 · +0.2%
- By 2040
- 80,087 · -0.5%
- By 2050
- 78,208 · -2.8%
- By 2075
- 72,423 · -10.0%
- By 2100
- 61,012 · -24.2%
Race, ethnicity, and origin ACS 2023
- Neighborhood character
- Predominantly White (77%)
- Race & ethnicity
- White 77% Two or more races 11% Hispanic / Latino 9% Black 6%
- Hispanic origin (detail)
- Mexican 8%
- Common ancestry
- Serbian 3% Lithuanian 1% European 1%
- Foreign-born
- 7% · Canada, Jamaica
- Languages at home
- 84% English-only · Arabic 10% Spanish 6%
Political lean MEDSL · Henderson
- 2024 margin
- Solid R (+63.5) · D 18.0% · R 81.4%
- 2008→2024 swing
- -18.8pp toward R · 2008: -44.6pp · 2024: -63.5pp
- All cycles
- 2024: R+63.5 2020: R+60.2 2016: R+60.0 2012: R+54.8 2008: R+44.6
Not yet ingested
- Civics
- —
Market trends
- HPI YoY
- ▲ 1.03%
- Current HPI
- 211.6125
- Rent YoY
- —
- Metro
- —
- State GDP YoY
- ▲ 3.95%
- F500 in state
- 110
Industry mix (Fortune 500 HQ in TX)
| Industry | F500 HQs | Revenue |
|---|---|---|
| Energy | 16 | $1,198B |
|
||
| Technology | 5 | $198B |
|
||
| Engineering / Construction | 4 | $72B |
|
||
| Energy Services | 3 | $60B |
|
||
| Utilities | 3 | $41B |
|
||
| Healthcare | 2 | $330B |
|
||
Price history
8 events — show timeline
- 2026-03-23 Listed $270,000 NTREIS
- 2024-11-05 Sold (Public Records) — Public Records
- 2024-03-14 Sold (Public Records) — Public Records
- 2023-06-09 Sold (Public Records) — Public Records
- 2023-06-09 Sold (Public Records) — Public Records
- 2023-04-19 Sold (Public Records) — Public Records
- 2022-01-05 Sold (Public Records) — Public Records
- 2022-01-05 Sold (Public Records) — Public Records
Property tax history
+43.7%/yrLatest (2025): $3,590 · -15.0% YoY. Source: county tax records.
Cash-flow waterfall
monthlySold comps — $/sqft
last 12 mo · ≤1 miLoading sold comps…