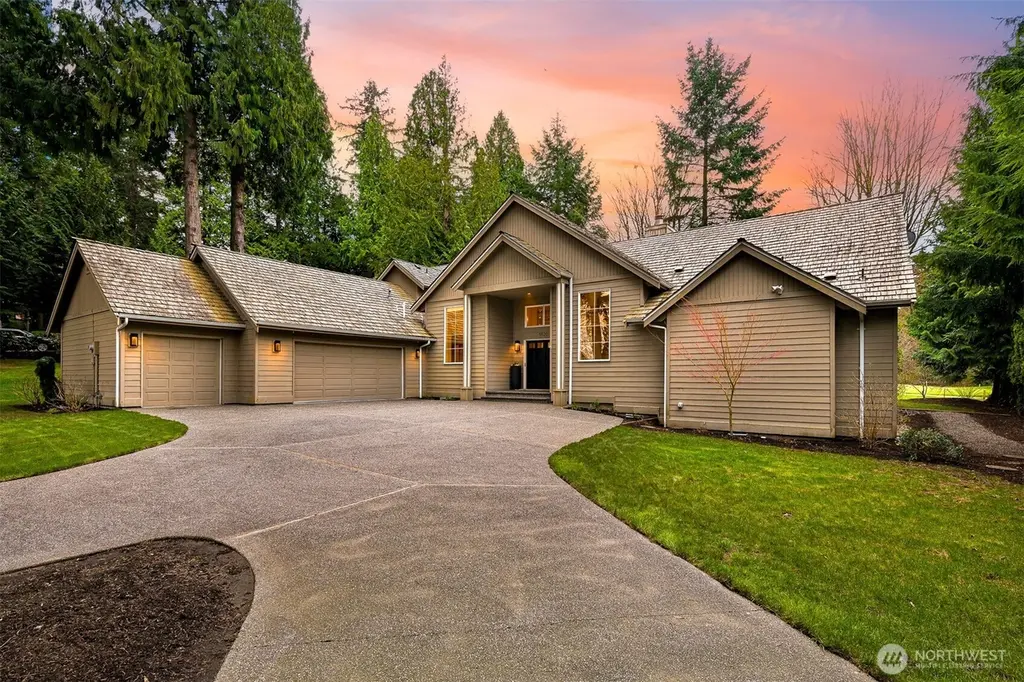
5520 Canvasback Rd · Blaine, WA
Flood risk 1/10 · Minimal
- FEMA flood zone
- X (unshaded)
- Chance of flooding over 30 yrs
- 0.0%
- Est. flood insurance / yr
- $507 – $1,088
Fire risk 1/10 · Minimal
- Est. fire insurance / yr
- $604 – $1,122
Heat risk 2/10 · Minimal
- Hot days now (above 79°F)
- 6 days/yr
- Hot days in 30 yrs
- 15 days/yr
Wind risk 1/10 · Minimal
- Chance of severe wind over 30 yrs
- —
Air-quality risk 7/10 · Major
- Unhealthy air days now
- 11 days/yr
- Unhealthy air days in 30 yrs
- 11 days/yr
Risk factors via First Street. Map © Google.
Why this score? — see what drove the D grade
The composite is a weighted blend of 9 inputs, each scored 0–100. Each bar is that input's sub-score; the figure is the points it added to the 100-point composite (weight × sub-score).
- ARV discount +15.0/15.0
- Appreciation +10.0/10.0
- Schools +4.7/10.0
- Livability +3.9/5.0
- Rent growth +3.3/5.0
- Condition / age +2.5/5.0
- Cash flow +1.4/30.0
- 1% rule +0.0/10.0
- DSCR +0.0/10.0
$995,000
🖨 Deal sheet (PDF) 📄 Offer letter ✓ Due diligence
Listing remarks
Enjoy beautiful natural light and golf course views in this home perfectly positioned along the 17th fairway of the Semiahmoo Golf & Country Club. With favorable southern exposure, the living spaces feel bright and welcoming throughout the day, a wonderful feature in this peaceful, tree-lined community. The thoughtful floor plan features a main level primary suite with soaring vaulted ceilings that enhance the sense of space and light. Recent updates include fresh interior paint, new carpet, and brand new stainless steel appliances, giving the home a clean and refreshed feel throughout. Multiple living areas offer flexibility for everyday living, entertaining, or creating a comfortabl
Key facts
- Southern exposure
- Spacious patio
- Golf course views
Tags
Neighborhood map
What this means for you Summary
Snapshot
- This is a 3-bed/3.0-bath single-family listed at $995k.
Deal economics
- At list price, monthly cash flow is $-4k ($-47k/yr) — negative.
- To cash-flow at today's rent, offer at most $303k (69.5% below list).
- To meet the 1% rule (rent ≥ 1% of price), the offer needs to be $307k (69.1% below list).
- Recommended offer: $303k (69.5% below list) — sets the bar for cash-flow.
- Cap rate 1.6% vs local median 2.1% in Blaine — below-typical yield; the buyer is paying a premium for something (appreciation thesis, condition, location) that the cap rate doesn't capture.
Location & tenants
- Location reads 78/100 on livability (#125 in WA, #2,491 nationally) — a middle-class / working-renter tenant base. Strengths: commute A+, health & safety A+, housing A; Watch: amenities F, cost of living F.
- Blaine School District (town): math 49% / reading 55% proficiency, ranked #120 of 291 in WA (top 41%) — acceptable for families but not a draw, mixed tenant base, ~2y average lease.
- Market conditions: Rents rising (+3.1%/yr); 454 active listings in the ZIP; solid renter incomes; 1,190 units permitted in Whatcom County in 2024 (327 in 5+ unit buildings).
- This rent runs 43% of the median local income ($87k/yr) — at the standard rent-burdened threshold; future hikes will face affordability resistance.
Forward outlook
- In year one you build about $106k of equity ($7k loan paydown + $100k appreciation (10.0% local appreciation)).
- Whatcom County population projected at +28% by 2050 — long-run rental-demand tailwind backs the buy-and-hold thesis.
- By year 2, paydown + projected appreciation supports a ~$171k cash-out refi (75% LTV) — recoverable capital for the next deal without selling this one.
Negotiation context
- It's been on market 86 days — a 6% lower offer ($935k) is reasonable based on typical stale-listing flexibility.
- 4 sale attempts since 6y ago with the ask held roughly flat each time — persistent listings suggest the price (not the market) is what's stuck; bring a comps-based counter.
- Current owner paid $674k; 48% above their basis — modest negotiation headroom, anchor on the comps not their cost.
Questions for the listing agent
- What do current leases actually rent for vs. the listed asking? Can we see a recent rent roll and the last 12 months of T-12 income?
- It's been on market 86 days. Have you received any prior offers? Is the seller open to a 70% concession, seller financing, or rate buy-down credit?
- What does the HOA fee cover, when was the last increase, and are there any pending special assessments or reserve-fund shortfalls?
- Why hasn't it sold? Are there any deal-killer items the seller is aware of (foundation, flood, title, zoning, code violations)?
- Is there a deadline driving the sale (1031 exchange, divorce, estate, relocation)? That informs how much negotiation room exists.
- Schools are B-rated — typically a magnet for longer-tenancy family renters. What's the average tenant stay here, and is there a school-zone premium baked into asking?
- The area grade is low — what's the realistic commute time and amenity access for the typical tenant pool here? Any planned neighborhood developments (good or bad) we should know about?
- What's the average days-on-market for RENTAL listings here right now (not sales)? A rising rental-DOM trend means longer vacancies and softer asking-rent achievability than the comps imply.
- What's the recent tenant-quality profile in this submarket — average credit score on applications, eviction rate, late-payment / NSF rate, and stable-employment percentage? A property-management company in the area should have these aggregated.
- How much new for-sale + rental construction is in the pipeline within 1–3 miles? Heavy new supply typically softens prices + rents 12–24 months out; constrained supply supports both.
Investment metrics
- 1% rule
- 0.31% ✗
- Cap rate
- 1.57%
- Cash-on-cash
- -16.87%
- DSCR
- 0.25
- GRM
- 27.0
CMA / ARV
- ARV (median comp)
- $1,224,571
- List price
- $995,000
- Delta
- -18.75%
- Verdict
- UNDERPRICED
- Comps
- 20 within 1.0 mi
Show comp detail 12 sales within ~0.75 mi
| Address | Dist | Beds/Ba | Sqft | Sold | Price | $/sf | Match |
|---|---|---|---|---|---|---|---|
| 5506 Canvasback Rd | 0.04mi | 3/3.5 | 3,560 (+1%) | 1mo | $1,329,000 | $373 | 94 |
| 5543 Night Heron Dr | 0.12mi | 3/5.0 | 3,584 (+2%) | 2mo | $1,359,000 | $379 | 82 |
| 8870 Cormorant Ct | 0.08mi | 3/3.5 | 3,697 (+5%) | 11mo | $1,425,000 | $385 | 77 |
| 8777 Goshawk Rd | 0.31mi | 4/2.5 (+1) | 3,494 (-1%) | 0mo | $985,000 | $282 | 77 |
| 5442 Goldfinch Way | 0.22mi | 3/3.5 | 3,260 (-8%) | 1mo | $2,150,000 | $660 | 74 |
| 5566 Sandpiper Ln | 0.35mi | 4/2.5 (+1) | 3,400 (-4%) | 1mo | $1,030,000 | $303 | 70 |
| 8986 Merganser Ct | 0.19mi | 3/3.5 | 3,761 (+6%) | 17mo | $1,445,000 | $384 | 64 |
| 9104 Pintail Loop | 0.63mi | 3/3.0 | 3,448 (-2%) | 12mo | $1,200,000 | $348 | 57 |
| 5555 Sandpiper Ln | 0.43mi | 4/3.0 (+1) | 3,059 (-13%) | 6mo | $1,025,000 | $335 | 48 |
| 8849 Goldeneye Ln | 0.30mi | 3/3.5 | 4,055 (+15%) | 14mo | $1,098,500 | $271 | 48 |
| 5578 Sandpiper Ln | 0.36mi | 4/3.5 (+1) | 3,850 (+9%) | 18mo | $1,251,000 | $325 | 46 |
| 5370 Golden Eagle Ln | 0.69mi | 3/2.5 | 3,076 (-13%) | 18mo | $1,100,000 | $358 | 29 |
Match score weights: distance 35% · size 25% · config 20% · recency 20%. Top-matched comps best support the ARV.
Projected returns pro-forma
10.0% appreciation · 3.1% rent growth · sell at horizon
- IRR
- 12.6%
- Equity multiple
- 2.05×
- Total profit
- $292,438
- Equity at exit
- $896,375
- IRR
- 13.1%
- Equity multiple
- 4.80×
- Total profit
- $1,057,455
- Equity at exit
- $1,933,066
Cash invested: $278,600 (down + closing). Projections, not guarantees.
Landlord ↔ Tenant lean methodology
- Overall (STATE)
- 28 Tenant-Leaning
- State Washington
- 28 Tenant-Leaning · D+8
- County
- — inherits STATE
- City
- — inherits STATE
ZIP-level market 98230
- Home prices YoY
- 14.0%
- Rents YoY
- 3.1%
- Active inventory
- 454
- Price-to-rent
- 27.0×
Monthly cashflow live
- Estimated rent
- $3,073 medium interval (Pro) →
- Mortgage (P&I)
- −$5,218
- Tax from tax record
- −$572 /mo · $6,867/yr
- Insurance
- −$415
- HOA
- −$140
- Vacancy / Maint / Mgmt
- −$645
- Net cashflow
- $-3,917
Break-even live
Sensitivity live
| Price | -10% $-3,354 | -5% $-3,636 | +0% $-3,917 | +5% $-4,199 | +10% $-4,481 |
|---|---|---|---|---|---|
| Rent | -10% $-4,160 | -5% $-4,039 | +0% $-3,917 | +5% $-3,796 | +10% $-3,675 |
| Rate | -1.0pp $-3,416 | -0.5pp $-3,664 | base $-3,917 | +0.5pp $-4,175 | +1.0pp $-4,437 |
UW: 25.0% down · 7.5% · 30yr · 1.5% tax · 5.0% vac · 8.0% maint · 8.0% mgmt
Financing live
Cash to close
- Down payment
- $248,750
- Closing costs
- $29,850
- Reserves months
- —
- Total cash needed
- —
Loan-product check · same deal, 3 products live
Conventional
25% down · 7.5% · 30yr
- Down + closing
- —
- Monthly P&I
- —
- Monthly cashflow
- —
- DSCR
- —
- Eligible?
- —
Personal DTI + credit; lowest rate.
DSCR
20% down · 8.5% · 30yr
- Down + closing
- —
- Monthly P&I
- —
- Monthly cashflow
- —
- DSCR
- —
- Eligible?
- —
No personal income docs; deal must DSCR.
Hard money
10% down · 12.0% · 12mo
- Down + closing
- —
- Monthly P&I
- —
- Monthly cashflow
- —
- DSCR
- —
- Eligible?
- —
Short-term bridge; refi at stabilization.
HOA detail
- Monthly dues
- $140 · $1,680/yr
Listing history 27 events
-
2026-06-18days on market $995,000 Active 86 DOM
-
2026-06-17days on market $995,000 Active 85 DOM
-
2026-06-16days on market $995,000 Active 84 DOM
-
2026-06-15days on market $995,000 Active 83 DOM
-
2026-06-14days on market $995,000 Active 81 DOM
-
2026-06-13days on market $995,000 Active 80 DOM
-
2026-06-10days on market $995,000 Active 78 DOM
-
2026-06-09days on market $995,000 Active 77 DOM
-
2026-06-08days on market $995,000 Active 76 DOM
-
2026-06-07days on market $995,000 Active 75 DOM
-
2026-06-05days on market $995,000 Active 72 DOM
-
2026-06-02days on market $995,000 Active 70 DOM
-
2026-06-01days on market $995,000 Active 69 DOM
-
2026-05-31days on market $995,000 Active 68 DOM
-
2026-05-30days on market $995,000 Active 67 DOM
-
2026-04-27price $995,000
-
2026-04-14status Active
-
2026-04-02status Pending
-
2026-03-13$1,025,000 Active
-
2022-06-14soldstatus $674,150 Closed
-
2022-05-21status Pending
-
2020-12-01status Active
-
2020-11-30status Pending
-
2020-11-30price $699,000
-
2020-10-14$739,000 Active
-
2003-08-26soldstatus $401,911
-
1990-01-24soldstatus $111,000
ⓘ Source: listings_history table (triggers on properties + properties_extension) + one-shot
backfill from property_details.listing_events for pre-trigger history.
Tax reassessment forecast WA · Resets to sale price
- Current annual tax
- $6,867 · $572/mo
- Projected year-2 tax
- $9,751 · $813/mo
- Expected delta
- +$2,884/yr (+$240/mo · 42.0%)
ⓘ Screening estimate from a state-policy table — verify with the county assessor before closing.
Climate risk First Street
- Flood 1/10 Low FEMA zone X (unshaded) · 0% chance over 30 yrs
- Wildfire 1/10 Low
- Heat 2/10 Low 6 d/yr ≥79°F today · 15 d/yr by 30 yrs out
- Wind 1/10 Low
- Air quality 7/10 Severe 11 unhealthy d/yr today · 11 by 30 yrs out
Nearby sold comps map
Loading sold comps map…
Walkable amenities ~0.75 mi
Loading nearby amenities…
Taxation est. · year 1
- Rental income
- $36,872
- − Mortgage interest
- −$55,735
- − Property taxes
- −$6,867
- − Insurance
- −$4,975
- − Repairs & maintenance
- −$2,950
- − Management
- −$2,950
- − HOA
- −$1,680
- − Depreciation
- −$28,945
- Taxable loss
- −$67,230
- Est. tax savings @ 24.0%
- +$16,135
- After-tax cash flow
- $-30,872/yr
For passive investors: Depreciation is non-cash, so a rental often shows a tax loss while cash-flowing — sheltering income. Rental losses are passive: they offset passive income freely, and up to $25,000/yr can offset ordinary (W-2) income if you actively participate and your MAGI is under $100k (phasing out to $0 by $150k); unused losses carry forward. On sale, claimed depreciation is recaptured at up to 25%, and gains may owe capital-gains tax (a 1031 exchange can defer both). Figures are a year-1 estimate at your 24.0% rate — not tax advice; consult a CPA.
Schools (NCES district)
- District
- Blaine School District
- NCES district ID
- 5300570
- Math proficiency
- 49% ▼ -1.00%
- Reading proficiency
- 55% ▼ -2.00%
- Median HH income
- $57,085
- Composite
- 47.05/100
- National rank
- #5128
- State rank
- #120 of 291 in WA
Livability — Blaine
- Score
- 78/100
- State rank
- #125
- US rank
- #2491
Category grades
Schools grade is shown separately in the Schools card above.
Census & demographics
- Census place
- Blaine, WA
- County
- Whatcom County · 209,776 people
- Metro
- Bellingham, WA
- Population (ZIP)
- 18,744
- Household income
- $86,623
- Rent vs Own
- Severe rent burden
- 454.0
Population outlook (Whatcom County) Hauer SSP2
- Today (2025)
- 240,408 people
- By 2030
- 254,667 · +5.9%
- By 2040
- 281,365 · +17.0%
- By 2050
- 307,592 · +27.9%
- By 2075
- 375,576 · +56.2%
- By 2100
- 421,637 · +75.4%
Race, ethnicity, and origin ACS 2023
- Neighborhood character
- Predominantly White (77%)
- Race & ethnicity
- White 77% Two or more races 11% Hispanic / Latino 9% Asian 3% Pacific Islander 2% Black 1%
- Hispanic origin (detail)
- Mexican 5%
- Common ancestry
- Portuguese 6% Iranian 4% Lithuanian 3%
- Foreign-born
- 13% · Canada, China
- Languages at home
- 89% English-only · Spanish 4% Russian/Polish/Slavic 1% Other Indo-European 1%
Political lean MEDSL · Whatcom
- 2024 margin
- Strong D (+24.9) · D 60.8% · R 35.9% · Other 3.3%
- 2008→2024 swing
- +6.9pp toward D · 2008: 18.0pp · 2024: 24.9pp
- All cycles
- 2024: D+24.9 2020: D+23.9 2016: D+17.7 2012: D+12.1 2008: D+18.0
Not yet ingested
- Civics
- —
Market trends
- HPI YoY
- ▲ 106.58%
- Current HPI
- 868.68
- Rent YoY
- ▲ 3.10%
- Metro
- Bellingham, WA
- State GDP YoY
- ▲ 4.65%
- F500 in state
- 22
Industry mix (Fortune 500 HQ in WA)
| Industry | F500 HQs | Revenue |
|---|---|---|
| Retail | 2 | $269B |
|
||
| Technology / Retail | 1 | $638B |
|
||
| Technology | 1 | $245B |
|
||
| Telecommunications | 1 | $38B |
|
||
| Food / Beverage | 1 | $36B |
|
||
| Automotive / Trucks | 1 | $34B |
|
||
Price history
+796.4% since first listed12 events — show timeline
- 2026-04-27 Price Changed $995,000 NWMLS as Distributed by MLS Grid
- 2026-04-14 Relisted — NWMLS as Distributed by MLS Grid
- 2026-04-02 Pending — NWMLS as Distributed by MLS Grid
- 2026-03-13 Listed $1,025,000 NWMLS as Distributed by MLS Grid
- 2022-06-14 Sold (MLS) $674,150 NWMLS as Distributed by MLS Grid
- 2022-05-21 Pending — NWMLS as Distributed by MLS Grid
- 2020-12-01 Relisted — NWMLS as Distributed by MLS Grid
- 2020-11-30 Pending — NWMLS as Distributed by MLS Grid
- 2020-11-30 Price Changed $699,000 NWMLS as Distributed by MLS Grid
- 2020-10-14 Listed $739,000 NWMLS as Distributed by MLS Grid
- 2003-08-26 Sold (Public Records) $401,911 Public Records
- 1990-01-24 Sold (Public Records) $111,000 Public Records
Property tax history
+1.3%/yrLatest (2026): $6,867 · +1.4% YoY. Source: county tax records.
Cash-flow waterfall
monthlySold comps — $/sqft
last 12 mo · ≤1 miLoading sold comps…