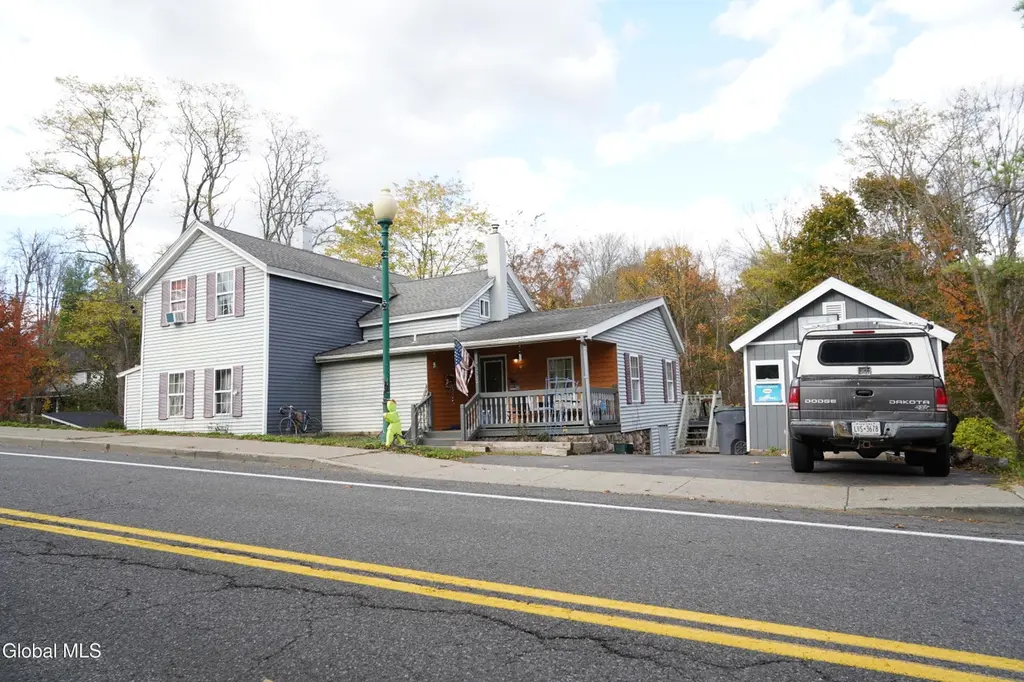
552 Mountain Ave · Cairo, NY
Flood risk 3/10 · Minor
- FEMA flood zone
- X (unshaded)
- Chance of flooding over 30 yrs
- 0.12%
- Est. flood insurance / yr
- $473 – $860
Fire risk 4/10 · Minor
- Est. fire insurance / yr
- $691 – $1,283
Heat risk 3/10 · Minor
- Hot days now (above 96°F)
- 7 days/yr
- Hot days in 30 yrs
- 16 days/yr
Wind risk 3/10 · Minor
- Chance of severe wind over 30 yrs
- 5.0%
Air-quality risk 2/10 · Minimal
- Unhealthy air days now
- 0 days/yr
- Unhealthy air days in 30 yrs
- 1 days/yr
Risk factors via First Street. Map © Google.
Why this score? — see what drove the D grade
The composite is a weighted blend of 9 inputs, each scored 0–100. Each bar is that input's sub-score; the figure is the points it added to the 100-point composite (weight × sub-score).
- ARV discount +15.0/15.0
- Appreciation +10.0/10.0
- Cash flow +4.0/30.0
- Schools +3.8/10.0
- Livability +3.2/5.0
- Rent growth +2.5/5.0
- Condition / age +2.5/5.0
- 1% rule +0.7/10.0
- DSCR +0.0/10.0
$275,000
🖨 Deal sheet 📄 Offer letter ✓ Due diligence
Listing remarks MLS
Welcome to this comfortable 3 bedroom 2 bath home located in the quiet area of Cairo, NY. The property offers a peaceful setting. The home has a nice yard, private driveway and plenty of room for everyday living. Enjoy easy access to nearby towns, as well as outdoor activities in the Catskill mountains.
Key facts
- Private driveway
- Peaceful setting
- Nice yard
Tags
Neighborhood map
What this means for you Summary
Snapshot
- This is a 3-bed/2.0-bath single-family listed at $275k.
Deal economics
- At list price, monthly cash flow is $-766 ($-9k/yr) — negative.
- To cash-flow at today's rent, offer at most $140k (49.2% below list).
- To meet the 1% rule (rent ≥ 1% of price), the offer needs to be $157k (42.8% below list).
- Recommended offer: $140k (49.2% below list) — sets the bar for cash-flow.
Location & tenants
- Location reads 64/100 on livability (#755 in NY) — a middle-class / working-renter tenant base. Strengths: crime A+, housing A+, cost of living B+; Watch: schools D-, amenities F, commute F.
- Cairo-Durham Central School District (rural): math 41% / reading 48% proficiency, ranked #470 of 590 in NY (top 80%) — families likely to look elsewhere, expect single-tenant / working-renter base with shorter leases.
- Market conditions: 62 active listings in the ZIP; 97 units permitted in Greene County in 2024 (0 in 5+ unit buildings).
Forward outlook
- In year one you build about $29k of equity ($2k loan paydown + $28k appreciation (10.0% local appreciation)).
- Greene County population projected at -22% by 2050 — secular population decline; favor cash flow + early exit over multi-decade hold.
- By year 2, paydown + projected appreciation supports a ~$47k cash-out refi (75% LTV) — recoverable capital for the next deal without selling this one.
Negotiation context
- It's been on market 236 days — a 12% lower offer ($242k) is reasonable based on typical stale-listing flexibility.
- Current owner paid $187k; 47% above their basis — modest negotiation headroom, anchor on the comps not their cost.
Risks & watch-outs
- Watch-outs: built in 1945 — expect roof / HVAC / electrical / plumbing capex.
Questions for the listing agent
- What do current leases actually rent for vs. the listed asking? Can we see a recent rent roll and the last 12 months of T-12 income?
- It's been on market 236 days. Have you received any prior offers? Is the seller open to a 49% concession, seller financing, or rate buy-down credit?
- Built in 1945 — when were the roof, HVAC, electrical panel, plumbing, and water heater last replaced?
- Why hasn't it sold? Are there any deal-killer items the seller is aware of (foundation, flood, title, zoning, code violations)?
- Is there a deadline driving the sale (1031 exchange, divorce, estate, relocation)? That informs how much negotiation room exists.
- Schools are D-rated, which usually means shorter tenancies and higher turnover. Who's the typical renter profile here, and what's been the actual vacancy rate?
- The area grade is low — what's the realistic commute time and amenity access for the typical tenant pool here? Any planned neighborhood developments (good or bad) we should know about?
- What's the average days-on-market for RENTAL listings here right now (not sales)? A rising rental-DOM trend means longer vacancies and softer asking-rent achievability than the comps imply.
- What's the recent tenant-quality profile in this submarket — average credit score on applications, eviction rate, late-payment / NSF rate, and stable-employment percentage? A property-management company in the area should have these aggregated.
- How much new for-sale + rental construction is in the pipeline within 1–3 miles? Heavy new supply typically softens prices + rents 12–24 months out; constrained supply supports both.
Investment metrics
- 1% rule
- 0.57% ✗
- Cap rate
- 2.95%
- Cash-on-cash
- -11.93%
- DSCR
- 0.47
- GRM
- 14.6
CMA / ARV
- ARV (median comp)
- $370,903
- List price
- $275,000
- Delta
- -25.86%
- Verdict
- UNDERPRICED
- Comps
- 17 within 1.0 mi
Show comp detail 4 sales within ~0.75 mi
| Address | Dist | Beds/Ba | Sqft | Sold | Price | $/sf | Match |
|---|---|---|---|---|---|---|---|
| 549 Mountain Ave | 0.03mi | 4/2.0 (+1) | 1,742 (+5%) | 21mo | $610,000 | $350 | 68 |
| 20 Olivers Way | 0.73mi | 3/2.0 | 1,700 (+3%) | 2mo | $429,000 | $252 | 60 |
| 275 Mountain Ave | 0.55mi | 2/1.5 (-1) | 1,788 (+8%) | 7mo | $465,000 | $260 | 48 |
| 251 Vernal Butler Rd | 0.62mi | 3/2.0 | 1,860 (+12%) | 18mo | $300,000 | $161 | 35 |
Match score weights: distance 35% · size 25% · config 20% · recency 20%. Top-matched comps best support the ARV.
Projected returns pro-forma
10.0% appreciation · 3.0% rent growth · sell at horizon
- IRR
- 16.0%
- Equity multiple
- 2.31×
- Total profit
- $101,093
- Equity at exit
- $247,742
- IRR
- 15.4%
- Equity multiple
- 5.37×
- Total profit
- $336,231
- Equity at exit
- $534,265
Cash invested: $77,000 (down + closing). Projections, not guarantees.
Landlord ↔ Tenant lean methodology
- Overall (STATE)
- 15 Strongly Tenant-Friendly
- State New York
- 15 Strongly Tenant-Friendly · D+10
- County
- — inherits STATE
- City
- — inherits STATE
ZIP-level market 12413
- Active inventory
- 62
- Price-to-rent
- 14.6×
Monthly cashflow live
- Estimated rent
- $1,572 medium interval (Pro) →
- Mortgage (P&I)
- −$1,442
- Tax from tax record
- −$451 /mo · $5,411/yr
- Insurance
- −$115
- HOA
- −$0
- Vacancy / Maint / Mgmt
- −$330
- Net cashflow
- $-766
Break-even live
UW: 25.0% down · 7.5% · 30yr · 1.5% tax · 5.0% vac · 8.0% maint · 8.0% mgmt
Financing live
Cash to close
- Down payment
- $68,750
- Closing costs
- $8,250
- Reserves months
- —
- Total cash needed
- —
Loan-product check · same deal, 3 products live
Conventional
25% down · 7.5% · 30yr
- Down + closing
- —
- Monthly P&I
- —
- Monthly cashflow
- —
- DSCR
- —
- Eligible?
- —
Personal DTI + credit; lowest rate.
DSCR
20% down · 8.5% · 30yr
- Down + closing
- —
- Monthly P&I
- —
- Monthly cashflow
- —
- DSCR
- —
- Eligible?
- —
No personal income docs; deal must DSCR.
Hard money
10% down · 12.0% · 12mo
- Down + closing
- —
- Monthly P&I
- —
- Monthly cashflow
- —
- DSCR
- —
- Eligible?
- —
Short-term bridge; refi at stabilization.
Listing history 17 events
-
2026-06-18days on market $275,000 Active 236 DOM
-
2026-06-17days on market $275,000 Active 235 DOM
-
2026-06-16days on market $275,000 Active 234 DOM
-
2026-06-15days on market $275,000 Active 233 DOM
-
2026-06-14days on market $275,000 Active 231 DOM
-
2026-06-10days on market $275,000 Active 228 DOM
-
2026-06-09days on market $275,000 Active 227 DOM
-
2026-06-08days on market $275,000 Active 226 DOM
-
2026-06-07days on market $275,000 Active 225 DOM
-
2026-06-05days on market $275,000 Active 222 DOM
-
2026-06-03days on market $275,000 Active 221 DOM
-
2026-06-02days on market $275,000 Active 220 DOM
-
2026-06-01days on market $275,000 Active 219 DOM
-
2026-05-31days on market $275,000 Active 218 DOM
-
2026-05-31days on market $275,000 Active 217 DOM
-
2025-10-24$275,000 Active 304-char remark
Show marketing remark (304 chars)
Welcome to this comfortable 3 bedroom 2 bath home located in the quiet area of Cairo, NY. The property offers a peaceful setting. The home has a nice yard, private driveway and plenty of room for everyday living. Enjoy easy access to nearby towns, as well as outdoor activities in the Catskill mountains.
-
2006-07-25soldstatus $187,460
ⓘ Source: listings_history table (triggers on properties + properties_extension) + one-shot
backfill from property_details.listing_events for pre-trigger history.
Tax reassessment forecast NY · Partial reset (capped growth)
- Current annual tax
- $5,411 · $451/mo
- Projected year-2 tax
- $5,411 · $451/mo
- Expected delta
- $0/yr ($0/mo · 0.0%)
ⓘ Screening estimate from a state-policy table — verify with the county assessor before closing.
Climate risk First Street
- Flood 3/10 Moderate FEMA zone X (unshaded) · 12% chance over 30 yrs
- Wildfire 4/10 Moderate
- Heat 3/10 Moderate 7 d/yr ≥96°F today · 16 d/yr by 30 yrs out
- Wind 3/10 Moderate 5% chance of damaging wind over 30 yrs
- Air quality 2/10 Low 0 unhealthy d/yr today · 1 by 30 yrs out
Nearby sold comps map
Loading sold comps map…
Walkable amenities ~0.75 mi
Loading nearby amenities…
Taxation est. · year 1
- Rental income
- $18,864
- − Mortgage interest
- −$15,404
- − Property taxes
- −$5,411
- − Insurance
- −$1,375
- − Repairs & maintenance
- −$1,509
- − Management
- −$1,509
- − Depreciation
- −$8,000
- Taxable loss
- −$14,344
- Est. tax savings @ 24.0%
- +$3,443
- After-tax cash flow
- $-5,746/yr
For passive investors: Depreciation is non-cash, so a rental often shows a tax loss while cash-flowing — sheltering income. Rental losses are passive: they offset passive income freely, and up to $25,000/yr can offset ordinary (W-2) income if you actively participate and your MAGI is under $100k (phasing out to $0 by $150k); unused losses carry forward. On sale, claimed depreciation is recaptured at up to 25%, and gains may owe capital-gains tax (a 1031 exchange can defer both). Figures are a year-1 estimate at your 24.0% rate — not tax advice; consult a CPA.
Schools (NCES district)
- District
- Cairo-Durham Central School District
- NCES district ID
- 3606160
- Math proficiency
- 41% ▼ -3.00%
- Reading proficiency
- 48% ▲ 8.00%
- Median HH income
- $46,192
- Composite
- 37.84/100
- National rank
- #4330
- State rank
- #470 of 590 in NY
Livability — Cairo
- Score
- 64/100
- State rank
- #755
- US rank
- #14433
Category grades
Schools grade is shown separately in the Schools card above.
Census & demographics
- City population
- 3,406
- Population (ZIP)
- 3,406
Population outlook (Greene County) Hauer SSP2
- Today (2025)
- 44,963 people
- By 2030
- 43,126 · -4.1%
- By 2040
- 38,756 · -13.8%
- By 2050
- 34,913 · -22.4%
- By 2075
- 28,156 · -37.4%
- By 2100
- 22,296 · -50.4%
Race, ethnicity, and origin ACS 2023
- Neighborhood character
- Predominantly White (91%)
- Race & ethnicity
- White 91% Two or more races 7% Hispanic / Latino 6%
- Hispanic origin (detail)
- Puerto Rican 5%
- Common ancestry
- Iranian 4% Romanian 4% Slovak 1%
- Foreign-born
- 2% · Canada
- Languages at home
- 94% English-only · Spanish 4% Other Indo-European 2%
Political lean MEDSL · Greene
- 2024 margin
- R (+17.0) · D 41.5% · R 58.5%
- 2008→2024 swing
- -7.1pp toward R · 2008: -9.9pp · 2024: -17.0pp
- All cycles
- 2024: R+17.0 2020: R+15.6 2016: R+27.4 2012: R+11.1 2008: R+9.9
Not yet ingested
- Civics
- —
Market trends
- HPI YoY
- ▲ 140.58%
- Current HPI
- 406.4299
- Rent YoY
- —
- Metro
- —
- State GDP YoY
- ▲ 2.60%
- F500 in state
- 92
Industry mix (Fortune 500 HQ in NY)
| Industry | F500 HQs | Revenue |
|---|---|---|
| Financial Services | 10 | $950B |
|
||
| Consumer Goods | 9 | $162B |
|
||
| Insurance | 4 | $225B |
|
||
| Telecommunications | 2 | $144B |
|
||
| Pharmaceuticals | 2 | $112B |
|
||
| Media / Entertainment | 2 | $69B |
|
||
Price history
+46.7% since first listed2 events — show timeline
- 2025-10-24 Listed $275,000 Global MLS
- 2006-07-25 Sold (Public Records) $187,460 Public Records
Property tax history
+2.3%/yrLatest (2025): $5,411 · +4.4% YoY. Source: county tax records.
Cash-flow waterfall
monthlySold comps — $/sqft
last 12 mo · ≤1 miLoading sold comps…