1221 Fairfax Ave · Deale, MD
Flood risk 6/10 · Moderate
- FEMA flood zone
- X (unshaded)
- Chance of flooding over 30 yrs
- 0.57%
- Est. flood insurance / yr
- $507 – $1,088
Fire risk 1/10 · Minimal
- Est. fire insurance / yr
- $755 – $1,403
Heat risk 8/10 · Major
- Hot days now (above 104°F)
- 7 days/yr
- Hot days in 30 yrs
- 16 days/yr
Wind risk 6/10 · Moderate
- Chance of severe wind over 30 yrs
- 72.0%
Air-quality risk 3/10 · Minor
- Unhealthy air days now
- 3 days/yr
- Unhealthy air days in 30 yrs
- 3 days/yr
Risk factors via First Street. Map © Google.
Why this score? — see what drove the D- grade
The composite is a weighted blend of 9 inputs, each scored 0–100. Each bar is that input's sub-score; the figure is the points it added to the 100-point composite (weight × sub-score).
- Appreciation +8.6/10.0
- Cash flow +8.5/30.0
- ARV discount +3.6/15.0
- Livability +3.5/5.0
- Schools +2.9/10.0
- Rent growth +2.5/5.0
- Condition / age +2.5/5.0
- DSCR +2.3/10.0
- 1% rule +1.8/10.0
$460,000
🖨 Deal sheet 📄 Offer letter ✓ Due diligence
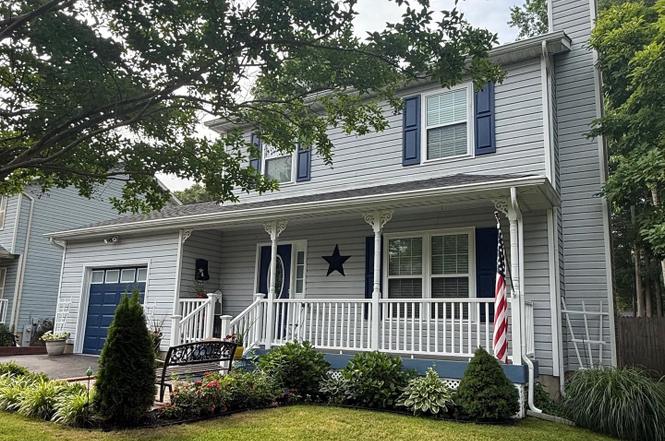
Listing remarks
Professional Photos coming soon! One of the larger lots in the neighborhood. Wait until you see the backyard oasis! Recent updates include the roof, windows, doors, & water heater. Primary suite with a vaulted ceiling. Garage is insulated and has a split unit for additional comfort. Shows well & turn key ready! This one is worth the wait!
Key facts
- Insulated garage
- Recent updates
- Split unit
Tags
Property features AI
Finance
- Other: Fee simple ownership; Property listed in excellent condition; Above-grade finished area reported by assessor
Exterior
- Parking: Front-entry attached garage with inside access (1 garage space); Paved driveway with about 3 driveway spaces; Total of 4 garage/parking spaces
- Utilities: Public sewer; Well water; Electric utilities
- Home design: Detached single-family home; Situated outside city limits
- Construction: Vinyl siding; Crawl space foundation
- Exterior features: Private beach access; Rear yard with fencing; Property backs to trees; Landscaped, premium lot; Water access to a bay (canoe/kayak, fishing, powered boats, PWC, swimming) with private access
Interior
- Kitchen: Eat-in kitchen with table space; Upgraded countertops
- Bedrooms: Three bedrooms on the upper level
- Bathrooms: Two full bathrooms (all upper levels); One half bathroom on the main level
- Heating & cooling: Heat pump heating; Central air conditioning with ceiling fans; Electric hot water
- Interior features: Open floor plan with dining area; Family room off the kitchen; Eat-in kitchen with table space; Master bathroom; Upgraded countertops; Wood-burning fireplace (1)
Neighborhood map
What this means for you Summary
Snapshot
- This is a 3-bed/2.0-bath single-family listed at $460k.
Deal economics
- At list price, monthly cash flow is $-403 ($-5k/yr) — negative.
- To cash-flow at today's rent, offer at most $389k (15.5% below list).
- To meet the 1% rule (rent ≥ 1% of price), the offer needs to be $315k (31.5% below list).
- Recommended offer: $315k (31.5% below list) — sets the bar for 1% rule.
- Cap rate 5.2% vs local median 2.3% in Deale — top-decile yield for the area; either an underpriced asset or a hidden risk that comps aren't pricing in. Stress-test before assuming the spread holds.
Location & tenants
- Location reads 70/100 on livability (#166 in MD) — a middle-class / working-renter tenant base. Strengths: employment A+, housing A+, crime B+; Watch: health & safety C-, amenities F, commute F.
- Anne Arundel County Public Schools (suburban): math 20% / reading 37% proficiency, ranked #10 of 24 in MD (top 42%) — low school quality limits family demand, transient renter base, plan for 1-2y turnover.
- Market conditions: 10 active listings in the ZIP; 2 comparable units currently listed for rent nearby; 1,303 units permitted in Anne Arundel County in 2024 (299 in 5+ unit buildings).
Forward outlook
- In year one you build about $36k of equity ($3k loan paydown + $33k appreciation (7.1% local appreciation)).
- Anne Arundel County population projected at +17% by 2050 — long-run rental-demand tailwind backs the buy-and-hold thesis.
- By year 2, paydown + projected appreciation supports a ~$58k cash-out refi (75% LTV) — recoverable capital for the next deal without selling this one.
Negotiation context
- Only 8 days on market — expect competitive offers; lowballing is unlikely to land.
- 2 sale attempts since 23y ago; this cycle's ask is 114% above the opening price — seller raised mid-cycle; expect resistance to lowballs.
- Current owner paid $215k; list at $460k implies a 114% gain — meaningful room to come down on a strong offer.
Risks & watch-outs
- Climate carrying-cost: major flood risk; major wind risk, 72% chance of damaging wind over 30y; extreme-heat days projected 7→16/yr by 2055 (HVAC capex compounding) — expect insurance premiums to compound above CPI over the hold.
Questions for the listing agent
- What do current leases actually rent for vs. the listed asking? Can we see a recent rent roll and the last 12 months of T-12 income?
- Is there a deadline driving the sale (1031 exchange, divorce, estate, relocation)? That informs how much negotiation room exists.
- Schools are B-rated — typically a magnet for longer-tenancy family renters. What's the average tenant stay here, and is there a school-zone premium baked into asking?
- The area grade is low — what's the realistic commute time and amenity access for the typical tenant pool here? Any planned neighborhood developments (good or bad) we should know about?
- What's the average days-on-market for RENTAL listings here right now (not sales)? A rising rental-DOM trend means longer vacancies and softer asking-rent achievability than the comps imply.
- What's the recent tenant-quality profile in this submarket — average credit score on applications, eviction rate, late-payment / NSF rate, and stable-employment percentage? A property-management company in the area should have these aggregated.
- How much new for-sale + rental construction is in the pipeline within 1–3 miles? Heavy new supply typically softens prices + rents 12–24 months out; constrained supply supports both.
Investment metrics
- 1% rule
- 0.68% ✗
- Cap rate
- 5.24%
- Cash-on-cash
- -3.76%
- DSCR
- 0.83
- GRM
- 12.2
CMA / ARV
- ARV (on-the-fly)
- $423,360
- Comps found
- 12
Show comp detail 12 sales within ~0.75 mi
| Address | Dist | Beds/Ba | Sqft | Sold | Price | $/sf | Match |
|---|---|---|---|---|---|---|---|
| 5515 Calvert St | 0.15mi | 3/2.0 | 1,340 (-0%) | 6mo | $419,000 | $313 | 87 |
| 1203 Gwynne Ave | 0.12mi | 3/2.5 | 1,440 (+7%) | 9mo | $394,000 | $274 | 73 |
| 5511 Dartmouth St | 0.17mi | 3/2.0 | 1,400 (+4%) | 18mo | $405,000 | $289 | 70 |
| 1215 Garret Ave | 0.05mi | 4/2.0 (+1) | 1,540 (+15%) | 4mo | $400,000 | $260 | 65 |
| 1111 Wildwood Ln | 0.42mi | 3/2.0 | 1,252 (-7%) | 9mo | $395,000 | $315 | 62 |
| 5510 Dartmouth St | 0.16mi | 3/1.0 | 1,202 (-11%) | 13mo | $395,000 | $329 | 60 |
| 5543 Dartmouth St | 0.06mi | 4/3.0 (+1) | 1,528 (+14%) | 7mo | $450,000 | $295 | 59 |
| 5553 Harford St | 0.44mi | 2/1.5 (-1) | 1,397 (+4%) | 10mo | $619,000 | $443 | 58 |
| 5535 Gloucester St | 0.36mi | 3/1.5 | 1,152 (-14%) | 4mo | $375,000 | $326 | 54 |
| 5603 Essex St | 0.24mi | 3/3.0 | 1,538 (+14%) | 8mo | $416,000 | $270 | 54 |
| 5708 Bay View Pkwy | 0.58mi | 2/2.0 (-1) | 1,288 (-4%) | 11mo | $434,000 | $337 | 52 |
| 5560 Harford St | 0.44mi | 2/2.0 (-1) | 1,180 (-12%) | 8mo | $410,000 | $347 | 47 |
Match score weights: distance 35% · size 25% · config 20% · recency 20%. Top-matched comps best support the ARV.
Projected returns pro-forma
7.13% appreciation · 3.0% rent growth · sell at horizon
- IRR
- 15.1%
- Equity multiple
- 2.08×
- Total profit
- $138,499
- Equity at exit
- $322,672
- IRR
- 15.0%
- Equity multiple
- 4.27×
- Total profit
- $421,169
- Equity at exit
- $616,501
Cash invested: $128,800 (down + closing). Projections, not guarantees.
Landlord ↔ Tenant lean methodology
- Overall (STATE)
- 27 Tenant-Leaning
- State Maryland
- 27 Tenant-Leaning · D+14
- County
- — inherits STATE
- City
- — inherits STATE
ZIP-level market 20733
- Home prices YoY
- 1.4%
- Active inventory
- 10
- Price-to-rent
- 12.2×
Monthly cashflow live
- Estimated rent
- $3,151 medium interval (Pro) →
- Mortgage (P&I)
- −$2,412
- Tax from tax record
- −$288 /mo · $3,458/yr
- Insurance
- −$192
- HOA
- −$0
- Vacancy / Maint / Mgmt
- −$662
- Net cashflow
- $-403
Break-even live
UW: 25.0% down · 7.5% · 30yr · 1.5% tax · 5.0% vac · 8.0% maint · 8.0% mgmt
Financing live
Cash to close
- Down payment
- $115,000
- Closing costs
- $13,800
- Reserves months
- —
- Total cash needed
- —
Loan-product check · same deal, 3 products live
Conventional
25% down · 7.5% · 30yr
- Down + closing
- —
- Monthly P&I
- —
- Monthly cashflow
- —
- DSCR
- —
- Eligible?
- —
Personal DTI + credit; lowest rate.
DSCR
20% down · 8.5% · 30yr
- Down + closing
- —
- Monthly P&I
- —
- Monthly cashflow
- —
- DSCR
- —
- Eligible?
- —
No personal income docs; deal must DSCR.
Hard money
10% down · 12.0% · 12mo
- Down + closing
- —
- Monthly P&I
- —
- Monthly cashflow
- —
- DSCR
- —
- Eligible?
- —
Short-term bridge; refi at stabilization.
Rent comps 2 comps
| Address | Beds | Baths | Sqft | Rent | $/sqft | DOM | Units | Dist |
|---|---|---|---|---|---|---|---|---|
| 1239 Fairfax Ave Churchton, MD | 4.0 | 3.0 | 1688 | $3,200 | $1.90 | 13d | 1 | 0.14mi |
| 1345 Ellicott Ave Churchton, MD | 2.0 | 2.0 | 1364 | $2,999 | $2.20 | 43d | 1 | 0.53mi |
Listing history 6 events
-
2026-06-18days on market $460,000 Coming Soon 8 DOM
-
2026-06-17days on market $460,000 Coming Soon 7 DOM
-
2026-06-16days on market $460,000 Coming Soon 6 DOM
-
2026-06-15days on market $460,000 Coming Soon 5 DOM
-
2026-06-13remarks 343-char remark
-
2026-06-13$460,000 Coming Soon 3 DOM
ⓘ Source: listings_history table (triggers on properties + properties_extension) + one-shot
backfill from property_details.listing_events for pre-trigger history.
Tax reassessment forecast MD · Partial reset (capped growth)
- Current annual tax
- $3,458 · $288/mo
- Projected year-2 tax
- $4,236 · $353/mo
- Expected delta
- +$778/yr (+$65/mo · 22.5%)
ⓘ Screening estimate from a state-policy table — verify with the county assessor before closing.
Climate risk First Street
- Flood 6/10 Major FEMA zone X (unshaded) · 57% chance over 30 yrs
- Wildfire 1/10 Low
- Heat 8/10 Severe 7 d/yr ≥104°F today · 16 d/yr by 30 yrs out
- Wind 6/10 Major 72% chance of damaging wind over 30 yrs
- Air quality 3/10 Moderate 3 unhealthy d/yr today · 3 by 30 yrs out
Nearby sold comps map
Loading sold comps map…
Walkable amenities ~0.75 mi
Loading nearby amenities…
Taxation est. · year 1
- Rental income
- $37,808
- − Mortgage interest
- −$25,767
- − Property taxes
- −$3,458
- − Insurance
- −$2,300
- − Repairs & maintenance
- −$3,025
- − Management
- −$3,025
- − Depreciation
- −$13,382
- Taxable loss
- −$13,148
- Est. tax savings @ 24.0%
- +$3,156
- After-tax cash flow
- $-1,681/yr
For passive investors: Depreciation is non-cash, so a rental often shows a tax loss while cash-flowing — sheltering income. Rental losses are passive: they offset passive income freely, and up to $25,000/yr can offset ordinary (W-2) income if you actively participate and your MAGI is under $100k (phasing out to $0 by $150k); unused losses carry forward. On sale, claimed depreciation is recaptured at up to 25%, and gains may owe capital-gains tax (a 1031 exchange can defer both). Figures are a year-1 estimate at your 24.0% rate — not tax advice; consult a CPA.
Schools (NCES district)
- District
- Anne Arundel County Public Schools
- NCES district ID
- 2400060
- Math proficiency
- 20% ▼ -21.00%
- Reading proficiency
- 37% ▼ -13.00%
- Median HH income
- $87,880
- Composite
- 28.52/100
- National rank
- #6733
- State rank
- #10 of 24 in MD
Livability — Deale
- Score
- 70/100
- State rank
- #166
- US rank
- #7418
Category grades
Schools grade is shown separately in the Schools card above.
Census & demographics
- Census place
- Deale, MD
- City population
- 5,332
- Population (ZIP)
- 2,780
Population outlook (Anne Arundel County) Hauer SSP2
- Today (2025)
- 617,384 people
- By 2030
- 642,094 · +4.0%
- By 2040
- 686,621 · +11.2%
- By 2050
- 723,031 · +17.1%
- By 2075
- 809,346 · +31.1%
- By 2100
- 837,658 · +35.7%
Race, ethnicity, and origin ACS 2023
- Neighborhood character
- Predominantly White (88%)
- Race & ethnicity
- White 88% Black 6% Two or more races 5% Asian 1%
- Common ancestry
- Romanian 2% Italian 2% Slovak 1%
- Foreign-born
- 2% · China, Canada
- Languages at home
- 99% English-only · Spanish 1%
Political lean MEDSL · Anne Arundel
- 2024 margin
- D (+13.9) · D 55.7% · R 41.7% · Other 2.6%
- 2008→2024 swing
- +15.7pp toward D · 2008: -1.8pp · 2024: 13.9pp
- All cycles
- 2024: D+13.9 2020: D+14.5 2016: D+0.7 2012: R+0.9 2008: R+1.8
Not yet ingested
- Civics
- —
Market trends
- HPI YoY
- ▲ 7.13%
- Current HPI
- 517.59
- Rent YoY
- —
- Metro
- —
- State GDP YoY
- ▲ 2.97%
- F500 in state
- 12
Industry mix (Fortune 500 HQ in MD)
| Industry | F500 HQs | Revenue |
|---|---|---|
| Aerospace / Defense | 1 | $71B |
|
||
| Utilities | 1 | $25B |
|
||
| Hotels | 1 | $24B |
|
||
| Consumer Goods | 1 | $7B |
|
||
| Real Estate | 1 | $6B |
|
||
| Chemicals | 1 | $2B |
|
||
Price history
+1572.7% since first listed10 events — show timeline
- 2026-06-10 Coming Soon $460,000 BRIGHT MLS
- 2006-02-23 Delisted — MRIS
- 2006-02-10 Listed — MRIS
- 2003-09-16 Sold (Public Records) $215,000 Public Records
- 2003-07-30 Sold (MLS) $215,000 MRIS
- 2003-06-14 Delisted — MRIS
- 2003-06-12 Listed $215,000 MRIS
- 1996-06-21 Sold (Public Records) $133,900 Public Records
- 1991-08-27 Sold (Public Records) $127,750 Public Records
- 1991-03-08 Sold (Public Records) $27,500 Public Records
Property tax history
+4.0%/yrLatest (2025): $3,458 · +2.1% YoY. Source: county tax records.
Cash-flow waterfall
monthlySold comps — $/sqft
last 12 mo · ≤1 miLoading sold comps…