 Multi-family
660 Watt Nantz Rd · East Bernstadt, KY
Flood risk 1/10 · Minimal
- FEMA flood zone
- X (unshaded)
- Chance of flooding over 30 yrs
- 0.0%
- Est. flood insurance / yr
- $507 – $1,088
Fire risk 9/10 · Severe
- Est. fire insurance / yr
- $839 – $1,559
Heat risk 3/10 · Minor
- Hot days now (above 99°F)
- 7 days/yr
- Hot days in 30 yrs
- 20 days/yr
Wind risk 2/10 · Minimal
- Chance of severe wind over 30 yrs
- 3.0%
Air-quality risk 1/10 · Minimal
- Unhealthy air days now
- 0 days/yr
- Unhealthy air days in 30 yrs
- 0 days/yr
Risk factors via First Street. Map © Google.
Why this score? — see what drove the C+ grade
The composite is a weighted blend of 9 inputs, each scored 0–100. Each bar is that input's sub-score; the figure is the points it added to the 100-point composite (weight × sub-score).
- Cash flow +22.6/30.0
- Appreciation +8.9/10.0
- ARV discount +7.5/15.0
- DSCR +7.3/10.0
- 1% rule +5.9/10.0
- Schools +4.4/10.0
- Livability +2.9/5.0
- Rent growth +2.5/5.0
- Condition / age +1.0/5.0
$250,000
🖨 Deal sheet (PDF) 📄 Offer letter ✓ Due diligence
Multi-family units
County records classify this as Multi-Family (2-4 Unit). Listing-text estimate: 1 unit. estimate disagrees with records
Listing remarks MLS
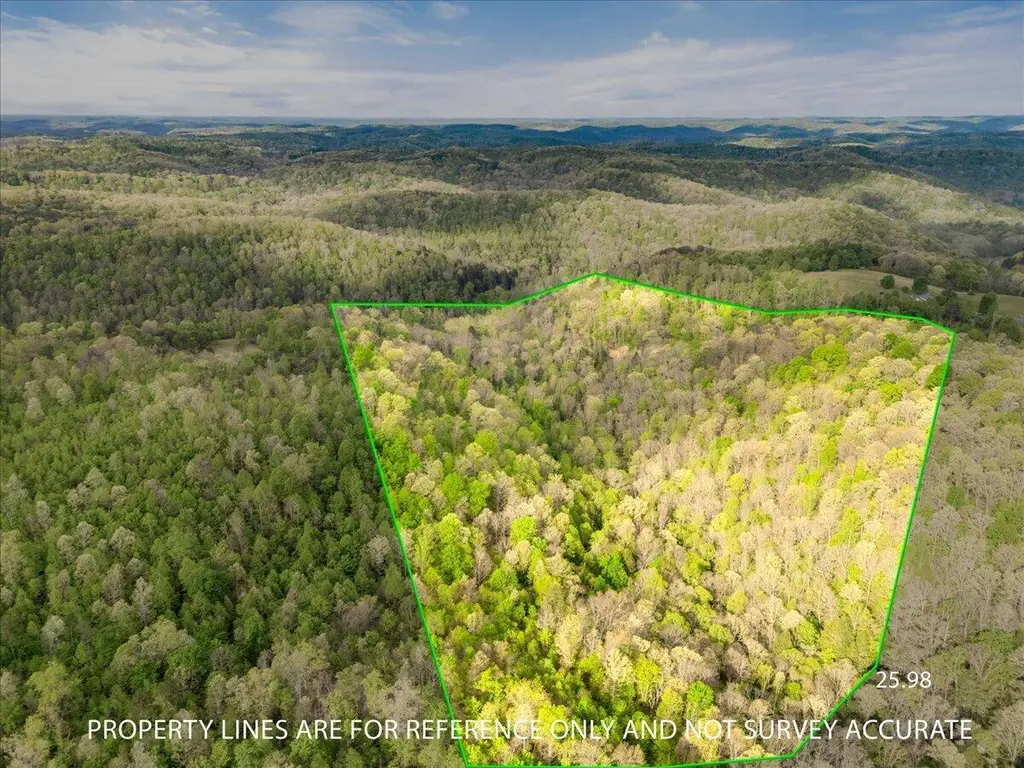
15.8 acres of unrestricted land that is ready for a new owner. This property is mostly wooded and offers some flat and rolling land. There are many homesites or great opportunities for hunting. Much of the land could be cleared and a mini farm created. This is a great opportunity and there is more land available and tracts that can be purchased with this one. Call today to see this property.
Key facts
- Short term rentals
- Layout of the land
- Rental units
Tags
Property features AI
Finance
- Other: Parcel number 003-00-00-032.00
Exterior
- Parking: Gravel parking
- Home design: Other structure type; Total building area about 3,120 square feet
- Construction: Metal roof
- Exterior features: Metal roof; Approximately 2.6 acres of land
Interior
- Bathrooms: 3 full bathrooms
- Heating & cooling: Ductless heating; Ductless cooling
- Interior features: Ductless heating and cooling
Neighborhood map
What this means for you Summary
Snapshot
- This is a 3-bed/3.0-bath multifamily listed at $250k. Condition is rated poor.
Deal economics
- At list price, monthly cash flow is $427 ($5k/yr) — positive.
- The deal already cash-flows at list — no discount required.
- Meets the 1% rule at list price ($3k rent vs $250k).
- Recommended offer: $242k (3.0% below list) — sets the bar for market timing.
- Cap rate 8.3% vs local median 1.9% in East Bernstadt — top-decile yield for the area; either an underpriced asset or a hidden risk that comps aren't pricing in. Stress-test before assuming the spread holds.
Location & tenants
- Location reads 58/100 on livability (#432 in KY) — a working-class tenant base; expect higher turnover. Strengths: cost of living A+; Watch: amenities F, commute F, employment F.
- Laurel County (town): math 51% / reading 56% proficiency, ranked #8 of 165 in KY (top 5%) — acceptable for families but not a draw, mixed tenant base, ~2y average lease.
- Zoned schools: Hazel Green Elementary School (math 52% / reading 62%, grade C+, #47 of 676 statewide, top 8%, 344 students, 80% FRL); North Laurel Middle School (math 48% / reading 59%, grade C+, #13 of 217 statewide, top 6%, 1,003 students, 64% FRL); North Laurel High School (math 37% / reading 42%, grade F, #40 of 254 statewide, top 19%, 1,300 students, 58% FRL).
- Market conditions: 143 active listings in the ZIP; 16 units permitted in Laurel County in 2024 (0 in 5+ unit buildings).
Forward outlook
- In year one you build about $21k of equity ($2k loan paydown + $20k appreciation (7.8% local appreciation)).
- At projected returns (7.8% appreciation + 3.0% rent growth), your $70k cash investment doubles in ~3 years — after that, you're playing with house money.
- By year 2, paydown + projected appreciation supports a ~$34k cash-out refi (75% LTV) — recoverable capital for the next deal without selling this one.
Negotiation context
- It's been on market 45 days — a 3% lower offer ($242k) is reasonable based on typical stale-listing flexibility.
- 5 sale attempts; this cycle's ask is 216% above the opening price — seller raised mid-cycle; expect resistance to lowballs.
Risks & watch-outs
- Climate carrying-cost: severe wildfire risk — expect insurance premiums to compound above CPI over the hold.
Questions for the listing agent
- It's been on market 45 days. Have you received any prior offers? Is the seller open to a 3% concession, seller financing, or rate buy-down credit?
- Have any recent inspections been done? Can we get a copy of the seller's disclosures and any deferred-maintenance estimates?
- Is there a deadline driving the sale (1031 exchange, divorce, estate, relocation)? That informs how much negotiation room exists.
- What's the average days-on-market for RENTAL listings here right now (not sales)? A rising rental-DOM trend means longer vacancies and softer asking-rent achievability than the comps imply.
- What's the recent tenant-quality profile in this submarket — average credit score on applications, eviction rate, late-payment / NSF rate, and stable-employment percentage? A property-management company in the area should have these aggregated.
- How much new apartment / multifamily construction is in the pipeline within 1–3 miles? Heavy new supply (>2% of stock underway) typically softens rents 12–24 months out; light construction supports rent growth.
Investment metrics
- 1% rule
- 1.09% ✓
- Cap rate
- 8.34%
- Cash-on-cash
- 7.33%
- DSCR
- 1.33
- GRM
- 7.6
CMA / ARV
No comps found within radius.
Projected returns pro-forma
7.82% appreciation · 3.0% rent growth · sell at horizon
- IRR
- 25.3%
- Equity multiple
- 2.82×
- Total profit
- $127,355
- Equity at exit
- $186,851
- IRR
- 22.9%
- Equity multiple
- 5.99×
- Total profit
- $349,286
- Equity at exit
- $367,998
Cash invested: $70,000 (down + closing). Projections, not guarantees.
Landlord ↔ Tenant lean methodology
- Overall (STATE)
- 83 Strongly Landlord-Friendly
- State Kentucky
- 83 Strongly Landlord-Friendly · R+16
- County
- — inherits STATE
- City
- — inherits STATE
ZIP-level market 40729
- Home prices YoY
- 2.1%
- Active inventory
- 143
- Price-to-rent
- 22.9×
Monthly cashflow live
- Estimated rent
- $2,728 medium interval (Pro) →
- Mortgage (P&I)
- −$1,311
- Tax est. 1.5%
- −$312 /mo · $3,750/yr
- Insurance
- −$104
- HOA
- −$0
- Vacancy / Maint / Mgmt
- −$573
- Net cashflow
- $427
Break-even live
Sensitivity live
| Price | -10% $600 | -5% $514 | +0% $427 | +5% $341 | +10% $255 |
|---|---|---|---|---|---|
| Rent | -10% $212 | -5% $320 | +0% $427 | +5% $535 | +10% $643 |
| Rate | -1.0pp $553 | -0.5pp $491 | base $427 | +0.5pp $363 | +1.0pp $297 |
3-unit breakdown (identical units grouped — click to expand)
| Units | Beds | Baths | Est. rent |
|---|---|---|---|
| 3× units | 1 | 1 | $2,727 |
| #1 | 1 | 1 | $909 |
| #2 | 1 | 1 | $909 |
| #3 | 1 | 1 | $909 |
| Total (3 units) | $2,728 | ||
UW: 25.0% down · 7.5% · 30yr · 1.5% tax · 5.0% vac · 8.0% maint · 8.0% mgmt
Financing live
Cash to close
- Down payment
- $62,500
- Closing costs
- $7,500
- Reserves months
- —
- Total cash needed
- —
Loan-product check · same deal, 3 products live
Conventional
25% down · 7.5% · 30yr
- Down + closing
- —
- Monthly P&I
- —
- Monthly cashflow
- —
- DSCR
- —
- Eligible?
- —
Personal DTI + credit; lowest rate.
DSCR
20% down · 8.5% · 30yr
- Down + closing
- —
- Monthly P&I
- —
- Monthly cashflow
- —
- DSCR
- —
- Eligible?
- —
No personal income docs; deal must DSCR.
Hard money
10% down · 12.0% · 12mo
- Down + closing
- —
- Monthly P&I
- —
- Monthly cashflow
- —
- DSCR
- —
- Eligible?
- —
Short-term bridge; refi at stabilization.
Listing history 22 events
-
2026-06-22days on market $250,000 Active 45 DOM
-
2026-06-21days on market $250,000 Active 44 DOM
-
2026-06-21days on market $250,000 Active 43 DOM
-
2026-06-18days on market $250,000 Active 41 DOM
-
2026-06-17days on market $250,000 Active 40 DOM
-
2026-06-16days on market $250,000 Active 39 DOM
-
2026-06-15days on market $250,000 Active 38 DOM
-
2026-06-13days on market $250,000 Active 36 DOM
-
2026-06-12days on market $250,000 Active 35 DOM
-
2026-06-09days on market $250,000 Active 32 DOM
-
2026-06-08days on market $250,000 Active 31 DOM
-
2026-06-07days on market $250,000 Active 30 DOM
-
2026-06-07days on market $250,000 Active 29 DOM
-
2026-06-04days on market $250,000 Active 26 DOM
-
2026-06-02days on market $250,000 Active 25 DOM
-
2026-06-01days on market $250,000 Active 24 DOM
-
2026-05-31days on market $250,000 Active 23 DOM
-
2026-05-31days on market $250,000 Active 22 DOM
-
2026-05-11$129,900 Active 342-char remark
Show marketing remark (342 chars)
25.98 acres of unrestricted land that is just waiting to start living your dream. From building your dream home, farming or recreation this land has it all. With a mixture of field and fields gives you great variety. Property has been surveyed. Call today to schedule your tour. More tracks that surround this property are also available.
-
2026-05-08$139,900 Active 327-char remark
-
2026-05-08$118,300 Active
-
2026-05-07$250,000 Active
ⓘ Source: listings_history table (triggers on properties + properties_extension) + one-shot
backfill from property_details.listing_events for pre-trigger history.
Climate risk First Street
- Flood 1/10 Low FEMA zone X (unshaded) · 0% chance over 30 yrs
- Wildfire 9/10 Extreme
- Heat 3/10 Moderate 7 d/yr ≥99°F today · 20 d/yr by 30 yrs out
- Wind 2/10 Low 3% chance of damaging wind over 30 yrs
- Air quality 1/10 Low 0 unhealthy d/yr today · 0 by 30 yrs out
Nearby sold comps map
Loading sold comps map…
Walkable amenities ~0.75 mi
Loading nearby amenities…
Taxation est. · year 1
- Rental income
- $32,736
- − Mortgage interest
- −$14,004
- − Property taxes
- −$3,750
- − Insurance
- −$1,250
- − Repairs & maintenance
- −$2,619
- − Management
- −$2,619
- − Depreciation
- −$7,273
- Taxable income
- $1,222
- Est. tax owed @ 24.0%
- −$293
- After-tax cash flow
- $4,836/yr
For passive investors: Depreciation is non-cash, so a rental often shows a tax loss while cash-flowing — sheltering income. Rental losses are passive: they offset passive income freely, and up to $25,000/yr can offset ordinary (W-2) income if you actively participate and your MAGI is under $100k (phasing out to $0 by $150k); unused losses carry forward. On sale, claimed depreciation is recaptured at up to 25%, and gains may owe capital-gains tax (a 1031 exchange can defer both). Figures are a year-1 estimate at your 24.0% rate — not tax advice; consult a CPA.
Condition & rehab AI · 13 photos
This property is in a poor condition with no visible structures or systems. Extensive repairs and a clear title are needed to make it habitable and marketable.
Repairs flagged
- Major roof — No visible roof structure
- Major exterior — No visible exterior structure
- Major flooring — No visible flooring
- Major interior walls/paint — No visible interior walls
- Major HVAC/mechanicals — No visible HVAC/mechanicals
- Major landscaping/curb appeal — No visible landscaping/curb appeal
Value-add opportunities
- Both Clear title and survey — Ensures property boundaries and clear title
- Both Legal documentation — Ensures property boundaries and clear title
- Both Survey — Ensures property boundaries and clear title
Renovation cost estimate screening
| Repair item | Severity | Est. cost |
|---|---|---|
| roof · No visible roof structure | Major | $15,000–50,000 |
| exterior · No visible exterior structure | Major | $15,000–50,000 |
| flooring · No visible flooring | Major | $15,000–50,000 |
| interior walls/paint · No visible interior walls | Major | $15,000–50,000 |
| HVAC/mechanicals · No visible HVAC/mechanicals | Major | $15,000–50,000 |
| landscaping/curb appeal · No visible landscaping/curb appeal | Major | $15,000–50,000 |
| Total estimated repair cost · 6 items | $90,000–300,000 |
Value-add ROI direction
- Both Clear title and survey — Ensures property boundaries and clear title ↑
- Both Legal documentation — Ensures property boundaries and clear title ↑
- Both Survey — Ensures property boundaries and clear title ↑
ⓘ Cost ranges are severity-bucket heuristics (US national rule-of-thumb). Get contractor quotes + a written scope before underwriting a rehab budget.
Schools (NCES district)
- District
- Laurel County
- NCES district ID
- 2103210
- Math proficiency
- 51% ▼ -9.00%
- Reading proficiency
- 56% ▼ -11.00%
- Median HH income
- $36,577
- Composite
- 44.39/100
- National rank
- #2814
- State rank
- #8 of 165 in KY
Livability — East Bernstadt
- Score
- 58/100
- State rank
- #432
- US rank
- #21210
Category grades
Schools grade is shown separately in the Schools card above.
Census & demographics
- Population (ZIP)
- 6,090
Population outlook (Laurel County) Hauer SSP2
- Today (2025)
- 62,602 people
- By 2030
- 63,310 · +1.1%
- By 2040
- 63,706 · +1.8%
- By 2050
- 62,705 · +0.2%
- By 2075
- 58,574 · -6.4%
- By 2100
- 50,888 · -18.7%
Race, ethnicity, and origin ACS 2023
- Neighborhood character
- Predominantly White (94%)
- Race & ethnicity
- White 94% Hispanic / Latino 3% Two or more races 2%
- Common ancestry
- Slovak 1% Italian 1% Serbian 1%
- Foreign-born
- 0% · Canada
- Languages at home
- 98% English-only · Spanish 1% German/W. Germanic 1%
Political lean MEDSL · Laurel
- 2024 margin
- Solid R (+69.9) · D 14.5% · R 84.3% · Other 1.2%
- 2008→2024 swing
- -11.9pp toward R · 2008: -58.0pp · 2024: -69.9pp
- All cycles
- 2024: R+69.9 2020: R+66.7 2016: R+69.1 2012: R+63.6 2008: R+58.0
Not yet ingested
- Civics
- —
Market trends
- HPI YoY
- ▲ 7.82%
- Current HPI
- 385.9996
- Rent YoY
- —
- Metro
- —
- State GDP YoY
- ▲ 1.81%
- F500 in state
- 4
Industry mix (Fortune 500 HQ in KY)
| Industry | F500 HQs | Revenue |
|---|---|---|
| Healthcare | 1 | $118B |
|
||
| Food / Beverage | 1 | $7B |
|
||
Price history
-68.4% since first listed5 events — show timeline
- 2026-05-19 Listed $79,000 ImagineMLS
- 2026-05-11 Listed $129,900 ImagineMLS
- 2026-05-08 Listed $118,300 ImagineMLS
- 2026-05-08 Listed $139,900 ImagineMLS
- 2026-05-07 Listed $250,000 ImagineMLS
Cash-flow waterfall
monthlySold comps — $/sqft
last 12 mo · ≤1 miLoading sold comps…