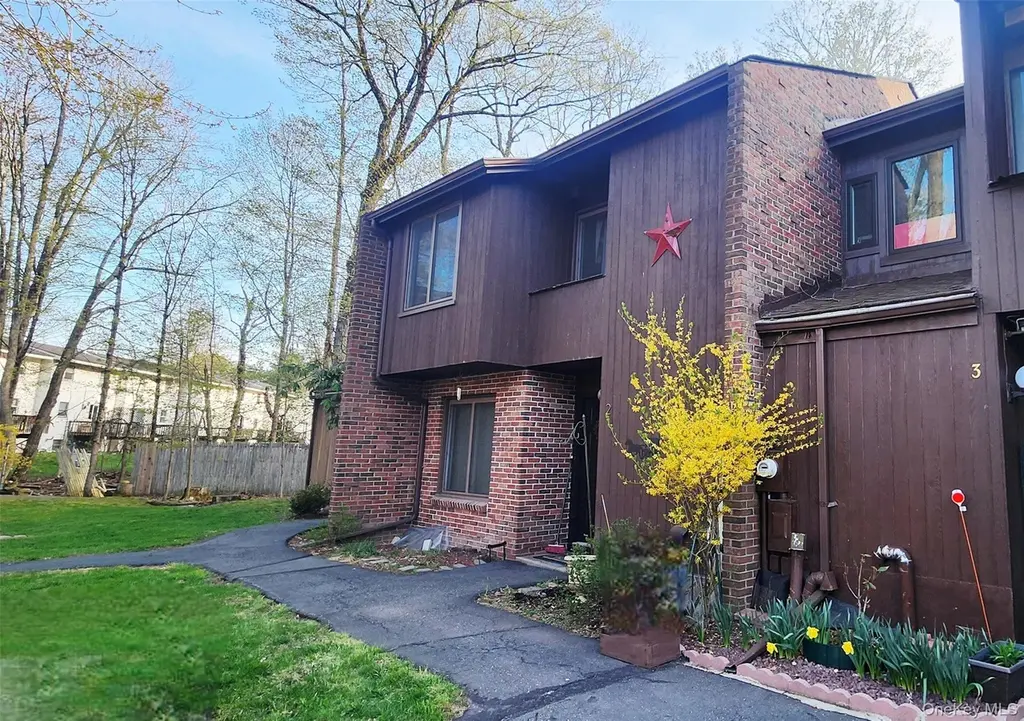
7 Cedar Park #2 · Monticello, NY
Flood risk 1/10 · Minimal
- FEMA flood zone
- X (unshaded)
- Chance of flooding over 30 yrs
- 0.0%
- Est. flood insurance / yr
- $473 – $860
Fire risk 1/10 · Minimal
- Est. fire insurance / yr
- $691 – $1,283
Heat risk 2/10 · Minimal
- Hot days now (above 92°F)
- 7 days/yr
- Hot days in 30 yrs
- 15 days/yr
Wind risk 3/10 · Minor
- Chance of severe wind over 30 yrs
- 6.0%
Air-quality risk 2/10 · Minimal
- Unhealthy air days now
- 1 days/yr
- Unhealthy air days in 30 yrs
- 1 days/yr
Risk factors via First Street. Map © Google.
Why this score? — see what drove the D grade
The composite is a weighted blend of 9 inputs, each scored 0–100. Each bar is that input's sub-score; the figure is the points it added to the 100-point composite (weight × sub-score).
- ARV discount +13.1/15.0
- Appreciation +10.0/10.0
- Cash flow +6.7/30.0
- Livability +3.1/5.0
- Rent growth +2.5/5.0
- Schools +2.5/10.0
- Condition / age +2.5/5.0
- 1% rule +2.4/10.0
- DSCR +1.0/10.0
$275,000
🖨 Deal sheet (PDF) 📄 Offer letter ✓ Due diligence
Listing remarks MLS
Welcome to Cedar Park Commons, a charming and spacious townhouse located in the heart of Monticello. Offering 1,650 sq ft of comfortable living space, this home is ideal for first-time buyers, downsizers, or anyone seeking low-maintenance living with village convenience. The main level features a classic kitchen, a dedicated dining area, a warm and inviting living room, a half bath, laundry area, and ample closet space. Sliding doors lead to your private backyard, perfect for outdoor dining, gardening, or simply relaxing. Upstairs, you’ll find three bedrooms, a full bathroom, and a bonus sitting room that provides a peaceful retreat, home office option, or additional lounge space. Residents enjoy quiet living, a community swimming pool, and worry-free maintenance, all just minutes from shopping, dining, and village amenities. A comfortable, well-located townhouse with great potential !
Key facts
- Bonus sitting room
- Private backyard
- Classic kitchen
Tags
Neighborhood map
What this means for you Summary
Snapshot
- This is a 3-bed/1.5-bath condo listed at $275k.
Deal economics
- At list price, monthly cash flow is $-438 ($-5k/yr) — negative.
- To cash-flow at today's rent, offer at most $198k (28.1% below list).
- To meet the 1% rule (rent ≥ 1% of price), the offer needs to be $205k (25.6% below list).
- Recommended offer: $198k (28.1% below list) — sets the bar for cash-flow.
- Cap rate 4.4% vs local median 3.4% in Monticello — meaningfully above typical; check what's discounted (condition, days-on-market, listing class) to confirm the premium yield is real.
Location & tenants
- Location reads 61/100 on livability (#899 in NY) — a middle-class / working-renter tenant base. Strengths: housing A+, cost of living A-; Watch: crime D, amenities F, commute F.
- Monticello Central School District (town): math 29% / reading 30% proficiency, ranked #577 of 590 in NY (top 98%) — low school quality limits family demand, transient renter base, plan for 1-2y turnover.
- Zoned schools: Kenneth L Rutherford School (math 12% / reading 20%, grade F, #2,020 of 2,108 statewide, top 96%, 492 students, 81% FRL); Robert J Kaiser Middle School (math 7% / reading 35%, grade F, #661 of 729 statewide, top 91%, 595 students, 66% FRL); Monticello High School (math 82% / reading 34%, grade C, #879 of 1,100 statewide, top 80%, 844 students, 63% FRL) — zoned schools average 70% FRL vs 50% district-wide (20 pts higher); higher-poverty schools than district average — tighter screening recommended.
- Market conditions: 188 active listings in the ZIP; 10 comparable units currently listed for rent nearby; rentals lingering (median 46d on market — plan ~5-8 weeks vacancy on turnover, expect pricing pressure); 50% of comp listings sitting > 30 days — soft ceiling on asking rent; 739 units permitted in Sullivan County in 2024 (5 in 5+ unit buildings).
- This rent runs 43% of the median local income ($57k/yr) — at the standard rent-burdened threshold; future hikes will face affordability resistance.
Forward outlook
- In year one you build about $29k of equity ($2k loan paydown + $28k appreciation (10.0% local appreciation)).
- Sullivan County population projected at -24% by 2050 — secular population decline; favor cash flow + early exit over multi-decade hold.
- By year 2, paydown + projected appreciation supports a ~$47k cash-out refi (75% LTV) — recoverable capital for the next deal without selling this one.
Negotiation context
- It's been on market 102 days — a 9% lower offer ($250k) is reasonable based on typical stale-listing flexibility.
- 2 sale attempts with the ask held roughly flat each time — persistent listings suggest the price (not the market) is what's stuck; bring a comps-based counter.
- Current owner paid $88k; list at $275k implies a 212% gain — meaningful room to come down on a strong offer.
Questions for the listing agent
- What do current leases actually rent for vs. the listed asking? Can we see a recent rent roll and the last 12 months of T-12 income?
- It's been on market 102 days. Have you received any prior offers? Is the seller open to a 28% concession, seller financing, or rate buy-down credit?
- Built in 1975 — when were the roof, HVAC, electrical panel, plumbing, and water heater last replaced?
- What does the HOA fee cover, when was the last increase, and are there any pending special assessments or reserve-fund shortfalls?
- Any open or pending special assessments — roof, HVAC, plumbing, elevator, façade? What's the per-unit balance and payoff schedule, and is the seller paying it off at close or rolling it to the buyer?
- Why hasn't it sold? Are there any deal-killer items the seller is aware of (foundation, flood, title, zoning, code violations)?
- Is there a deadline driving the sale (1031 exchange, divorce, estate, relocation)? That informs how much negotiation room exists.
- Schools are F-rated, which usually means shorter tenancies and higher turnover. Who's the typical renter profile here, and what's been the actual vacancy rate?
- Crime grade is D in this area — have there been break-ins, vandalism, or insurance claims at this property in the last 3 years? What carrier currently insures it and at what premium?
- The area grade is low — what's the realistic commute time and amenity access for the typical tenant pool here? Any planned neighborhood developments (good or bad) we should know about?
- What's the average days-on-market for RENTAL listings here right now (not sales)? A rising rental-DOM trend means longer vacancies and softer asking-rent achievability than the comps imply.
- What's the recent tenant-quality profile in this submarket — average credit score on applications, eviction rate, late-payment / NSF rate, and stable-employment percentage? A property-management company in the area should have these aggregated.
- How much new apartment / multifamily construction is in the pipeline within 1–3 miles? Heavy new supply (>2% of stock underway) typically softens rents 12–24 months out; light construction supports rent growth.
Investment metrics
- 1% rule
- 0.74% ✗
- Cap rate
- 4.38%
- Cash-on-cash
- -6.83%
- DSCR
- 0.70
- GRM
- 11.2
CMA / ARV
- ARV (median comp)
- $313,710
- List price
- $275,000
- Delta
- -12.34%
- Verdict
- UNDERPRICED
- Comps
- 20 within 1.0 mi
Projected returns pro-forma
10.0% appreciation · 3.0% rent growth · sell at horizon
- IRR
- 19.5%
- Equity multiple
- 2.58×
- Total profit
- $121,996
- Equity at exit
- $247,742
- IRR
- 17.9%
- Equity multiple
- 5.95×
- Total profit
- $381,448
- Equity at exit
- $534,265
Cash invested: $77,000 (down + closing). Projections, not guarantees.
Landlord ↔ Tenant lean methodology
- Overall (STATE)
- 15 Strongly Tenant-Friendly
- State New York
- 15 Strongly Tenant-Friendly · D+10
- County
- — inherits STATE
- City
- — inherits STATE
ZIP-level market 12701
- Home prices YoY
- 16.7%
- Active inventory
- 188
- Price-to-rent
- 11.2×
Monthly cashflow live
- Estimated rent
- $2,046 high interval (Pro) →
- Mortgage (P&I)
- −$1,442
- Tax from tax record
- −$262 /mo · $3,150/yr
- Insurance
- −$115
- HOA
- −$235
- Vacancy / Maint / Mgmt
- −$430
- Net cashflow
- $-438
Break-even live
Sensitivity live
| Price | -10% $-282 | -5% $-360 | +0% $-438 | +5% $-516 | +10% $-594 |
|---|---|---|---|---|---|
| Rent | -10% $-600 | -5% $-519 | +0% $-438 | +5% $-357 | +10% $-276 |
| Rate | -1.0pp $-300 | -0.5pp $-368 | base $-438 | +0.5pp $-509 | +1.0pp $-582 |
UW: 25.0% down · 7.5% · 30yr · 1.5% tax · 5.0% vac · 8.0% maint · 8.0% mgmt
Financing live
Cash to close
- Down payment
- $68,750
- Closing costs
- $8,250
- Reserves months
- —
- Total cash needed
- —
Loan-product check · same deal, 3 products live
Conventional
25% down · 7.5% · 30yr
- Down + closing
- —
- Monthly P&I
- —
- Monthly cashflow
- —
- DSCR
- —
- Eligible?
- —
Personal DTI + credit; lowest rate.
DSCR
20% down · 8.5% · 30yr
- Down + closing
- —
- Monthly P&I
- —
- Monthly cashflow
- —
- DSCR
- —
- Eligible?
- —
No personal income docs; deal must DSCR.
Hard money
10% down · 12.0% · 12mo
- Down + closing
- —
- Monthly P&I
- —
- Monthly cashflow
- —
- DSCR
- —
- Eligible?
- —
Short-term bridge; refi at stabilization.
Rent comps 10 comps
| Address | Beds | Baths | Sqft | Rent | $/sqft | DOM | Units | Dist |
|---|---|---|---|---|---|---|---|---|
| 19 Lawrence Ave Monticello, NY | 4.0 | 1.5 | 1180 | $2,200 | $1.86 | 45d | 1 | 0.20mi |
| 16 Monticello St Unit 1 Monticello, NY | 4.0 | 1.0 | 1078 | $1,650 | $1.53 | 16d | 1 | 0.24mi |
| 45 Woodcliff Ave Monticello, NY | 3.0 | 1.0 | 1151 | $2,400 | $2.09 | 25d | 1 | 0.39mi |
| 14-16 Bedford Ave Monticello, NY | 3.0 | 1.0 | 1200 | $1,600 | $1.33 | 45d | 1 | 0.49mi |
| 45 Clinton Ave Apt 1 Monticello, NY | 3.0 | 2.0 | 1470 | $2,300 | $1.56 | 45d | 1 | 0.52mi |
| 6 Greenwood Way Monticello, NY | 2.0 | 1.0 | 977 | $1,850 | $1.89 | 15d | 2 | 0.95mi |
| 35 Starr Ave Monticello, NY | 3.0 | 1.5 | 1350 | $1,975 | $1.46 | 45d | 1 | 1.08mi |
| 41 Rock Ridge Ave Monticello, NY | 2.0 | 1.5 | 1200 | $1,800 | $1.50 | 21d | 1 | 1.22mi |
| 3 Saddle Ln Unit 1 Monticello, NY | 2.0 | 1.0 | 1200 | $1,500 | $1.25 | 16d | 1 | 1.42mi |
| 185 Rock Ridge Ave Monticello, NY | 2.0 | 1.0 | 1300 | $1,250 | $0.96 | 45d | 1 | 1.48mi |
HOA detail condo
- Monthly dues
- $235 · $2,820/yr
- Likely covers
- pool
- Assessments
- None detected in remarks — confirm with the listing agent.
Listing history 21 events
-
2026-06-21days on market $275,000 Active 102 DOM
-
2026-06-18days on market $275,000 Active 99 DOM
-
2026-06-17days on market $275,000 Active 98 DOM
-
2026-06-16days on market $275,000 Active 97 DOM
-
2026-06-15days on market $275,000 Active 96 DOM
-
2026-06-14days on market $275,000 Active 94 DOM
-
2026-06-10days on market $275,000 Active 91 DOM
-
2026-06-09days on market $275,000 Active 90 DOM
-
2026-06-08days on market $275,000 Active 89 DOM
-
2026-06-07days on market $275,000 Active 88 DOM
-
2026-06-03days on market $275,000 Active 84 DOM
-
2026-06-02days on market $275,000 Active 83 DOM
-
2026-06-01days on market $275,000 Active 82 DOM
-
2026-05-31days on market $275,000 Active 81 DOM
-
2026-05-31days on market $275,000 Active 80 DOM
-
2026-03-11$275,000 Active 904-char remark
Show marketing remark (904 chars)
Welcome to Cedar Park Commons, a charming and spacious townhouse located in the heart of Monticello. Offering 1,650 sq ft of comfortable living space, this home is ideal for first-time buyers, downsizers, or anyone seeking low-maintenance living with village convenience. The main level features a classic kitchen, a dedicated dining area, a warm and inviting living room, a half bath, laundry area, and ample closet space. Sliding doors lead to your private backyard, perfect for outdoor dining, gardening, or simply relaxing. Upstairs, you’ll find three bedrooms, a full bathroom, and a bonus sitting room that provides a peaceful retreat, home office option, or additional lounge space. Residents enjoy quiet living, a community swimming pool, and worry-free maintenance, all just minutes from shopping, dining, and village amenities. A comfortable, well-located townhouse with great potential !
-
2026-01-01historical
-
2025-10-23$275,000 Active
-
2003-10-21soldstatus $88,000
-
1988-11-07soldstatus $122,000
-
1982-12-16soldstatus $47,000
ⓘ Source: listings_history table (triggers on properties + properties_extension) + one-shot
backfill from property_details.listing_events for pre-trigger history.
Tax reassessment forecast NY · Partial reset (capped growth)
- Current annual tax
- $3,150 · $262/mo
- Projected year-2 tax
- $3,899 · $325/mo
- Expected delta
- +$749/yr (+$62/mo · 23.8%)
ⓘ Screening estimate from a state-policy table — verify with the county assessor before closing.
Climate risk First Street
- Flood 1/10 Low FEMA zone X (unshaded) · 0% chance over 30 yrs
- Wildfire 1/10 Low
- Heat 2/10 Low 7 d/yr ≥92°F today · 15 d/yr by 30 yrs out
- Wind 3/10 Moderate 6% chance of damaging wind over 30 yrs
- Air quality 2/10 Low 1 unhealthy d/yr today · 1 by 30 yrs out
Nearby sold comps map
Loading sold comps map…
Walkable amenities ~0.75 mi
Loading nearby amenities…
Taxation est. · year 1
- Rental income
- $24,548
- − Mortgage interest
- −$15,404
- − Property taxes
- −$3,150
- − Insurance
- −$1,375
- − Repairs & maintenance
- −$1,964
- − Management
- −$1,964
- − HOA
- −$2,820
- − Depreciation
- −$8,000
- Taxable loss
- −$10,128
- Est. tax savings @ 24.0%
- +$2,431
- After-tax cash flow
- $-2,826/yr
For passive investors: Depreciation is non-cash, so a rental often shows a tax loss while cash-flowing — sheltering income. Rental losses are passive: they offset passive income freely, and up to $25,000/yr can offset ordinary (W-2) income if you actively participate and your MAGI is under $100k (phasing out to $0 by $150k); unused losses carry forward. On sale, claimed depreciation is recaptured at up to 25%, and gains may owe capital-gains tax (a 1031 exchange can defer both). Figures are a year-1 estimate at your 24.0% rate — not tax advice; consult a CPA.
Schools (NCES district)
- District
- Monticello Central School District
- NCES district ID
- 3619740
- Math proficiency
- 29% ▼ -4.00%
- Reading proficiency
- 30% ▼ -2.00%
- Median HH income
- $44,696
- Composite
- 25.28/100
- National rank
- #7491
- State rank
- #577 of 590 in NY
Livability — Monticello
- Score
- 61/100
- State rank
- #899
- US rank
- #17510
Category grades
Schools grade is shown separately in the Schools card above.
Census & demographics
- Census place
- Monticello, NY
- County
- Sullivan County · 12,197 people
- City population
- 12,197
- Metro
- nan
- Population (ZIP)
- 12,197
- Household income
- $57,222
- Rent vs Own
- Severe rent burden
- 814.0
Population outlook (Sullivan County) Hauer SSP2
- Today (2025)
- 68,974 people
- By 2030
- 65,609 · -4.9%
- By 2040
- 58,878 · -14.6%
- By 2050
- 52,500 · -23.9%
- By 2075
- 39,941 · -42.1%
- By 2100
- 28,880 · -58.1%
Race, ethnicity, and origin ACS 2023
- Neighborhood character
- Diverse neighborhood (Simpson 0.69)
- Race & ethnicity
- White 43% Hispanic / Latino 31% Black 15% Two or more races 15% Asian 5%
- Hispanic origin (detail)
- Mexican 1% Puerto Rican 19% Dominican 3%
- Common ancestry
- Scotch-Irish 3% Romanian 2% Iranian 1%
- Foreign-born
- 15% · Canada, China, Jamaica
- Languages at home
- 71% English-only · Spanish 20% Other Indo-European 3% Russian/Polish/Slavic 2%
Political lean MEDSL · Sullivan
- 2024 margin
- R (+16.7) · D 41.6% · R 58.4%
- 2008→2024 swing
- -26.2pp toward R · 2008: 9.5pp · 2024: -16.7pp
- All cycles
- 2024: R+16.7 2020: R+9.2 2016: R+13.7 2012: D+10.4 2008: D+9.5
Not yet ingested
- Civics
- —
Market trends
- HPI YoY
- ▲ 72.71%
- Current HPI
- 507.739
- Rent YoY
- —
- Metro
- nan
- State GDP YoY
- ▲ 2.60%
- F500 in state
- 92
Industry mix (Fortune 500 HQ in NY)
| Industry | F500 HQs | Revenue |
|---|---|---|
| Financial Services | 10 | $950B |
|
||
| Consumer Goods | 9 | $162B |
|
||
| Insurance | 4 | $225B |
|
||
| Telecommunications | 2 | $144B |
|
||
| Pharmaceuticals | 2 | $112B |
|
||
| Media / Entertainment | 2 | $69B |
|
||
Price history
+485.1% since first listed6 events — show timeline
- 2026-03-11 Listed $275,000 OneKey® MLS as Distributed by MLS Grid
- 2026-01-01 Listing Removed — OneKey® MLS as Distributed by MLS Grid
- 2025-10-23 Listed $275,000 OneKey® MLS as Distributed by MLS Grid
- 2003-10-21 Sold (Public Records) $88,000 Public Records
- 1988-11-07 Sold (Public Records) $122,000 Public Records
- 1982-12-16 Sold (Public Records) $47,000 Public Records
Property tax history
+2.7%/yrLatest (2025): $3,150 · +5.6% YoY. Source: county tax records.
Cash-flow waterfall
monthlySold comps — $/sqft
last 12 mo · ≤1 miLoading sold comps…