1139 Frank Whiteman Blvd · Naples, FL
Flood risk 5/10 · Moderate
- FEMA flood zone
- AH
- Chance of flooding over 30 yrs
- 0.24%
- Est. flood insurance / yr
- $1,142 – $2,507
Fire risk 1/10 · Minimal
- Est. fire insurance / yr
- $947 – $1,759
Heat risk 10/10 · Severe
- Hot days now (above 107°F)
- 7 days/yr
- Hot days in 30 yrs
- 28 days/yr
Wind risk 10/10 · Severe
- Chance of severe wind over 30 yrs
- 99.0%
Air-quality risk 2/10 · Minimal
- Unhealthy air days now
- 2 days/yr
- Unhealthy air days in 30 yrs
- 2 days/yr
Risk factors via First Street. Map © Google.
Why this score? — see what drove the D+ grade
The composite is a weighted blend of 9 inputs, each scored 0–100. Each bar is that input's sub-score; the figure is the points it added to the 100-point composite (weight × sub-score).
- Cash flow +16.2/30.0
- ARV discount +7.5/15.0
- DSCR +5.0/10.0
- Rent growth +5.0/5.0
- Schools +5.0/10.0
- Livability +4.0/5.0
- 1% rule +3.7/10.0
- Condition / age +2.5/5.0
- Appreciation +0.0/10.0
$550,000
🖨 Deal sheet 📄 Offer letter ✓ Due diligence
Listing remarks
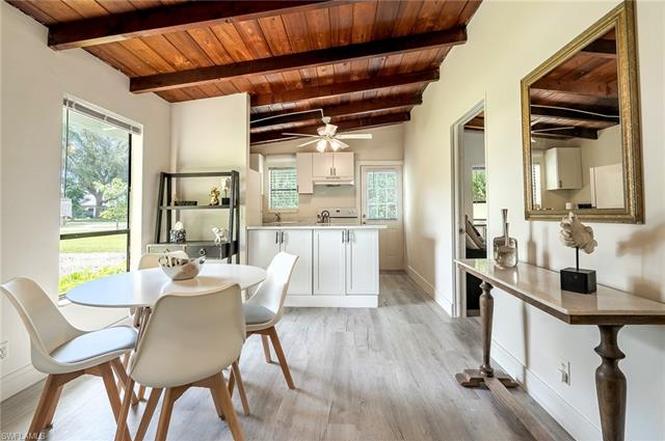
Location location location! -This beautifully updated Florida-style bungalow, ideally positioned in the heart of Naples, combines prime location with unparalleled convenience. Recently renovated and updated, this home boasts new appliances and New roof installed in 2022, making it truly move-in ready and offered fully furnished - Ready for you to move right in or as an Aibnb. Enjoy effortless access to Venetian Village (just a mile away), Naples High School, and a short drive to the vibrant dining, shopping, and entertainment districts of Downtown Naples and Mercato. Whether you envision a full-time residence, a tranquil vacation retreat, or a smart investment opportunity, this home presen
Key facts
- Coveted neighborhood
- New appliances
- New roof
Tags
Property features AI
Finance
- Financial info: No investor/multifamily income or expense details (single unit property)
- HOA & community: No HOA maintenance; No community amenities; Community type: see remarks
Exterior
- Parking: No specific parking information provided
- Security: Smoke detectors
- Utilities: Central water; Central sewer; Cable available
- Home design: Single-family residential; 1 story / ranch; Rear exposure faces north; Development: North Naples Highlands
- Construction: Built in 1956; Wood frame construction; Wood siding exterior; Shingle roof; Single hung windows; Deeded restrictions
- Exterior features: Deck; Room for a pool; Landscaped view; Central irrigation
Interior
- Kitchen: Kitchen island; Breakfast bar; Self-cleaning oven; Refrigerator
- Bedrooms: 2 bedrooms; Primary and secondary bedrooms on the first floor; Split bedroom floorplan
- Flooring: Vinyl flooring
- Bathrooms: 1 full bathroom; No master bath (none specified)
- Heating & cooling: Wall cooling unit; Heating: see remarks
- Interior features: Cable pre-wire; High-speed internet available; Smoke detectors; Vaulted ceiling; Island in the kitchen; Breakfast bar; Furnished negotiable; 3 ceiling fans
- Laundry & utility: Washer/dryer hookup; Dryer (equipment listed)
Neighborhood map
What this means for you Summary
Snapshot
- This is a 2-bed/1.0-bath single-family listed at $550k.
Deal economics
- At list price, monthly cash flow is $140 ($2k/yr) — positive.
- The deal already cash-flows at list — no discount required.
- To meet the 1% rule (rent ≥ 1% of price), the offer needs to be $476k (13.4% below list).
- Recommended offer: $476k (13.4% below list) — sets the bar for 1% rule.
Location & tenants
- Location reads 80/100 on livability (#126 in FL, #1,903 nationally) — a professional / high-income tenant draw. Strengths: crime A+, amenities A+, employment A+; Watch: commute D+, cost of living F.
- Collier (suburban): math 60% / reading 56% proficiency, ranked #16 of 73 in FL (top 22%) — acceptable for families but not a draw, mixed tenant base, ~2y average lease.
- Market conditions: Rents rising fast (+14.6%/yr); 479 active listings in the ZIP; high-income renter base; 3,520 units permitted in Collier County in 2024 (959 in 5+ unit buildings).
- At $4,765/mo this rent would consume 49% of the median local household income ($117k/yr) (locally 311% of renters already pay >50% of income on rent) — very limited rent-growth headroom before tenants either downsize or default.
Forward outlook
- Local home prices are declining (-3.0%/yr); year-one equity from $4k of loan paydown is wiped out by about $16k of value loss. Plan a longer hold.
- Collier County population projected at +30% by 2050 — long-run rental-demand tailwind backs the buy-and-hold thesis.
Negotiation context
- It's been on market 131 days — a 12% lower offer ($484k) is reasonable based on typical stale-listing flexibility.
- 3 sale attempts with the ask held roughly flat each time — persistent listings suggest the price (not the market) is what's stuck; bring a comps-based counter.
- Current owner paid $28k; list at $550k implies a 1830% gain — meaningful room to come down on a strong offer.
Risks & watch-outs
- Watch-outs: flood insurance adds $152/mo; built in 1956 — expect roof / HVAC / electrical / plumbing capex.
- Climate carrying-cost: in FEMA flood zone AH (mandatory federal flood insurance); severe wind risk, 99% chance of damaging wind over 30y; extreme-heat days projected 7→28/yr by 2055 (HVAC capex compounding) — expect insurance premiums to compound above CPI over the hold.
Questions for the listing agent
- It's been on market 131 days. Have you received any prior offers? Is the seller open to a 13% concession, seller financing, or rate buy-down credit?
- Built in 1956 — when were the roof, HVAC, electrical panel, plumbing, and water heater last replaced?
- What's the actual annual flood-insurance premium (NFIP or private), and is the property in a SFHA with mandatory coverage?
- Why hasn't it sold? Are there any deal-killer items the seller is aware of (foundation, flood, title, zoning, code violations)?
- Is there a deadline driving the sale (1031 exchange, divorce, estate, relocation)? That informs how much negotiation room exists.
- Schools are B-rated — typically a magnet for longer-tenancy family renters. What's the average tenant stay here, and is there a school-zone premium baked into asking?
- The area grade is low — what's the realistic commute time and amenity access for the typical tenant pool here? Any planned neighborhood developments (good or bad) we should know about?
- What's the average days-on-market for RENTAL listings here right now (not sales)? A rising rental-DOM trend means longer vacancies and softer asking-rent achievability than the comps imply.
- What's the recent tenant-quality profile in this submarket — average credit score on applications, eviction rate, late-payment / NSF rate, and stable-employment percentage? A property-management company in the area should have these aggregated.
- How much new for-sale + rental construction is in the pipeline within 1–3 miles? Heavy new supply typically softens prices + rents 12–24 months out; constrained supply supports both.
Investment metrics
- 1% rule
- 0.87% ✗
- Cap rate
- 6.93%
- Cash-on-cash
- 2.28%
- DSCR
- 1.10
- GRM
- 9.6
CMA / ARV
No comps found within radius.
Projected returns pro-forma
-3.0% appreciation · 8.0% rent growth · sell at horizon
- IRR
- -9.3%
- Equity multiple
- 0.64×
- Total profit
- $-55,041
- Equity at exit
- $82,007
- IRR
- 5.6%
- Equity multiple
- 1.51×
- Total profit
- $78,042
- Equity at exit
- $47,554
Cash invested: $154,000 (down + closing). Projections, not guarantees.
Landlord ↔ Tenant lean methodology
- Overall (STATE)
- 87 Strongly Landlord-Friendly
- State Florida
- 87 Strongly Landlord-Friendly · R+3
- County
- — inherits STATE
- City
- — inherits STATE
ZIP-level market 34103
- Rents YoY
- 14.6%
- Active inventory
- 479
- Price-to-rent
- 9.6×
Monthly cashflow live
- Estimated rent
- $4,765 medium interval (Pro) →
- Mortgage (P&I)
- −$2,884
- Tax from tax record
- −$359 /mo · $4,302/yr
- Insurance
- −$229
- Flood insurance flood zone
- −$152 /mo · $1,824/yr
- HOA
- −$0
- Vacancy / Maint / Mgmt
- −$1,001
- Net cashflow
- $140
Break-even live
UW: 25.0% down · 7.5% · 30yr · 1.5% tax · 5.0% vac · 8.0% maint · 8.0% mgmt
Financing live
Cash to close
- Down payment
- $137,500
- Closing costs
- $16,500
- Reserves months
- —
- Total cash needed
- —
Loan-product check · same deal, 3 products live
Conventional
25% down · 7.5% · 30yr
- Down + closing
- —
- Monthly P&I
- —
- Monthly cashflow
- —
- DSCR
- —
- Eligible?
- —
Personal DTI + credit; lowest rate.
DSCR
20% down · 8.5% · 30yr
- Down + closing
- —
- Monthly P&I
- —
- Monthly cashflow
- —
- DSCR
- —
- Eligible?
- —
No personal income docs; deal must DSCR.
Hard money
10% down · 12.0% · 12mo
- Down + closing
- —
- Monthly P&I
- —
- Monthly cashflow
- —
- DSCR
- —
- Eligible?
- —
Short-term bridge; refi at stabilization.
Listing history 21 events
-
2026-06-18days on market $550,000 Active 131 DOM
-
2026-06-17days on market $550,000 Active 130 DOM
-
2026-06-16days on market $550,000 Active 129 DOM
-
2026-06-15days on market $550,000 Active 128 DOM
-
2026-06-14days on market $550,000 Active 126 DOM
-
2026-06-10days on market $550,000 Active 123 DOM
-
2026-06-09days on market $550,000 Active 122 DOM
-
2026-06-08days on market $550,000 Active 121 DOM
-
2026-06-07days on market $550,000 Active 120 DOM
-
2026-06-03days on market $550,000 Active 116 DOM
-
2026-06-02days on market $550,000 Active 115 DOM
-
2026-06-01days on market $550,000 Active 114 DOM
-
2026-05-31days on market $550,000 Active 113 DOM
-
2026-05-30days on market $550,000 Active 112 DOM
-
2026-02-07$550,000 Active
-
2025-11-02historical
-
2025-02-21price $550,000
-
2025-02-15status Active
-
2025-02-11historical
-
2025-01-14$575,000 Active
-
1987-09-01soldstatus $28,500
ⓘ Source: listings_history table (triggers on properties + properties_extension) + one-shot
backfill from property_details.listing_events for pre-trigger history.
Tax reassessment forecast FL · Resets to sale price
- Current annual tax
- $4,302 · $359/mo
- Projected year-2 tax
- $4,565 · $380/mo
- Expected delta
- +$263/yr (+$22/mo · 6.1%)
ⓘ Screening estimate from a state-policy table — verify with the county assessor before closing.
Climate risk First Street
- Flood 5/10 Major FEMA zone AH · 24% chance over 30 yrs
- Wildfire 1/10 Low
- Heat 10/10 Extreme 7 d/yr ≥107°F today · 28 d/yr by 30 yrs out
- Wind 10/10 Extreme 99% chance of damaging wind over 30 yrs
- Air quality 2/10 Low 2 unhealthy d/yr today · 2 by 30 yrs out
Nearby sold comps map
Loading sold comps map…
Walkable amenities ~0.75 mi
Loading nearby amenities…
Taxation est. · year 1
- Rental income
- $57,179
- − Mortgage interest
- −$30,809
- − Property taxes
- −$4,302
- − Insurance
- −$4,574
- − Repairs & maintenance
- −$4,574
- − Management
- −$4,574
- − Depreciation
- −$16,000
- Taxable loss
- −$7,655
- Est. tax savings @ 24.0%
- +$1,837
- After-tax cash flow
- $3,521/yr
For passive investors: Depreciation is non-cash, so a rental often shows a tax loss while cash-flowing — sheltering income. Rental losses are passive: they offset passive income freely, and up to $25,000/yr can offset ordinary (W-2) income if you actively participate and your MAGI is under $100k (phasing out to $0 by $150k); unused losses carry forward. On sale, claimed depreciation is recaptured at up to 25%, and gains may owe capital-gains tax (a 1031 exchange can defer both). Figures are a year-1 estimate at your 24.0% rate — not tax advice; consult a CPA.
Schools (NCES district)
- District
- Collier
- NCES district ID
- 1200330
- Math proficiency
- 60% ▼ -4.00%
- Reading proficiency
- 56% ▼ -2.00%
- Median HH income
- $58,275
- Composite
- 50.23/100
- National rank
- #1892
- State rank
- #16 of 73 in FL
Livability — Naples
- Score
- 80/100
- State rank
- #126
- US rank
- #1903
Category grades
Schools grade is shown separately in the Schools card above.
Census & demographics
- County
- Collier County · 396,295 people
- City population
- 344,941
- Metro
- Naples-Marco Island, FL
- Population (ZIP)
- 11,299
- Household income
- $116,875
- Rent vs Own
- Severe rent burden
- 311.0
Population outlook (Collier County) Hauer SSP2
- Today (2025)
- 420,858 people
- By 2030
- 450,054 · +6.9%
- By 2040
- 502,232 · +19.3%
- By 2050
- 544,932 · +29.5%
- By 2075
- 627,203 · +49.0%
- By 2100
- 659,015 · +56.6%
Race, ethnicity, and origin ACS 2023
- Neighborhood character
- Predominantly White (87%)
- Race & ethnicity
- White 87% Hispanic / Latino 10% Two or more races 8% Asian 1%
- Hispanic origin (detail)
- Common ancestry
- Romanian 4% Lithuanian 2% Portuguese 2%
- Foreign-born
- 13% · Canada
- Languages at home
- 87% English-only · Spanish 9% Other Indo-European 2% German/W. Germanic 1%
Political lean MEDSL · Collier
- 2024 margin
- Solid R (+33.1) · D 33.1% · R 66.2%
- 2008→2024 swing
- -10.6pp toward R · 2008: -22.5pp · 2024: -33.1pp
- All cycles
- 2024: R+33.1 2020: R+24.7 2016: R+26.0 2012: R+30.1 2008: R+22.5
Not yet ingested
- Civics
- —
Market trends
- HPI YoY
- ▼ -327.53%
- Current HPI
- 315.1396
- Rent YoY
- ▲ 14.55%
- Metro
- Naples-Marco Island, FL
- State GDP YoY
- ▲ 3.28%
- F500 in state
- 36
Industry mix (Fortune 500 HQ in FL)
| Industry | F500 HQs | Revenue |
|---|---|---|
| Industrial Technology | 2 | $29B |
|
||
| Insurance | 2 | $17B |
|
||
| Retail | 1 | $60B |
|
||
| Technology Distribution | 1 | $58B |
|
||
| Homebuilding | 1 | $35B |
|
||
| Technology Manufacturing | 1 | $35B |
|
||
Price history
+1829.8% since first listed7 events — show timeline
- 2026-02-07 Listed $550,000 NAPLESMLS
- 2025-11-02 Listing Removed — NAPLESMLS
- 2025-02-21 Price Changed $550,000 NAPLESMLS
- 2025-02-15 Relisted — NAPLESMLS
- 2025-02-11 Listing Removed — NAPLESMLS
- 2025-01-14 Listed $575,000 NAPLESMLS
- 1987-09-01 Sold (Public Records) $28,500 Public Records
Property tax history
+12.4%/yrLatest (2025): $4,302 · -7.6% YoY. Source: county tax records.
Cash-flow waterfall
monthlySold comps — $/sqft
last 12 mo · ≤1 miLoading sold comps…