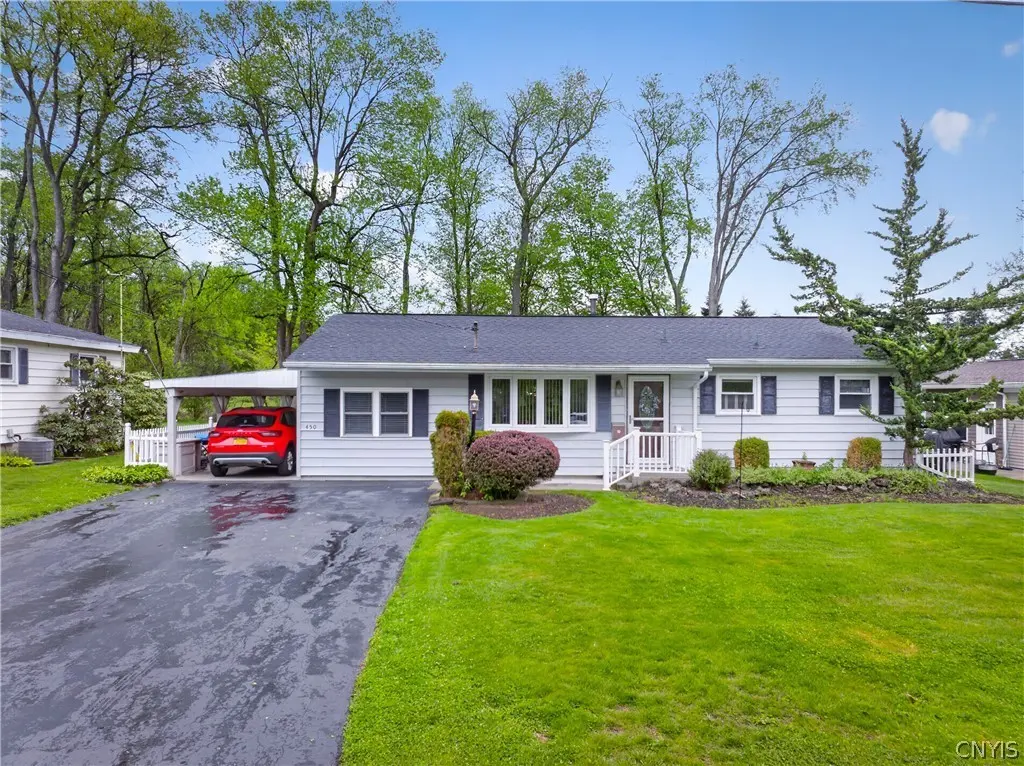
450 Dorsey Ln · Utica, NY
Flood risk 1/10 · Minimal
- FEMA flood zone
- X (unshaded)
- Chance of flooding over 30 yrs
- 0.0%
- Est. flood insurance / yr
- $473 – $860
Fire risk 3/10 · Minor
- Est. fire insurance / yr
- $691 – $1,283
Heat risk 3/10 · Minor
- Hot days now (above 96°F)
- 7 days/yr
- Hot days in 30 yrs
- 16 days/yr
Wind risk 2/10 · Minimal
- Chance of severe wind over 30 yrs
- 1.0%
Air-quality risk 2/10 · Minimal
- Unhealthy air days now
- 0 days/yr
- Unhealthy air days in 30 yrs
- 1 days/yr
Risk factors via First Street. Map © Google.
Why this score? — see what drove the D grade
The composite is a weighted blend of 9 inputs, each scored 0–100. Each bar is that input's sub-score; the figure is the points it added to the 100-point composite (weight × sub-score).
- Cash flow +15.1/30.0
- ARV discount +7.8/15.0
- DSCR +4.6/10.0
- Livability +4.0/5.0
- 1% rule +3.4/10.0
- Schools +2.9/10.0
- Rent growth +2.5/5.0
- Condition / age +2.5/5.0
- Appreciation +0.0/10.0
$299,000
🖨 Deal sheet (PDF) 📄 Offer letter ✓ Due diligence
Listing remarks
This amazing 3-bedroom, 2-full bath ranch offers the perfect blend of comfort, style, and space. Featuring an updated kitchen, a stunning family room with a cozy fireplace, and a spacious dining room perfect for entertaining, this home is designed for everyday living and special gatherings alike. The private primary suite offers a spa-like bath creating the perfect retreat at the end of the day. Step outside to enjoy the large private yard, ideal for relaxing, entertaining, or enjoying nature. A truly move-in ready home with so much to offer!
Key facts
- Spa-like bath
- Large private yard
- Spacious dining room
Tags
Property features AI
Exterior
- Parking: Attached 2-car garage; Carport; Driveway
- Utilities: Public water connected; Sewer connected; Cable available; Public water source
- Home design: Single-story home; Vinyl siding; Asphalt roof; Block foundation; Existing (resale) property
- Construction: Built with vinyl siding; Asphalt roof; Block foundation
- Exterior features: Blacktop driveway; Deck; Open porch; Fully fenced yard; Shed(s)/outdoor storage; Rectangular residential lot; City street frontage; Lot dimensions approximately 69 x 135
Interior
- Kitchen: Electric oven; Electric range; Microwave; Dishwasher; Disposal; Refrigerator; Eat-in kitchen
- Bedrooms: Three main-level bedrooms
- Flooring: Carpet; Hardwood; Ceramic tile; Tile; Varied flooring
- Bathrooms: Two full bathrooms (both on the main level)
- Heating & cooling: Gas forced-air heating; Central air conditioning
- Interior features: Ceiling fans; Separate formal living room; Separate formal dining room; Entrance foyer; Eat-in kitchen; Storage; Main-level primary bedroom; Partial basement; One fireplace
- Laundry & utility: Main-level laundry; Washer; Dryer; Gas water heater
Neighborhood map
What this means for you Summary
Snapshot
- This is a 3-bed/1.0-bath single-family listed at $299k.
Deal economics
- At list price, monthly cash flow is $98 ($1k/yr) — positive.
- The deal already cash-flows at list — no discount required.
- To meet the 1% rule (rent ≥ 1% of price), the offer needs to be $252k (15.6% below list).
- Recommended offer: $252k (15.6% below list) — sets the bar for 1% rule.
Location & tenants
- Location reads 80/100 on livability (#104 in NY, #1,589 nationally) — a professional / high-income tenant draw. Strengths: commute A+, cost of living A+, housing A+; Watch: employment D, crime F.
- Utica City School District (urban): math 33% / reading 38% proficiency, ranked #562 of 590 in NY (top 95%) — families likely to look elsewhere, expect single-tenant / working-renter base with shorter leases; 71% free/reduced lunch — lower-income household profile, screen leases tightly.
- Zoned schools: General Herkimer Elementary School (math 29% / reading 42%, grade F, #1,566 of 2,108 statewide, top 74%, 597 students, 76% FRL); John F Kennedy Middle School (math 27% / reading 35%, grade F, #534 of 729 statewide, top 73%, 695 students, 77% FRL); Thomas R Proctor High School (math 86% / reading 62%, grade B+, #659 of 1,100 statewide, top 60%, 2,675 students, 76% FRL) — zoned schools at 76% FRL track the district average.
- Market conditions: 150 active listings in the ZIP; 2 comparable units currently listed for rent nearby; 204 units permitted in Oneida County in 2024 (68 in 5+ unit buildings).
- At $2,523/mo this rent would consume 52% of the median local household income ($58k/yr) (locally 1604% of renters already pay >50% of income on rent) — very limited rent-growth headroom before tenants either downsize or default.
Forward outlook
- Local home prices are declining (-3.0%/yr); year-one equity from $2k of loan paydown is wiped out by about $9k of value loss. Plan a longer hold.
- Oneida County population projected at -12% by 2050 — secular population decline; favor cash flow + early exit over multi-decade hold.
Negotiation context
- Only 2 days on market — expect competitive offers; lowballing is unlikely to land.
Risks & watch-outs
- Watch-outs: built in 1958 — expect roof / HVAC / electrical / plumbing capex.
Questions for the listing agent
- Built in 1958 — when were the roof, HVAC, electrical panel, plumbing, and water heater last replaced?
- Is there a deadline driving the sale (1031 exchange, divorce, estate, relocation)? That informs how much negotiation room exists.
- Schools are D-rated, which usually means shorter tenancies and higher turnover. Who's the typical renter profile here, and what's been the actual vacancy rate?
- Crime grade is F in this area — have there been break-ins, vandalism, or insurance claims at this property in the last 3 years? What carrier currently insures it and at what premium?
- The area grade is low — what's the realistic commute time and amenity access for the typical tenant pool here? Any planned neighborhood developments (good or bad) we should know about?
- What's the average days-on-market for RENTAL listings here right now (not sales)? A rising rental-DOM trend means longer vacancies and softer asking-rent achievability than the comps imply.
- What's the recent tenant-quality profile in this submarket — average credit score on applications, eviction rate, late-payment / NSF rate, and stable-employment percentage? A property-management company in the area should have these aggregated.
- How much new for-sale + rental construction is in the pipeline within 1–3 miles? Heavy new supply typically softens prices + rents 12–24 months out; constrained supply supports both.
Investment metrics
- 1% rule
- 0.84% ✗
- Cap rate
- 6.69%
- Cash-on-cash
- 1.41%
- DSCR
- 1.06
- GRM
- 9.9
CMA / ARV
- ARV (on-the-fly)
- $300,672
- Comps found
- 12
Show comp detail 12 sales within ~0.75 mi
| Address | Dist | Beds/Ba | Sqft | Sold | Price | $/sf | Match |
|---|---|---|---|---|---|---|---|
| 405 Richmond Rd | 0.35mi | 3/2.0 | 1,649 (-5%) | 3mo | $67,000 | $41 | 70 |
| 703 Burth Pl | 0.51mi | 3/2.0 | 1,700 (-2%) | 7mo | $295,000 | $174 | 64 |
| 407 Deland Dr | 0.30mi | 3/2.0 | 1,820 (+5%) | 12mo | $250,000 | $137 | 63 |
| 824 Herkimer Rd | 0.47mi | 4/1.5 (+1) | 1,768 (+2%) | 7mo | $260,000 | $147 | 61 |
| 455 Elmhurst Rd | 0.38mi | 4/2.0 (+1) | 1,706 (-1%) | 14mo | $220,000 | $129 | 60 |
| 703 Crabapple Dr | 0.43mi | 3/1.5 | 1,634 (-5%) | 15mo | $225,000 | $138 | 56 |
| 429 Linda View Ln | 0.57mi | 3/2.0 | 1,700 (-2%) | 12mo | $318,000 | $187 | 56 |
| 454 Elmdale Ave | 0.55mi | 3/1.5 | 1,596 (-8%) | 5mo | $296,400 | $186 | 56 |
| 10830 Cosby Manor Rd | 0.74mi | 3/3.0 | 1,728 (0%) | 5mo | $225,000 | $130 | 54 |
| 422 Sunlit Ter | 0.62mi | 4/2.0 (+1) | 1,710 (-1%) | 11mo | $400,000 | $234 | 51 |
| 5425 Summerset | 0.70mi | 3/2.5 | 1,772 (+2%) | 10mo | $370,000 | $209 | 49 |
| 461 Elmdale Ave | 0.57mi | 3/2.0 | 1,580 (-9%) | 12mo | $345,000 | $218 | 45 |
Match score weights: distance 35% · size 25% · config 20% · recency 20%. Top-matched comps best support the ARV.
Projected returns pro-forma
-3.0% appreciation · 3.0% rent growth · sell at horizon
- IRR
- -14.1%
- Equity multiple
- 0.50×
- Total profit
- $-42,250
- Equity at exit
- $44,582
- IRR
- -5.3%
- Equity multiple
- 0.65×
- Total profit
- $-28,994
- Equity at exit
- $25,852
Cash invested: $83,720 (down + closing). Projections, not guarantees.
Landlord ↔ Tenant lean methodology
- Overall (STATE)
- 15 Strongly Tenant-Friendly
- State New York
- 15 Strongly Tenant-Friendly · D+10
- County
- — inherits STATE
- City
- — inherits STATE
ZIP-level market 13502
- Home prices YoY
- -12.1%
- Active inventory
- 150
- Price-to-rent
- 9.9×
Monthly cashflow live
- Estimated rent
- $2,523 medium interval (Pro) →
- Mortgage (P&I)
- −$1,568
- Tax from tax record
- −$202 /mo · $2,425/yr
- Insurance
- −$125
- HOA
- −$0
- Vacancy / Maint / Mgmt
- −$530
- Net cashflow
- $98
Break-even live
Sensitivity live
| Price | -10% $268 | -5% $183 | +0% $98 | +5% $14 | +10% $-71 |
|---|---|---|---|---|---|
| Rent | -10% $-101 | -5% $-1 | +0% $98 | +5% $198 | +10% $298 |
| Rate | -1.0pp $249 | -0.5pp $174 | base $98 | +0.5pp $21 | +1.0pp $-58 |
UW: 25.0% down · 7.5% · 30yr · 1.5% tax · 5.0% vac · 8.0% maint · 8.0% mgmt
Financing live
Cash to close
- Down payment
- $74,750
- Closing costs
- $8,970
- Reserves months
- —
- Total cash needed
- —
Loan-product check · same deal, 3 products live
Conventional
25% down · 7.5% · 30yr
- Down + closing
- —
- Monthly P&I
- —
- Monthly cashflow
- —
- DSCR
- —
- Eligible?
- —
Personal DTI + credit; lowest rate.
DSCR
20% down · 8.5% · 30yr
- Down + closing
- —
- Monthly P&I
- —
- Monthly cashflow
- —
- DSCR
- —
- Eligible?
- —
No personal income docs; deal must DSCR.
Hard money
10% down · 12.0% · 12mo
- Down + closing
- —
- Monthly P&I
- —
- Monthly cashflow
- —
- DSCR
- —
- Eligible?
- —
Short-term bridge; refi at stabilization.
Rent comps 2 comps
| Address | Beds | Baths | Sqft | Rent | $/sqft | DOM | Units | Dist |
|---|---|---|---|---|---|---|---|---|
| Deerfield Utica, NY | 3.0 | 2.0 | 2000 | $3,600 | $1.80 | 45d | 1 | 1.13mi |
| 1 Patriot Cir Utica, NY | 1.0–2.0 | 1.0–2.5 | 1451 | $3,115 | $2.15 | 45d | 6 | 1.39mi |
Listing history 2 events
-
2026-05-22status Pending
-
2026-05-20$299,000 Active
ⓘ Source: listings_history table (triggers on properties + properties_extension) + one-shot
backfill from property_details.listing_events for pre-trigger history.
Tax reassessment forecast NY · Partial reset (capped growth)
- Current annual tax
- $2,425 · $202/mo
- Projected year-2 tax
- $3,739 · $312/mo
- Expected delta
- +$1,314/yr (+$110/mo · 54.2%)
ⓘ Screening estimate from a state-policy table — verify with the county assessor before closing.
Climate risk First Street
- Flood 1/10 Low FEMA zone X (unshaded) · 0% chance over 30 yrs
- Wildfire 3/10 Moderate
- Heat 3/10 Moderate 7 d/yr ≥96°F today · 16 d/yr by 30 yrs out
- Wind 2/10 Low 100% chance of damaging wind over 30 yrs
- Air quality 2/10 Low 0 unhealthy d/yr today · 1 by 30 yrs out
Nearby sold comps map
Loading sold comps map…
Walkable amenities ~0.75 mi
Loading nearby amenities…
Taxation est. · year 1
- Rental income
- $30,274
- − Mortgage interest
- −$16,749
- − Property taxes
- −$2,425
- − Insurance
- −$1,495
- − Repairs & maintenance
- −$2,422
- − Management
- −$2,422
- − Depreciation
- −$8,698
- Taxable loss
- −$3,936
- Est. tax savings @ 24.0%
- +$945
- After-tax cash flow
- $2,126/yr
For passive investors: Depreciation is non-cash, so a rental often shows a tax loss while cash-flowing — sheltering income. Rental losses are passive: they offset passive income freely, and up to $25,000/yr can offset ordinary (W-2) income if you actively participate and your MAGI is under $100k (phasing out to $0 by $150k); unused losses carry forward. On sale, claimed depreciation is recaptured at up to 25%, and gains may owe capital-gains tax (a 1031 exchange can defer both). Figures are a year-1 estimate at your 24.0% rate — not tax advice; consult a CPA.
Schools (NCES district)
- District
- Utica City School District
- NCES district ID
- 3629370
- Math proficiency
- 33% ▼ -7.00%
- Reading proficiency
- 38% ▲ 2.00%
- Median HH income
- $31,834
- Composite
- 29.01/100
- National rank
- #6613
- State rank
- #562 of 590 in NY
Livability — Utica
- Score
- 80/100
- State rank
- #104
- US rank
- #1589
Category grades
Schools grade is shown separately in the Schools card above.
Census & demographics
- Census place
- Utica, NY
- County
- Oneida County · 89,710 people
- City population
- 72,968
- Metro
- Utica-Rome, NY
- Population (ZIP)
- 34,037
- Household income
- $57,835
- Rent vs Own
- Severe rent burden
- 1604.0
Population outlook (Oneida County) Hauer SSP2
- Today (2025)
- 225,223 people
- By 2030
- 220,384 · -2.1%
- By 2040
- 209,071 · -7.2%
- By 2050
- 197,920 · -12.1%
- By 2075
- 175,541 · -22.1%
- By 2100
- 148,491 · -34.1%
Race, ethnicity, and origin ACS 2023
- Neighborhood character
- Predominantly White (71%)
- Race & ethnicity
- White 71% Hispanic / Latino 11% Black 9% Two or more races 7% Asian 5%
- Hispanic origin (detail)
- Mexican 2% Puerto Rican 5% Dominican 2%
- Common ancestry
- Romanian 11% Lithuanian 3% American 2%
- Foreign-born
- 12% · Canada, Philippines, China
- Languages at home
- 81% English-only · Spanish 7% Russian/Polish/Slavic 4% Other Asian/Pacific 3%
Political lean MEDSL · Oneida
- 2024 margin
- Strong R (+21.3) · D 39.4% · R 60.6%
- 2008→2024 swing
- -15.2pp toward R · 2008: -6.1pp · 2024: -21.3pp
- All cycles
- 2024: R+21.3 2020: R+15.5 2016: R+21.1 2012: R+5.3 2008: R+6.1
Not yet ingested
- Civics
- —
Market trends
- HPI YoY
- ▼ -50.76%
- Current HPI
- 368.3955
- Rent YoY
- —
- Metro
- Utica-Rome, NY
- State GDP YoY
- ▲ 2.60%
- F500 in state
- 92
Industry mix (Fortune 500 HQ in NY)
| Industry | F500 HQs | Revenue |
|---|---|---|
| Financial Services | 10 | $950B |
|
||
| Consumer Goods | 9 | $162B |
|
||
| Insurance | 4 | $225B |
|
||
| Telecommunications | 2 | $144B |
|
||
| Pharmaceuticals | 2 | $112B |
|
||
| Media / Entertainment | 2 | $69B |
|
||
Price history
2 events — show timeline
- 2026-05-22 Pending — CNYIS
- 2026-05-20 Listed $299,000 CNYIS
Property tax history
+1.4%/yrLatest (2025): $2,425 · -14.4% YoY. Source: county tax records.
Cash-flow waterfall
monthlySold comps — $/sqft
last 12 mo · ≤1 miLoading sold comps…