 Duplex
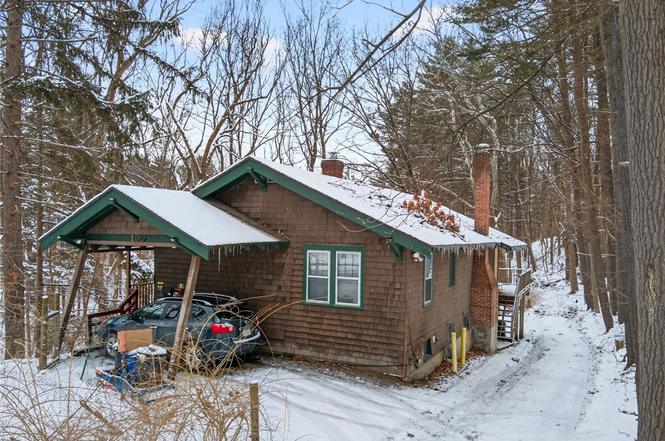
150 Highland Ave · Ithaca, NY
Flood risk 1/10 · Minimal
- FEMA flood zone
- X
- Chance of flooding over 30 yrs
- 0.0%
- Est. flood insurance / yr
- $473 – $860
Fire risk 1/10 · Minimal
- Est. fire insurance / yr
- $691 – $1,283
Heat risk 2/10 · Minimal
- Hot days now (above 94°F)
- 7 days/yr
- Hot days in 30 yrs
- 15 days/yr
Wind risk 1/10 · Minimal
- Chance of severe wind over 30 yrs
- 1.0%
Air-quality risk 2/10 · Minimal
- Unhealthy air days now
- 0 days/yr
- Unhealthy air days in 30 yrs
- 1 days/yr
Risk factors via First Street. Map © Google.
Why this score? — see what drove the A- grade
The composite is a weighted blend of 9 inputs, each scored 0–100. Each bar is that input's sub-score; the figure is the points it added to the 100-point composite (weight × sub-score).
- Cash flow +30.0/30.0
- ARV discount +15.0/15.0
- 1% rule +10.0/10.0
- DSCR +10.0/10.0
- Schools +5.4/10.0
- Livability +3.9/5.0
- Rent growth +3.8/5.0
- Condition / age +2.5/5.0
- Appreciation +0.0/10.0
$349,000
🖨 Deal sheet 📄 Offer letter ✓ Due diligence
Multi-family units
County records classify this as Multi-Family (2-4 Unit). Listing-text estimate: 2 units. confirmed
Listing remarks
Located in prestigious Cornell Heights, directly adjacent to Cornell University and just steps from campus, this charming bungalow style duplex presents a rare investment opportunity in one of Ithaca's most sought after neighborhoods. The first floor features a spacious 2 bedroom, 2 bath apartment with off street parking, a carport, and a private deck overlooking a large wooded lot. The lower level offers a 2 bedroom, 1 bath apartment, also with off street parking and beautiful views of the surrounding natural setting. With a solid rental history and an unbeatable location so close to campus, this is an exceptional opportunity to own an income property in Cornell Heights for under 350,000.
Key facts
- Private deck
- Adjacent parcel
- Large wooded lot
Tags
Neighborhood map
What this means for you Summary
Snapshot
- This is a 2 × 2-bed/1.5-bath units multifamily listed at $349k.
Deal economics
- At list price, monthly cash flow is $2k ($22k/yr) — positive. Per door: $918/mo.
- The deal already cash-flows at list — no discount required.
- Meets the 1% rule at list price ($6k rent vs $349k).
- Recommended offer: $344k (1.5% below list) — sets the bar for market timing.
- Cap rate 12.6% vs local median 5.3% in Ithaca — top-decile yield for the area; either an underpriced asset or a hidden risk that comps aren't pricing in. Stress-test before assuming the spread holds.
Location & tenants
- Location reads 77/100 on livability (#210 in NY, #3,240 nationally) — a middle-class / working-renter tenant base. Strengths: amenities A+, commute A+, health & safety A+; Watch: housing C-, employment D+, cost of living D.
- Ithaca City School District (urban): math 57% / reading 71% proficiency, ranked #195 of 590 in NY (top 33%) — acceptable for families but not a draw, mixed tenant base, ~2y average lease.
- Zoned schools: Cayuga Heights Elementary School (math 57% / reading 67%, grade B, #675 of 2,108 statewide, top 35%, 303 students, 33% FRL); Boynton Middle School (math 36% / reading 64%, grade C, #261 of 729 statewide, top 36%, 526 students, 36% FRL); Ithaca Senior High School (math 95% / reading 95%, grade A+, #83 of 1,100 statewide, top 8%, 1,341 students, 31% FRL) — zoned schools at 33% FRL track the district average.
- Market conditions: Rents rising fast (+5.2%/yr); 327 active listings in the ZIP; 382 units permitted in Tompkins County in 2024 (208 in 5+ unit buildings).
- At $5,561/mo this rent would consume 93% of the median local household income ($71k/yr) (locally 5169% of renters already pay >50% of income on rent) — very limited rent-growth headroom before tenants either downsize or default.
Forward outlook
- Local home prices are declining (-3.0%/yr); year-one equity from $2k of loan paydown is wiped out by about $10k of value loss. Plan a longer hold.
- Tompkins County population projected at +17% by 2050 — long-run rental-demand tailwind backs the buy-and-hold thesis.
- At projected returns (-3.0% appreciation + 5.2% rent growth), your $98k cash investment doubles in ~5 years — after that, you're playing with house money.
Negotiation context
- It's been on market 15 days — a 2% lower offer ($344k) is reasonable based on typical stale-listing flexibility.
- Current owner paid $109k; list at $349k implies a 220% gain — meaningful room to come down on a strong offer.
Risks & watch-outs
- Watch-outs: built in 1920 — expect roof / HVAC / electrical / plumbing capex.
Questions for the listing agent
- Can we see the unit-by-unit rent roll, current vacancy, and any below-market leases? What's the average tenancy length?
- What capital expenditures (roof, boiler, parking lot, exteriors) have been made in the last 5 years, and what's planned in the next 2?
- Built in 1920 — when were the roof, HVAC, electrical panel, plumbing, and water heater last replaced?
- Is there a deadline driving the sale (1031 exchange, divorce, estate, relocation)? That informs how much negotiation room exists.
- Schools are A-rated — typically a magnet for longer-tenancy family renters. What's the average tenant stay here, and is there a school-zone premium baked into asking?
- What's the average days-on-market for RENTAL listings here right now (not sales)? A rising rental-DOM trend means longer vacancies and softer asking-rent achievability than the comps imply.
- What's the recent tenant-quality profile in this submarket — average credit score on applications, eviction rate, late-payment / NSF rate, and stable-employment percentage? A property-management company in the area should have these aggregated.
- How much new apartment / multifamily construction is in the pipeline within 1–3 miles? Heavy new supply (>2% of stock underway) typically softens rents 12–24 months out; light construction supports rent growth.
Investment metrics
- 1% rule
- 1.59% ✓
- Cap rate
- 12.61%
- Cash-on-cash
- 22.54%
- DSCR
- 2.00
- GRM
- 5.2
CMA / ARV
- ARV (on-the-fly)
- $479,412
- Comps found
- 2
Show comp detail 2 sales within ~0.75 mi
| Address | Dist | Beds/Ba | Sqft | Sold | Price | $/sf | Match |
|---|---|---|---|---|---|---|---|
| 842 N Aurora St | 0.62mi | 5/2.0 (+1) | 2,408 (-3%) | 9mo | $465,000 | $193 | 54 |
| 402 University Ave | 0.63mi | 5/3.0 (+1) | 2,661 (+7%) | 2mo | $445,000 | $167 | 48 |
Match score weights: distance 35% · size 25% · config 20% · recency 20%. Top-matched comps best support the ARV.
Projected returns pro-forma
-3.0% appreciation · 5.22% rent growth · sell at horizon
- IRR
- 18.0%
- Equity multiple
- 1.75×
- Total profit
- $73,242
- Equity at exit
- $52,037
- IRR
- 28.0%
- Equity multiple
- 3.76×
- Total profit
- $269,563
- Equity at exit
- $30,175
Cash invested: $97,720 (down + closing). Projections, not guarantees.
Landlord ↔ Tenant lean methodology
- Overall (STATE)
- 15 Strongly Tenant-Friendly
- State New York
- 15 Strongly Tenant-Friendly · D+10
- County
- — inherits STATE
- City
- — inherits STATE
ZIP-level market 14850
- Rents YoY
- 5.2%
- Active inventory
- 327
- Price-to-rent
- 10.5×
Monthly cashflow live
- Estimated rent
- $5,561 medium interval (Pro) →
- Mortgage (P&I)
- −$1,830
- Tax from tax record
- −$582 /mo · $6,981/yr
- Insurance
- −$145
- HOA
- −$0
- Vacancy / Maint / Mgmt
- −$1,168
- Net cashflow
- $1,836
Break-even live
2-unit breakdown (identical units grouped — click to expand)
| Units | Beds | Baths | Est. rent |
|---|---|---|---|
| 2× units | 2 | 1.5 | $5,560 |
| #1 | 2 | 1.5 | $2,780 |
| #2 | 2 | 1.5 | $2,780 |
| Total (2 units) | $5,561 | ||
UW: 25.0% down · 7.5% · 30yr · 1.5% tax · 5.0% vac · 8.0% maint · 8.0% mgmt
Financing live
Cash to close
- Down payment
- $87,250
- Closing costs
- $10,470
- Reserves months
- —
- Total cash needed
- —
Loan-product check · same deal, 3 products live
Conventional
25% down · 7.5% · 30yr
- Down + closing
- —
- Monthly P&I
- —
- Monthly cashflow
- —
- DSCR
- —
- Eligible?
- —
Personal DTI + credit; lowest rate.
DSCR
20% down · 8.5% · 30yr
- Down + closing
- —
- Monthly P&I
- —
- Monthly cashflow
- —
- DSCR
- —
- Eligible?
- —
No personal income docs; deal must DSCR.
Hard money
10% down · 12.0% · 12mo
- Down + closing
- —
- Monthly P&I
- —
- Monthly cashflow
- —
- DSCR
- —
- Eligible?
- —
Short-term bridge; refi at stabilization.
Listing history 5 events
-
2026-03-12status Pending
-
2026-03-09historical Active Under Contract
-
2026-02-25$349,000 Active
-
1998-08-28soldstatus $109,000
-
1997-01-30soldstatus $109,900
ⓘ Source: listings_history table (triggers on properties + properties_extension) + one-shot
backfill from property_details.listing_events for pre-trigger history.
Tax reassessment forecast NY · Partial reset (capped growth)
- Current annual tax
- $6,981 · $582/mo
- Projected year-2 tax
- $6,981 · $582/mo
- Expected delta
- $0/yr ($0/mo · 0.0%)
ⓘ Screening estimate from a state-policy table — verify with the county assessor before closing.
Climate risk First Street
- Flood 1/10 Low FEMA zone X · 0% chance over 30 yrs
- Wildfire 1/10 Low
- Heat 2/10 Low 7 d/yr ≥94°F today · 15 d/yr by 30 yrs out
- Wind 1/10 Low 100% chance of damaging wind over 30 yrs
- Air quality 2/10 Low 0 unhealthy d/yr today · 1 by 30 yrs out
Nearby sold comps map
Loading sold comps map…
Walkable amenities ~0.75 mi
Loading nearby amenities…
Taxation est. · year 1
- Rental income
- $66,732
- − Mortgage interest
- −$19,549
- − Property taxes
- −$6,981
- − Insurance
- −$1,745
- − Repairs & maintenance
- −$5,339
- − Management
- −$5,339
- − Depreciation
- −$10,153
- Taxable income
- $17,627
- Est. tax owed @ 24.0%
- −$4,230
- After-tax cash flow
- $17,800/yr
For passive investors: Depreciation is non-cash, so a rental often shows a tax loss while cash-flowing — sheltering income. Rental losses are passive: they offset passive income freely, and up to $25,000/yr can offset ordinary (W-2) income if you actively participate and your MAGI is under $100k (phasing out to $0 by $150k); unused losses carry forward. On sale, claimed depreciation is recaptured at up to 25%, and gains may owe capital-gains tax (a 1031 exchange can defer both). Figures are a year-1 estimate at your 24.0% rate — not tax advice; consult a CPA.
Schools (NCES district)
- District
- Ithaca City School District
- NCES district ID
- 3615570
- Math proficiency
- 57% ▼ -5.00%
- Reading proficiency
- 71% ▲ 11.00%
- Median HH income
- $46,528
- Composite
- 54.01/100
- National rank
- #1397
- State rank
- #195 of 590 in NY
Livability — Ithaca
- Score
- 77/100
- State rank
- #210
- US rank
- #3240
Category grades
Schools grade is shown separately in the Schools card above.
Census & demographics
- Census place
- Ithaca, NY
- County
- Tompkins County · 68,610 people
- City population
- 68,610
- Metro
- Ithaca, NY
- Population (ZIP)
- 68,610
- Household income
- $71,445
- Rent vs Own
- Severe rent burden
- 5169.0
Population outlook (Tompkins County) Hauer SSP2
- Today (2025)
- 113,958 people
- By 2030
- 118,774 · +4.2%
- By 2040
- 125,927 · +10.5%
- By 2050
- 133,599 · +17.2%
- By 2075
- 156,759 · +37.6%
- By 2100
- 169,896 · +49.1%
Race, ethnicity, and origin ACS 2023
- Neighborhood character
- Predominantly White (68%)
- Race & ethnicity
- White 68% Asian 13% Hispanic / Latino 8% Two or more races 8% Black 4%
- Hispanic origin (detail)
- Mexican 2% Puerto Rican 2%
- Common ancestry
- Romanian 3% Italian 3% Scotch-Irish 2%
- Foreign-born
- 18% · China, Canada, South Korea
- Languages at home
- 79% English-only · Chinese 5% Spanish 4% Other Indo-European 4%
Political lean MEDSL · Tompkins
- 2024 margin
- Solid D (+50.6) · D 75.3% · R 24.7%
- 2008→2024 swing
- +8.6pp toward D · 2008: 42.1pp · 2024: 50.6pp
- All cycles
- 2024: D+50.6 2020: D+49.2 2016: D+42.1 2012: D+39.8 2008: D+42.1
Not yet ingested
- Civics
- —
Market trends
- HPI YoY
- ▼ -276.59%
- Current HPI
- 389.7215
- Rent YoY
- ▲ 5.22%
- Metro
- Ithaca, NY
- State GDP YoY
- ▲ 2.60%
- F500 in state
- 92
Industry mix (Fortune 500 HQ in NY)
| Industry | F500 HQs | Revenue |
|---|---|---|
| Financial Services | 10 | $950B |
|
||
| Consumer Goods | 9 | $162B |
|
||
| Insurance | 4 | $225B |
|
||
| Telecommunications | 2 | $144B |
|
||
| Pharmaceuticals | 2 | $112B |
|
||
| Media / Entertainment | 2 | $69B |
|
||
Price history
+217.6% since first listed5 events — show timeline
- 2026-03-12 Pending — IBRMLS
- 2026-03-09 Contingent — IBRMLS
- 2026-02-25 Listed $349,000 IBRMLS
- 1998-08-28 Sold (Public Records) $109,000 Public Records
- 1997-01-30 Sold (Public Records) $109,900 Public Records
Property tax history
-1.6%/yrLatest (2025): $6,981 · +2.3% YoY. Source: county tax records.
Cash-flow waterfall
monthlySold comps — $/sqft
last 12 mo · ≤1 miLoading sold comps…