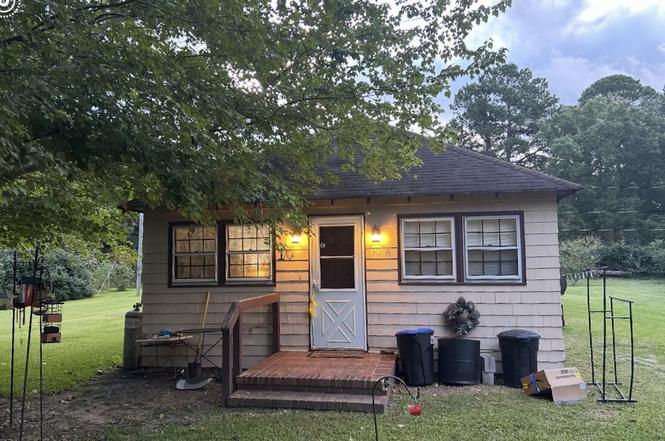
108 Ruths Ln · Virginia Beach, VA
Flood risk 5/10 · Moderate
- FEMA flood zone
- X (unshaded)
- Chance of flooding over 30 yrs
- 0.49%
- Est. flood insurance / yr
- $507 – $1,088
Fire risk 5/10 · Moderate
- Est. fire insurance / yr
- $906 – $1,684
Heat risk 9/10 · Severe
- Hot days now (above 102°F)
- 7 days/yr
- Hot days in 30 yrs
- 18 days/yr
Wind risk 8/10 · Major
- Chance of severe wind over 30 yrs
- 99.0%
Air-quality risk 1/10 · Minimal
- Unhealthy air days now
- 0 days/yr
- Unhealthy air days in 30 yrs
- 0 days/yr
Risk factors via First Street. Map © Google.
Why this score? — see what drove the D grade
The composite is a weighted blend of 9 inputs, each scored 0–100. Each bar is that input's sub-score; the figure is the points it added to the 100-point composite (weight × sub-score).
- Cash flow +9.2/30.0
- Appreciation +7.9/10.0
- ARV discount +7.5/15.0
- Schools +4.2/10.0
- Livability +4.2/5.0
- DSCR +2.6/10.0
- Rent growth +2.5/5.0
- Condition / age +2.5/5.0
- 1% rule +2.0/10.0
$169,000
🖨 Deal sheet 📄 Offer letter ✓ Due diligence
Listing remarks
Must see! Adorable bungalow on Knotts Island! Located on a quiet lane, close to the elementary school, this home is priced to sell!
Key facts
- Quiet lane
- Bungalow
- 0.75 acre lot
Tags
Property features AI
Finance
- Other: Zoning: Single-family residential; Private road frontage; Lot approx. 0.75 acres (dimensions provided)
Exterior
- Parking: Unpaved parking; Attached garage with 1 garage space; 1 parking space total
- Utilities: Well water; Septic tank; Cable available
- Home design: Single-family residence; One level; Residential property
- Construction: Wood siding and frame construction; Block foundation; Shingle roof; Built with traditional frame (year built not provided)
- Exterior features: Deck; Shed(s)
Interior
- Kitchen: Range; Dishwasher
- Bedrooms: 6 total rooms (includes bedrooms and living spaces)
- Bathrooms: 1 full bathroom
- Heating & cooling: Electric heating; Wall/Window cooling unit(s)
- Interior features: Ceiling fan(s); Window coverings
- Laundry & utility: Washer hookup
Neighborhood map
What this means for you Summary
Snapshot
- This is a 2-bed/1.0-bath single-family listed at $169k.
Deal economics
- At list price, monthly cash flow is $-126 ($-2k/yr) — negative.
- To cash-flow at today's rent, offer at most $147k (13.2% below list).
- To meet the 1% rule (rent ≥ 1% of price), the offer needs to be $118k (29.9% below list).
- Recommended offer: $118k (29.9% below list) — sets the bar for 1% rule.
- Cap rate 5.4% vs local median 3.5% in Virginia Beach — top-decile yield for the area; either an underpriced asset or a hidden risk that comps aren't pricing in. Stress-test before assuming the spread holds.
Location & tenants
- Location reads 83/100 on livability (#38 in VA, #880 nationally) — a professional / high-income tenant draw. Strengths: amenities A+, employment A+, housing A+; Watch: cost of living C-, commute F.
- Currituck County Schools (rural): math 45% / reading 51% proficiency, ranked #67 of 178 in NC (top 38%) — families likely to look elsewhere, expect single-tenant / working-renter base with shorter leases.
- Zoned schools: Knotts Island Elementary (math 44% / reading 54%, grade D, #417 of 1,410 statewide, top 32%, 108 students, 27% FRL); Moyock Middle (math 39% / reading 51%, grade D, #160 of 475 statewide, top 35%, 621 students, 24% FRL); Currituck County High (math 52% / reading 64%, grade C, #243 of 535 statewide, top 46%, 1,057 students, 30% FRL) — zoned schools at 27% FRL track the district average.
- Market conditions: 429 units permitted in Currituck County in 2024 (0 in 5+ unit buildings).
Forward outlook
- In year one you build about $11k of equity ($1k loan paydown + $10k appreciation (5.9% local appreciation)).
- Currituck County population projected at +23% by 2050 — long-run rental-demand tailwind backs the buy-and-hold thesis.
- By year 4, paydown + projected appreciation supports a ~$38k cash-out refi (75% LTV) — recoverable capital for the next deal without selling this one.
Negotiation context
- It's been on market 213 days — a 12% lower offer ($149k) is reasonable based on typical stale-listing flexibility.
- 3 sale attempts with the ask held roughly flat each time — persistent listings suggest the price (not the market) is what's stuck; bring a comps-based counter.
Risks & watch-outs
- Watch-outs: built in 1945 — expect roof / HVAC / electrical / plumbing capex.
- Climate carrying-cost: moderate flood risk; severe wind risk, 99% chance of damaging wind over 30y; moderate wildfire risk; extreme-heat days projected 7→18/yr by 2055 (HVAC capex compounding) — expect insurance premiums to compound above CPI over the hold.
Questions for the listing agent
- What do current leases actually rent for vs. the listed asking? Can we see a recent rent roll and the last 12 months of T-12 income?
- It's been on market 213 days. Have you received any prior offers? Is the seller open to a 30% concession, seller financing, or rate buy-down credit?
- Built in 1945 — when were the roof, HVAC, electrical panel, plumbing, and water heater last replaced?
- Why hasn't it sold? Are there any deal-killer items the seller is aware of (foundation, flood, title, zoning, code violations)?
- Is there a deadline driving the sale (1031 exchange, divorce, estate, relocation)? That informs how much negotiation room exists.
- Schools are A-rated — typically a magnet for longer-tenancy family renters. What's the average tenant stay here, and is there a school-zone premium baked into asking?
- The area grade is low — what's the realistic commute time and amenity access for the typical tenant pool here? Any planned neighborhood developments (good or bad) we should know about?
- What's the average days-on-market for RENTAL listings here right now (not sales)? A rising rental-DOM trend means longer vacancies and softer asking-rent achievability than the comps imply.
- What's the recent tenant-quality profile in this submarket — average credit score on applications, eviction rate, late-payment / NSF rate, and stable-employment percentage? A property-management company in the area should have these aggregated.
- How much new for-sale + rental construction is in the pipeline within 1–3 miles? Heavy new supply typically softens prices + rents 12–24 months out; constrained supply supports both.
Investment metrics
- 1% rule
- 0.70% ✗
- Cap rate
- 5.40%
- Cash-on-cash
- -3.19%
- DSCR
- 0.86
- GRM
- 11.9
CMA / ARV
No comps found within radius.
Projected returns pro-forma
5.86% appreciation · 3.0% rent growth · sell at horizon
- IRR
- 12.4%
- Equity multiple
- 1.83×
- Total profit
- $39,287
- Equity at exit
- $104,712
- IRR
- 13.1%
- Equity multiple
- 3.58×
- Total profit
- $122,137
- Equity at exit
- $188,585
Cash invested: $47,320 (down + closing). Projections, not guarantees.
Landlord ↔ Tenant lean methodology
- Overall (STATE)
- 55 Moderately Landlord-Leaning
- State Virginia
- 55 Moderately Landlord-Leaning · D+2
- County
- — inherits STATE
- City
- — inherits STATE
ZIP-level market 27950
- Home prices YoY
- 1.8%
- Price-to-rent
- 11.9×
Monthly cashflow live
- Estimated rent
- $1,184 medium interval (Pro) →
- Mortgage (P&I)
- −$886
- Tax from tax record
- −$105 /mo · $1,258/yr
- Insurance
- −$70
- HOA
- −$0
- Vacancy / Maint / Mgmt
- −$249
- Net cashflow
- $-126
Break-even live
UW: 25.0% down · 7.5% · 30yr · 1.5% tax · 5.0% vac · 8.0% maint · 8.0% mgmt
Financing live
Cash to close
- Down payment
- $42,250
- Closing costs
- $5,070
- Reserves months
- —
- Total cash needed
- —
Loan-product check · same deal, 3 products live
Conventional
25% down · 7.5% · 30yr
- Down + closing
- —
- Monthly P&I
- —
- Monthly cashflow
- —
- DSCR
- —
- Eligible?
- —
Personal DTI + credit; lowest rate.
DSCR
20% down · 8.5% · 30yr
- Down + closing
- —
- Monthly P&I
- —
- Monthly cashflow
- —
- DSCR
- —
- Eligible?
- —
No personal income docs; deal must DSCR.
Hard money
10% down · 12.0% · 12mo
- Down + closing
- —
- Monthly P&I
- —
- Monthly cashflow
- —
- DSCR
- —
- Eligible?
- —
Short-term bridge; refi at stabilization.
Listing history 18 events
-
2026-06-18days on market $169,000 Active 213 DOM
-
2026-06-17days on market $169,000 Active 212 DOM
-
2026-06-16days on market $169,000 Active 211 DOM
-
2026-06-15days on market $169,000 Active 210 DOM
-
2026-06-13days on market $169,000 Active 208 DOM
-
2026-06-09days on market $169,000 Active 204 DOM
-
2026-06-08days on market $169,000 Active 203 DOM
-
2026-06-07days on market $169,000 Active 202 DOM
-
2026-06-03days on market $169,000 Active 198 DOM
-
2026-06-02days on market $169,000 Active 197 DOM
-
2026-06-01days on market $169,000 Active 196 DOM
-
2026-05-31days on market $169,000 Active 195 DOM
-
2026-05-08status Active
-
2026-04-07status Active
-
2026-03-30historical Active Under Contract
-
2026-03-30historical
-
2026-03-06price $169,000
-
2025-10-09$175,000 Active
ⓘ Source: listings_history table (triggers on properties + properties_extension) + one-shot
backfill from property_details.listing_events for pre-trigger history.
Tax reassessment forecast VA · Resets to sale price
- Current annual tax
- $1,258 · $105/mo
- Projected year-2 tax
- $1,386 · $115/mo
- Expected delta
- +$128/yr (+$11/mo · 10.1%)
ⓘ Screening estimate from a state-policy table — verify with the county assessor before closing.
Climate risk First Street
- Flood 5/10 Major FEMA zone X (unshaded) · 49% chance over 30 yrs
- Wildfire 5/10 Major
- Heat 9/10 Extreme 7 d/yr ≥102°F today · 18 d/yr by 30 yrs out
- Wind 8/10 Severe 99% chance of damaging wind over 30 yrs
- Air quality 1/10 Low 0 unhealthy d/yr today · 0 by 30 yrs out
Nearby sold comps map
Loading sold comps map…
Walkable amenities ~0.75 mi
Loading nearby amenities…
Taxation est. · year 1
- Rental income
- $14,211
- − Mortgage interest
- −$9,467
- − Property taxes
- −$1,258
- − Insurance
- −$845
- − Repairs & maintenance
- −$1,137
- − Management
- −$1,137
- − Depreciation
- −$4,916
- Taxable loss
- −$4,549
- Est. tax savings @ 24.0%
- +$1,092
- After-tax cash flow
- $-420/yr
For passive investors: Depreciation is non-cash, so a rental often shows a tax loss while cash-flowing — sheltering income. Rental losses are passive: they offset passive income freely, and up to $25,000/yr can offset ordinary (W-2) income if you actively participate and your MAGI is under $100k (phasing out to $0 by $150k); unused losses carry forward. On sale, claimed depreciation is recaptured at up to 25%, and gains may owe capital-gains tax (a 1031 exchange can defer both). Figures are a year-1 estimate at your 24.0% rate — not tax advice; consult a CPA.
Schools (NCES district)
- District
- Currituck County Schools
- NCES district ID
- 3701080
- Math proficiency
- 45% ▲ 2.00%
- Reading proficiency
- 51% ▲ 5.00%
- Median HH income
- $58,898
- Composite
- 41.96/100
- National rank
- #3348
- State rank
- #67 of 178 in NC
Livability — Virginia Beach
- Score
- 83/100
- State rank
- #38
- US rank
- #880
Category grades
Schools grade is shown separately in the Schools card above.
Census & demographics
- City population
- 448,227
- Population (ZIP)
- 1,786
Population outlook (Currituck County) Hauer SSP2
- Today (2025)
- 28,690 people
- By 2030
- 30,311 · +5.7%
- By 2040
- 33,220 · +15.8%
- By 2050
- 35,405 · +23.4%
- By 2075
- 40,998 · +42.9%
- By 2100
- 44,117 · +53.8%
Race, ethnicity, and origin ACS 2023
- Neighborhood character
- Predominantly White (97%)
- Race & ethnicity
- White 97% Asian 2%
- Common ancestry
- Italian 2% Slovak 1% Serbian 1%
- Foreign-born
- 3% · South Korea
- Languages at home
- 99% English-only · German/W. Germanic 1% French/Haitian/Cajun 1%
Political lean MEDSL · Currituck
- 2024 margin
- Solid R (+47.9) · D 25.6% · R 73.5%
- 2008→2024 swing
- -16.4pp toward R · 2008: -31.5pp · 2024: -47.9pp
- All cycles
- 2024: R+47.9 2020: R+46.2 2016: R+49.8 2012: R+35.1 2008: R+31.5
Not yet ingested
- Civics
- —
Market trends
- HPI YoY
- ▲ 5.86%
- Current HPI
- 327.9432
- Rent YoY
- —
- Metro
- —
- State GDP YoY
- ▲ 2.40%
- F500 in state
- 50
Industry mix (Fortune 500 HQ in VA)
| Industry | F500 HQs | Revenue |
|---|---|---|
| Aerospace / Defense | 4 | $236B |
|
||
| Technology / Defense | 3 | $32B |
|
||
| Financial Services | 2 | $176B |
|
||
| Utilities | 2 | $27B |
|
||
| Insurance | 2 | $25B |
|
||
| Technology | 2 | $15B |
|
||
Price history
-3.4% since first listed6 events — show timeline
- 2026-05-08 Relisted — Hive MLS
- 2026-04-07 Relisted — Hive MLS
- 2026-03-30 Contingent — Hive MLS
- 2026-03-30 Listing Removed — Hive MLS
- 2026-03-06 Price Changed $169,000 Hive MLS
- 2025-10-09 Listed $175,000 Hive MLS
Property tax history
+7.7%/yrLatest (2025): $1,258 · +0.7% YoY. Source: county tax records.
Cash-flow waterfall
monthlySold comps — $/sqft
last 12 mo · ≤1 miLoading sold comps…