823 Cottonwood Dr · Enumclaw, WA
Flood risk 5/10 · Moderate
- FEMA flood zone
- X (unshaded)
- Chance of flooding over 30 yrs
- 0.66%
- Est. flood insurance / yr
- $507 – $1,088
Fire risk 3/10 · Minor
- Est. fire insurance / yr
- $604 – $1,122
Heat risk 2/10 · Minimal
- Hot days now (above 87°F)
- 7 days/yr
- Hot days in 30 yrs
- 15 days/yr
Wind risk 1/10 · Minimal
- Chance of severe wind over 30 yrs
- —
Air-quality risk 6/10 · Moderate
- Unhealthy air days now
- 10 days/yr
- Unhealthy air days in 30 yrs
- 12 days/yr
Risk factors via First Street. Map © Google.
Why this score? — see what drove the D+ grade
The composite is a weighted blend of 9 inputs, each scored 0–100. Each bar is that input's sub-score; the figure is the points it added to the 100-point composite (weight × sub-score).
- Cash flow +15.0/30.0
- ARV discount +7.5/15.0
- Schools +5.5/10.0
- 1% rule +5.0/10.0
- DSCR +5.0/10.0
- Livability +4.4/5.0
- Rent growth +3.6/5.0
- Condition / age +2.5/5.0
- Appreciation +0.0/10.0
$25,000
🖨 Deal sheet 📄 Offer letter ✓ Due diligence
Listing remarks
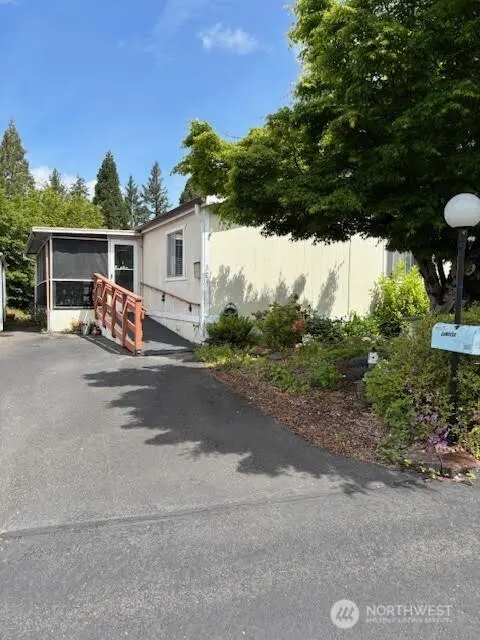
Welcome to this spacious 3-bedroom, 2-bath home located in the highly desirable 55+ Community of Mt. Villa. Fantastic opportunity to build instant equity at an affordable entry price! This property has solid bones and endless potential. While it does need some TLC, it’s perfect for a handyman investor or anyone looking for a budget-friendly home that they can customize over time. Open floor plan with a sizable living room. Bright kitchen offering lots of cabinet space, convenient to the dining area. Nice primary bedroom with a full bathroom. With a little vision and effort, this place could easily transform into a warm and inviting retreat in the very desirable Mount Villa Estates in
Key facts
- Parking
- Built 1983
- Listed 170 days
Neighborhood map
What this means for you Summary
Snapshot
- This is a 3-bed/2.0-bath manufactured listed at $25k.
Deal economics
- At list price, monthly cash flow is $2k ($21k/yr) — positive.
- The deal already cash-flows at list — no discount required.
- Meets the 1% rule at list price ($2k rent vs $25k).
- Recommended offer: $22k (12.0% below list) — sets the bar for market timing.
- Cap rate 91.4% vs local median 2.4% in Enumclaw — top-decile yield for the area; either an underpriced asset or a hidden risk that comps aren't pricing in. Stress-test before assuming the spread holds.
Location & tenants
- Location reads 88/100 on livability (#12 in WA, #222 nationally) — a professional / high-income tenant draw. Strengths: crime A+, amenities A+, housing A+; Watch: cost of living D-.
- Enumclaw School District (suburban): math 54% / reading 68% proficiency, ranked #46 of 291 in WA (top 16%) — acceptable for families but not a draw, mixed tenant base, ~2y average lease.
- Market conditions: Rents rising fast (+4.3%/yr); 223 active listings in the ZIP; 9 comparable units currently listed for rent nearby; rentals leasing fast (median 10d on market — plan ~1-2 weeks tenant-placement turnaround); high-income renter base; 10,555 units permitted in King County in 2024 (7,119 in 5+ unit buildings).
Forward outlook
- Local home prices are declining (-3.0%/yr); year-one equity from $173 of loan paydown is wiped out by about $750 of value loss. Plan a longer hold.
- King County population projected at +44% by 2050 — long-run rental-demand tailwind backs the buy-and-hold thesis.
- At projected returns (-3.0% appreciation + 4.3% rent growth), your $7k cash investment doubles in ~1 year — after that, you're playing with house money.
Negotiation context
- It's been on market 170 days — a 12% lower offer ($22k) is reasonable based on typical stale-listing flexibility.
- 2 sale attempts since 23y ago; this cycle's ask has dropped $25k (50%) from the opening price — seller is motivated, your offer sets the floor, not the list.
Risks & watch-outs
- Climate carrying-cost: moderate flood risk — expect insurance premiums to compound above CPI over the hold.
Questions for the listing agent
- It's been on market 170 days. Have you received any prior offers? Is the seller open to a 12% concession, seller financing, or rate buy-down credit?
- Why hasn't it sold? Are there any deal-killer items the seller is aware of (foundation, flood, title, zoning, code violations)?
- Is there a deadline driving the sale (1031 exchange, divorce, estate, relocation)? That informs how much negotiation room exists.
- The area grade is low — what's the realistic commute time and amenity access for the typical tenant pool here? Any planned neighborhood developments (good or bad) we should know about?
- What's the average days-on-market for RENTAL listings here right now (not sales)? A rising rental-DOM trend means longer vacancies and softer asking-rent achievability than the comps imply.
- What's the recent tenant-quality profile in this submarket — average credit score on applications, eviction rate, late-payment / NSF rate, and stable-employment percentage? A property-management company in the area should have these aggregated.
- How much new for-sale + rental construction is in the pipeline within 1–3 miles? Heavy new supply typically softens prices + rents 12–24 months out; constrained supply supports both.
Investment metrics
- 1% rule
- 9.85% ✓
- Cap rate
- 91.37%
- Cash-on-cash
- 303.86%
- DSCR
- 14.52
- GRM
- 0.8
CMA / ARV
- ARV (median comp)
- $150,305
- List price
- $25,000
- Delta
- -83.37%
- Verdict
- UNDERPRICED
- Comps
- 12 within 1.0 mi
Show comp detail 12 sales within ~0.75 mi
| Address | Dist | Beds/Ba | Sqft | Sold | Price | $/sf | Match |
|---|---|---|---|---|---|---|---|
| 1144 Douglas Fir | 0.37mi | 3/2.0 | 1,344 (0%) | 11mo | $180,000 | $134 | 74 |
| 209 Noble Fir Cir #60 | 0.54mi | 3/2.0 | 1,344 (0%) | 3mo | $150,000 | $112 | 72 |
| 926 Pine Dr | 0.09mi | 2/2.0 (-1) | 1,248 (-7%) | 9mo | $119,500 | $96 | 71 |
| 943 Pine Dr | 0.10mi | 3/2.0 | 1,244 (-7%) | 16mo | $210,000 | $169 | 70 |
| 1207 Maple Dr | 0.25mi | 3/2.0 | 1,456 (+8%) | 6mo | $160,000 | $110 | 69 |
| 936 Mountain Villa Dr | 0.10mi | 2/2.0 (-1) | 1,512 (+12%) | 1mo | $222,000 | $147 | 69 |
| 207 Noble Fir Cir | 0.55mi | 2/2.0 (-1) | 1,344 (0%) | 3mo | $140,000 | $104 | 67 |
| 1106 Mountian Villa Loop | 0.18mi | 2/2.0 (-1) | 1,248 (-7%) | 10mo | $90,000 | $72 | 67 |
| 252 Grand Fir Dr #25 | 0.52mi | 3/2.0 | 1,352 (+1%) | 12mo | $185,000 | $137 | 65 |
| 206 Noble Fir Cir | 0.57mi | 2/2.0 (-1) | 1,248 (-7%) | 11mo | $70,000 | $56 | 47 |
| 201 Grand Fir Dr | 0.49mi | 3/2.0 | 1,188 (-12%) | 14mo | $144,000 | $121 | 47 |
| 2200 Oak Ave #49 | 0.60mi | 2/2.0 (-1) | 1,536 (+14%) | 8mo | $135,000 | $88 | 36 |
Match score weights: distance 35% · size 25% · config 20% · recency 20%. Top-matched comps best support the ARV.
Projected returns pro-forma
-3.0% appreciation · 4.32% rent growth · sell at horizon
- IRR
- —
- Equity multiple
- 17.03×
- Total profit
- $112,191
- Equity at exit
- $3,728
- IRR
- —
- Equity multiple
- 37.74×
- Total profit
- $257,179
- Equity at exit
- $2,162
Cash invested: $7,000 (down + closing). Projections, not guarantees.
Landlord ↔ Tenant lean methodology
- Overall (STATE)
- 28 Tenant-Leaning
- State Washington
- 28 Tenant-Leaning · D+8
- County
- — inherits STATE
- City
- — inherits STATE
ZIP-level market 98022
- Rents YoY
- 4.3%
- Active inventory
- 223
- Price-to-rent
- 0.8×
Monthly cashflow live
- Estimated rent
- $2,462 high interval (Pro) →
- Mortgage (P&I)
- −$131
- Tax est. 1.5%
- −$31 /mo · $375/yr
- Insurance
- −$10
- HOA
- −$0
- Vacancy / Maint / Mgmt
- −$517
- Net cashflow
- $1,773
Break-even live
UW: 25.0% down · 7.5% · 30yr · 1.5% tax · 5.0% vac · 8.0% maint · 8.0% mgmt
Financing live
Cash to close
- Down payment
- $6,250
- Closing costs
- $750
- Reserves months
- —
- Total cash needed
- —
Loan-product check · same deal, 3 products live
Conventional
25% down · 7.5% · 30yr
- Down + closing
- —
- Monthly P&I
- —
- Monthly cashflow
- —
- DSCR
- —
- Eligible?
- —
Personal DTI + credit; lowest rate.
DSCR
20% down · 8.5% · 30yr
- Down + closing
- —
- Monthly P&I
- —
- Monthly cashflow
- —
- DSCR
- —
- Eligible?
- —
No personal income docs; deal must DSCR.
Hard money
10% down · 12.0% · 12mo
- Down + closing
- —
- Monthly P&I
- —
- Monthly cashflow
- —
- DSCR
- —
- Eligible?
- —
Short-term bridge; refi at stabilization.
Rent comps 9 comps
| Address | Beds | Baths | Sqft | Rent | $/sqft | DOM | Units | Dist |
|---|---|---|---|---|---|---|---|---|
| 847 Blake St Enumclaw, WA | 3.0 | 1.0 | 1064 | $2,000 | $1.88 | 1d | 1 | 0.13mi |
| 124 Jewell St Enumclaw, WA | 3.0 | 1.5 | 1540 | $3,200 | $2.08 | 43d | 1 | 0.33mi |
| 615 Watson St N Unit 617B Enumclaw, WA | 2.0 | 1.0 | 960 | $1,999 | $2.08 | 1d | 1 | 0.35mi |
| 556 Bondgard Ave E Enumclaw, WA | 3.0 | 2.0 | 1480 | $2,995 | $2.02 | 10d | 1 | 0.65mi |
| 312 Charwila Ln Enumclaw, WA | 2.0 | 1.0 | 894 | $1,750 | $1.96 | 12d | 1 | 0.81mi |
| 250 Charwila Ln Enumclaw, WA | 2.0 | 1.0 | 894 | $1,750 | $1.96 | 2d | 1 | 0.81mi |
| 1571 Kibler Ave Enumclaw, WA | 3.0 | 2.0 | 1200 | $2,600 | $2.17 | 20d | 1 | 0.94mi |
| 1571 Kibler Ave Enumclaw, WA | 3.0 | 2.0 | 1200 | $2,600 | $2.17 | 15d | 1 | 0.94mi |
| 320 Chinook Ave Enumclaw, WA | 2.0–3.0 | 1.0–2.0 | 923 | $2,283 | $2.47 | 1d | 7 | 0.96mi |
Listing history 16 events
-
2026-06-18days on market $25,000 Active 170 DOM
-
2026-06-17days on market $25,000 Active 169 DOM
-
2026-06-16days on market $25,000 Active 168 DOM
-
2026-06-15days on market $25,000 Active 167 DOM
-
2026-06-13days on market $25,000 Active 165 DOM
-
2026-06-09days on market $25,000 Active 161 DOM
-
2026-06-08days on market $25,000 Active 160 DOM
-
2026-06-07days on market $25,000 Active 159 DOM
-
2026-06-04days on market $25,000 Active 156 DOM
-
2026-06-03days on market $25,000 Active 155 DOM
-
2026-06-02days on market $25,000 Active 154 DOM
-
2026-06-02status $25,000 Active 153 DOM
-
2026-01-22price $25,000
-
2025-12-18$49,950 Active
-
2004-05-17soldstatus $32,000
-
2003-11-04$34,990
ⓘ Source: listings_history table (triggers on properties + properties_extension) + one-shot
backfill from property_details.listing_events for pre-trigger history.
Climate risk First Street
- Flood 5/10 Major FEMA zone X (unshaded) · 66% chance over 30 yrs
- Wildfire 3/10 Moderate
- Heat 2/10 Low 7 d/yr ≥87°F today · 15 d/yr by 30 yrs out
- Wind 1/10 Low
- Air quality 6/10 Major 10 unhealthy d/yr today · 12 by 30 yrs out
Nearby sold comps map
Loading sold comps map…
Walkable amenities ~0.75 mi
Loading nearby amenities…
Taxation est. · year 1
- Rental income
- $29,549
- − Mortgage interest
- −$1,400
- − Property taxes
- −$375
- − Insurance
- −$125
- − Repairs & maintenance
- −$2,364
- − Management
- −$2,364
- − Depreciation
- −$727
- Taxable income
- $22,193
- Est. tax owed @ 24.0%
- −$5,326
- After-tax cash flow
- $15,944/yr
For passive investors: Depreciation is non-cash, so a rental often shows a tax loss while cash-flowing — sheltering income. Rental losses are passive: they offset passive income freely, and up to $25,000/yr can offset ordinary (W-2) income if you actively participate and your MAGI is under $100k (phasing out to $0 by $150k); unused losses carry forward. On sale, claimed depreciation is recaptured at up to 25%, and gains may owe capital-gains tax (a 1031 exchange can defer both). Figures are a year-1 estimate at your 24.0% rate — not tax advice; consult a CPA.
Schools (NCES district)
- District
- Enumclaw School District
- NCES district ID
- 5300001
- Math proficiency
- 54% ▼ -1.00%
- Reading proficiency
- 68% ▬ 0.00%
- Median HH income
- $68,441
- Composite
- 55.21/100
- National rank
- #2736
- State rank
- #46 of 291 in WA
Livability — Enumclaw
- Score
- 88/100
- State rank
- #12
- US rank
- #222
Category grades
Schools grade is shown separately in the Schools card above.
Census & demographics
- Census place
- Enumclaw, WA
- County
- King County · 2,251,916 people
- City population
- 22,418
- Metro
- Seattle-Tacoma-Bellevue, WA
- Population (ZIP)
- 22,418
- Household income
- $120,406
- Rent vs Own
- Severe rent burden
- 382.0
Population outlook (King County) Hauer SSP2
- Today (2025)
- 2,576,485 people
- By 2030
- 2,803,316 · +8.8%
- By 2040
- 3,255,921 · +26.4%
- By 2050
- 3,706,444 · +43.9%
- By 2075
- 4,746,063 · +84.2%
- By 2100
- 5,407,730 · +109.9%
Race, ethnicity, and origin ACS 2023
- Neighborhood character
- Predominantly White (78%)
- Race & ethnicity
- White 78% Hispanic / Latino 10% Two or more races 9% Asian 2% Native American 2%
- Hispanic origin (detail)
- Mexican 8%
- Common ancestry
- Portuguese 7% Italian 4% Slovak 3%
- Foreign-born
- 6% · Canada
- Languages at home
- 91% English-only · Spanish 6% Other Indo-European 1% German/W. Germanic 1%
Political lean MEDSL · King
- 2024 margin
- Solid D (+51.7) · D 74.2% · R 22.5% · Other 3.4%
- 2008→2024 swing
- +9.6pp toward D · 2008: 42.1pp · 2024: 51.7pp
- All cycles
- 2024: D+51.7 2020: D+52.7 2016: D+50.4 2012: D+39.9 2008: D+42.1
Not yet ingested
- Civics
- —
Market trends
- HPI YoY
- ▼ -605.16%
- Current HPI
- 297.9161
- Rent YoY
- ▲ 4.32%
- Metro
- Seattle-Tacoma-Bellevue, WA
- State GDP YoY
- ▲ 4.65%
- F500 in state
- 22
Industry mix (Fortune 500 HQ in WA)
| Industry | F500 HQs | Revenue |
|---|---|---|
| Retail | 2 | $269B |
|
||
| Technology / Retail | 1 | $638B |
|
||
| Technology | 1 | $245B |
|
||
| Telecommunications | 1 | $38B |
|
||
| Food / Beverage | 1 | $36B |
|
||
| Automotive / Trucks | 1 | $34B |
|
||
Price history
-28.6% since first listed4 events — show timeline
- 2026-01-22 Price Changed $25,000 NWMLS as Distributed by MLS Grid
- 2025-12-18 Listed $49,950 NWMLS as Distributed by MLS Grid
- 2004-05-17 Sold (MLS) $32,000 NWMLS as Distributed by MLS Grid
- 2003-11-04 Listed $34,990 NWMLS as Distributed by MLS Grid
Cash-flow waterfall
monthlySold comps — $/sqft
last 12 mo · ≤1 miLoading sold comps…