0-3A Lot 3a Newberry Est · New Salem, PA
Flood risk No data
- FEMA flood zone
- —
- Chance of flooding over 30 yrs
- —
- Est. flood insurance / yr
- —
Fire risk No data
- Est. fire insurance / yr
- —
Heat risk No data
- Hot days now (above threshold)
- —
- Hot days in 30 yrs
- —
Wind risk No data
- Chance of severe wind over 30 yrs
- —
Air-quality risk No data
- Unhealthy air days now
- —
- Unhealthy air days in 30 yrs
- —
Risk factors via First Street. Map © Google.
Why this score? — see what drove the D+ grade
The composite is a weighted blend of 9 inputs, each scored 0–100. Each bar is that input's sub-score; the figure is the points it added to the 100-point composite (weight × sub-score).
- Cash flow +15.0/30.0
- ARV discount +7.5/15.0
- 1% rule +5.0/10.0
- DSCR +5.0/10.0
- Schools +4.8/10.0
- Livability +3.3/5.0
- Rent growth +2.5/5.0
- Condition / age +2.5/5.0
- Appreciation +0.0/10.0
$24,900
🖨 Deal sheet 📄 Offer letter ✓ Due diligence
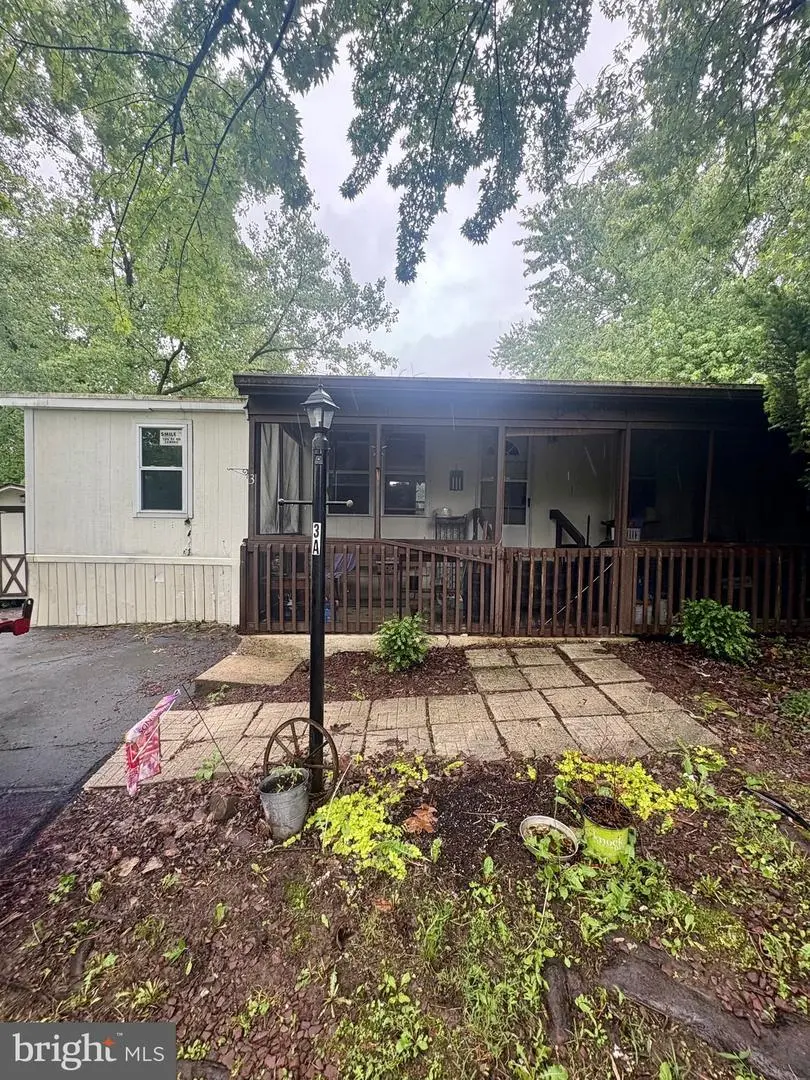
Listing remarks
Beautiful opportunity in Newberry Estates. This spacious double wide offer potential for the right buyer willing to put in some work and make it their own. Ideal for investors, or buyer seeking affordable living. Conveniently located. Property is being sold as-is and will require updates and repairs although roof, heating system and hot water heater have recently been updated. The possibilities are endless.
Key facts
- Double wide
- 2 parking spots
- Built 1976
Tags
Property features AI
Finance
- Other: Property manager present
- Financial info: Annual ground rent listed as an income/expense item
- HOA & community: Monthly ground rent of $750; HOA/association fee $750 monthly (includes water, sewer, trash)
Exterior
- Parking: Asphalt driveway with two driveway spaces; Two total garage/parking spaces
- Utilities: Private/community water; Private sewer
- Home design: Manufactured double-wide; Below-average condition; Not in a federal flood zone
- Construction: Vinyl siding; Aluminum siding; Double-hung windows
- Exterior features: Level lot; Deck(s); Enclosed outdoor living area; Porch(es)
Interior
- Kitchen: Refrigerator; Stove
- Bedrooms: Three bedrooms on the main level
- Bathrooms: Two full bathrooms on the main level
- Heating & cooling: Central heating; Oil-fired heat; Electric hot water
- Interior features: Tub with shower; Two or more access exits
- Laundry & utility: Washer/dryer hookups; Has laundry
Neighborhood map
What this means for you Summary
Snapshot
- This is a 3-bed/2.0-bath single-family listed at $25k.
Deal economics
- At list price, monthly cash flow is $199 ($2k/yr) — positive.
- The deal already cash-flows at list — no discount required.
- Meets the 1% rule at list price ($1k rent vs $25k).
- Recommended offer: $25k (1.5% below list) — sets the bar for market timing.
Location & tenants
- Location reads 66/100 on livability (#1,075 in PA) — a middle-class / working-renter tenant base. Strengths: employment A+, cost of living A+, housing A+; Watch: schools F, amenities F, commute F.
- Spring Grove Area SD (suburban): math 45% / reading 65% proficiency, ranked #98 of 539 in PA (top 18%) — acceptable for families but not a draw, mixed tenant base, ~2y average lease.
- Market conditions: 36 active listings in the ZIP; 1,328 units permitted in York County in 2024 (338 in 5+ unit buildings).
Forward outlook
- Local home prices are declining (-3.0%/yr); year-one equity from $172 of loan paydown is wiped out by about $747 of value loss. Plan a longer hold.
- At projected returns (-3.0% appreciation + 3.0% rent growth), your $7k cash investment doubles in ~4 years — after that, you're playing with house money.
Negotiation context
- It's been on market 19 days — a 2% lower offer ($25k) is reasonable based on typical stale-listing flexibility.
Risks & watch-outs
- Watch-outs: HOA is 53% of rent.
Questions for the listing agent
- Built in 1976 — when were the roof, HVAC, electrical panel, plumbing, and water heater last replaced?
- What does the HOA fee cover, when was the last increase, and are there any pending special assessments or reserve-fund shortfalls?
- Is there a deadline driving the sale (1031 exchange, divorce, estate, relocation)? That informs how much negotiation room exists.
- Schools are F-rated, which usually means shorter tenancies and higher turnover. Who's the typical renter profile here, and what's been the actual vacancy rate?
- The area grade is low — what's the realistic commute time and amenity access for the typical tenant pool here? Any planned neighborhood developments (good or bad) we should know about?
- What's the average days-on-market for RENTAL listings here right now (not sales)? A rising rental-DOM trend means longer vacancies and softer asking-rent achievability than the comps imply.
- What's the recent tenant-quality profile in this submarket — average credit score on applications, eviction rate, late-payment / NSF rate, and stable-employment percentage? A property-management company in the area should have these aggregated.
- How much new for-sale + rental construction is in the pipeline within 1–3 miles? Heavy new supply typically softens prices + rents 12–24 months out; constrained supply supports both.
Investment metrics
- 1% rule
- 5.70% ✓
- Cap rate
- 15.86%
- Cash-on-cash
- 34.18%
- DSCR
- 2.52
- GRM
- 1.5
CMA / ARV
- ARV (on-the-fly)
- $182,016
- Comps found
- 7
Show comp detail 7 sales within ~0.75 mi
| Address | Dist | Beds/Ba | Sqft | Sold | Price | $/sf | Match |
|---|---|---|---|---|---|---|---|
| 4487 Cherry Dr | 0.17mi | 4/1.0 (+1) | 1,145 (-1%) | 4mo | $305,000 | $266 | 78 |
| 2165 Martin Rd | 0.23mi | 3/1.0 | 1,152 (0%) | 14mo | $180,000 | $156 | 74 |
| 1484 Fire Hall Rd | 0.32mi | 3/2.0 | 1,200 (+4%) | 9mo | $285,000 | $238 | 71 |
| 1814 Stoverstown Rd | 0.26mi | 2/1.0 (-1) | 1,128 (-2%) | 16mo | $210,000 | $186 | 62 |
| 1856 Stoverstown Rd | 0.41mi | 3/1.0 | 1,140 (-1%) | 23mo | $162,000 | $142 | 56 |
| 1857 Westside Ln | 0.40mi | 2/1.0 (-1) | 1,074 (-7%) | 15mo | $170,000 | $158 | 48 |
| 1945 Stoverstown Rd | 0.71mi | 2/1.0 (-1) | 1,232 (+7%) | 19mo | $185,000 | $150 | 31 |
Match score weights: distance 35% · size 25% · config 20% · recency 20%. Top-matched comps best support the ARV.
Projected returns pro-forma
-3.0% appreciation · 3.0% rent growth · sell at horizon
- IRR
- 30.7%
- Equity multiple
- 2.30×
- Total profit
- $9,094
- Equity at exit
- $3,713
- IRR
- 38.5%
- Equity multiple
- 4.75×
- Total profit
- $26,164
- Equity at exit
- $2,153
Cash invested: $6,972 (down + closing). Projections, not guarantees.
Landlord ↔ Tenant lean methodology
- Overall (STATE)
- 62 Landlord-Friendly
- State Pennsylvania
- 62 Landlord-Friendly · EVEN
- County
- — inherits STATE
- City
- — inherits STATE
ZIP-level market 17370
- Home prices YoY
- -31.1%
- Active inventory
- 36
- Price-to-rent
- 1.5×
Monthly cashflow live
- Estimated rent
- $1,419 medium interval (Pro) →
- Mortgage (P&I)
- −$131
- Tax est. 1.5%
- −$31 /mo · $374/yr
- Insurance
- −$10
- HOA
- −$750
- Vacancy / Maint / Mgmt
- −$298
- Net cashflow
- $199
Break-even live
UW: 25.0% down · 7.5% · 30yr · 1.5% tax · 5.0% vac · 8.0% maint · 8.0% mgmt
Financing live
Cash to close
- Down payment
- $6,225
- Closing costs
- $747
- Reserves months
- —
- Total cash needed
- —
Loan-product check · same deal, 3 products live
Conventional
25% down · 7.5% · 30yr
- Down + closing
- —
- Monthly P&I
- —
- Monthly cashflow
- —
- DSCR
- —
- Eligible?
- —
Personal DTI + credit; lowest rate.
DSCR
20% down · 8.5% · 30yr
- Down + closing
- —
- Monthly P&I
- —
- Monthly cashflow
- —
- DSCR
- —
- Eligible?
- —
No personal income docs; deal must DSCR.
Hard money
10% down · 12.0% · 12mo
- Down + closing
- —
- Monthly P&I
- —
- Monthly cashflow
- —
- DSCR
- —
- Eligible?
- —
Short-term bridge; refi at stabilization.
HOA detail
- Monthly dues
- $750 · $9,000/yr
- Likely covers
- water
Listing history 11 events
-
2026-06-10status $24,900 Pending 19 DOM
-
2026-06-09days on market $24,900 Active 19 DOM
-
2026-06-08days on market $24,900 Active 18 DOM
-
2026-06-07days on market $24,900 Active 17 DOM
-
2026-06-05days on market $24,900 Active 14 DOM
-
2026-06-03days on market $24,900 Active 13 DOM
-
2026-06-02days on market $24,900 Active 12 DOM
-
2026-06-01days on market $24,900 Active 11 DOM
-
2026-05-31days on market $24,900 Active 10 DOM
-
2026-05-30days on market $24,900 Active 9 DOM
-
2026-05-22$29,900 Active
ⓘ Source: listings_history table (triggers on properties + properties_extension) + one-shot
backfill from property_details.listing_events for pre-trigger history.
Nearby sold comps map
Loading sold comps map…
Walkable amenities ~0.75 mi
Loading nearby amenities…
Taxation est. · year 1
- Rental income
- $17,022
- − Mortgage interest
- −$1,395
- − Property taxes
- −$374
- − Insurance
- −$124
- − Repairs & maintenance
- −$1,362
- − Management
- −$1,362
- − HOA
- −$9,000
- − Depreciation
- −$724
- Taxable income
- $2,682
- Est. tax owed @ 24.0%
- −$644
- After-tax cash flow
- $1,739/yr
For passive investors: Depreciation is non-cash, so a rental often shows a tax loss while cash-flowing — sheltering income. Rental losses are passive: they offset passive income freely, and up to $25,000/yr can offset ordinary (W-2) income if you actively participate and your MAGI is under $100k (phasing out to $0 by $150k); unused losses carry forward. On sale, claimed depreciation is recaptured at up to 25%, and gains may owe capital-gains tax (a 1031 exchange can defer both). Figures are a year-1 estimate at your 24.0% rate — not tax advice; consult a CPA.
Schools (NCES district)
- District
- Spring Grove Area SD
- NCES district ID
- 4222590
- Math proficiency
- 45% ▼ -14.00%
- Reading proficiency
- 65% ▼ -9.00%
- Median HH income
- $64,950
- Composite
- 48.28/100
- National rank
- #2155
- State rank
- #98 of 539 in PA
Livability — New Salem
- Score
- 66/100
- State rank
- #1075
- US rank
- #12137
Category grades
Schools grade is shown separately in the Schools card above.
Census & demographics
- Population (ZIP)
- 6,970
Population outlook (York County) Hauer SSP2
- Today (2025)
- 454,205 people
- By 2030
- 457,407 · +0.7%
- By 2040
- 457,529 · +0.7%
- By 2050
- 448,261 · -1.3%
- By 2075
- 427,388 · -5.9%
- By 2100
- 384,218 · -15.4%
Race, ethnicity, and origin ACS 2023
- Neighborhood character
- Predominantly White (87%)
- Race & ethnicity
- White 87% Two or more races 6% Hispanic / Latino 5% Black 4%
- Hispanic origin (detail)
- Puerto Rican 3%
- Common ancestry
- Romanian 5% Polish 3% Lithuanian 1%
- Foreign-born
- 1% · Canada
- Languages at home
- 98% English-only · Spanish 2%
Political lean MEDSL · York
- 2024 margin
- Strong R (+25.3) · D 36.9% · R 62.1%
- 2008→2024 swing
- -11.7pp toward R · 2008: -13.6pp · 2024: -25.3pp
- All cycles
- 2024: R+25.3 2020: R+24.6 2016: R+29.3 2012: R+21.2 2008: R+13.6
Not yet ingested
- Civics
- —
Market trends
- HPI YoY
- ▼ -112.20%
- Current HPI
- 248.9386
- Rent YoY
- —
- Metro
- —
- State GDP YoY
- ▲ 1.68%
- F500 in state
- 34
Industry mix (Fortune 500 HQ in PA)
| Industry | F500 HQs | Revenue |
|---|---|---|
| Healthcare | 2 | $309B |
|
||
| Insurance | 2 | $27B |
|
||
| Telecommunications / Media | 1 | $124B |
|
||
| Industrial Distribution | 1 | $22B |
|
||
| Financial Services | 1 | $20B |
|
||
| Chemicals / Materials | 1 | $18B |
|
||
Price history
1 event — show timeline
- 2026-05-22 Listed $29,900 BRIGHT MLS
Cash-flow waterfall
monthlySold comps — $/sqft
last 12 mo · ≤1 miLoading sold comps…