 🏷️ Likely Rental
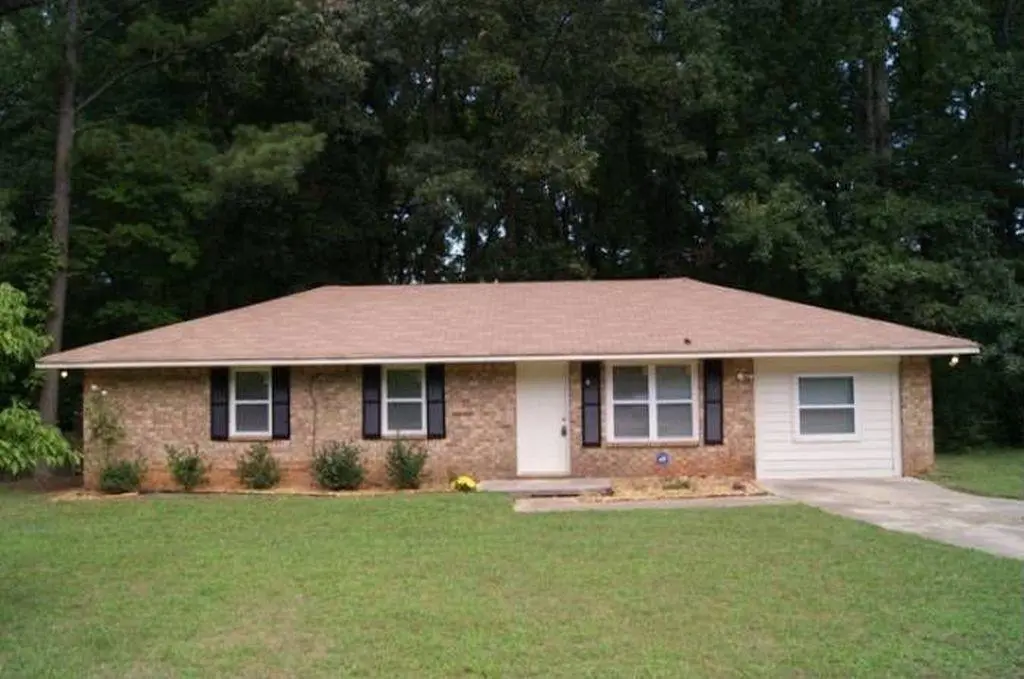
4358 Lincolndale Dr · Panthersville, GA
Flood risk 1/10 · Minimal
- FEMA flood zone
- X (unshaded)
- Chance of flooding over 30 yrs
- 0.0%
- Est. flood insurance / yr
- $507 – $1,088
Fire risk 3/10 · Minor
- Est. fire insurance / yr
- $963 – $1,789
Heat risk 5/10 · Moderate
- Hot days now (above 105°F)
- 6 days/yr
- Hot days in 30 yrs
- 16 days/yr
Wind risk 6/10 · Moderate
- Chance of severe wind over 30 yrs
- 27.0%
Air-quality risk 5/10 · Moderate
- Unhealthy air days now
- 6 days/yr
- Unhealthy air days in 30 yrs
- 8 days/yr
Risk factors via First Street. Map © Google.
Why this score? — see what drove the B+ grade
The composite is a weighted blend of 9 inputs, each scored 0–100. Each bar is that input's sub-score; the figure is the points it added to the 100-point composite (weight × sub-score).
- Cash flow +29.5/30.0
- ARV discount +15.0/15.0
- DSCR +10.0/10.0
- 1% rule +9.9/10.0
- Rent growth +3.6/5.0
- Livability +3.3/5.0
- Condition / age +2.5/5.0
- Schools +2.1/10.0
- Appreciation +0.0/10.0
$125,000
🖨 Deal sheet (PDF) 📄 Offer letter ✓ Due diligence
Listing remarks
INVESTORS ONLY. PROPERTY IS TENANT OCCUPIED, WITH LEASE EXPIRING 2/28/2027, PAYING $1395 PER MONTH. SHOWINGS WILL ONLY BE SCHEDULED ONCE UNDER CONTRACT DURING DUE DILIGENCE. NO FORMAL INSPECTION HAS BEEN DONE. CONDITION OF SYSTEMS, ROOF, ECT IS UNKNOWN. DO NOT USE SHOWING TIME. DO NOT DISTURB TENANT.
Key facts
- 0.3 acre lot
- Built 1980
- Listed 40 days
Property features AI
Exterior
- Utilities: Public water; Sewer: other/unspecified; Electric: other/unspecified; Cooling: other/unspecified; Heating: other/unspecified; Other utilities listed
- Home design: One-level home; Resale property
- Construction: Built with other/unspecified construction materials; Other/unspecified roof type
- Exterior features: Asphalt road access; Tax/legal description not provided
Interior
- Kitchen: Kitchen features not specified
- Bedrooms: Four bedrooms on the main level; Bedroom features not specified
- Bathrooms: Two full bathrooms on the main level; No master bathroom features listed
- Interior features: No common walls (detached); Other interior features
- Laundry & utility: Appliances listed as other (specifics not provided)
Neighborhood map
What this means for you Summary
Snapshot
- This is a 3-bed/2.0-bath single-family listed at $125k.
Deal economics
- At list price, monthly cash flow is $448 ($5k/yr) — positive.
- The deal already cash-flows at list — no discount required.
- Meets the 1% rule at list price ($2k rent vs $125k).
- Recommended offer: $121k (3.0% below list) — sets the bar for market timing.
- Cap rate 10.6% vs local median 5.3% in Panthersville — top-decile yield for the area; either an underpriced asset or a hidden risk that comps aren't pricing in. Stress-test before assuming the spread holds.
Location & tenants
- Location reads 66/100 on livability (#180 in GA) — a middle-class / working-renter tenant base. Strengths: cost of living A+, housing A+; Watch: crime C-, employment D, amenities F.
- Dekalb County (suburban): math 19% / reading 28% proficiency, ranked #125 of 174 in GA (top 72%) — low school quality limits family demand, transient renter base, plan for 1-2y turnover; 68% free/reduced lunch — lower-income household profile, screen leases tightly.
- Zoned schools: Oakview Elementary (math 5% / reading 5%, grade F, #1,160 of 1,228 statewide, top 98%, 668 students, 100% FRL); Cedar Grove Middle School (math 2% / reading 17%, grade F, #433 of 470 statewide, top 93%, 777 students, 100% FRL); Cedar Grove High School (math 8% / reading 17%, grade F, #336 of 424 statewide, top 80%, 1,123 students, 100% FRL) — zoned schools average 100% FRL vs 68% district-wide (32 pts higher); higher-poverty schools than district average — tighter screening recommended.
- Zoned-school proficiency averages 9% at this address vs 24% district-wide (-14 pts) — the specific schools serving this property underperform the Dekalb County average; the district grade overstates school quality for this exact location.
- Market conditions: Rents rising fast (+4.6%/yr); 254 active listings in the ZIP; 19 comparable units currently listed for rent nearby; rentals at typical pace (median 23d on market — plan ~3-4 weeks tenant-placement turnaround); solid renter incomes; 1,240 units permitted in DeKalb County in 2024 (385 in 5+ unit buildings).
Forward outlook
- Local home prices are declining (-3.0%/yr); year-one equity from $864 of loan paydown is wiped out by about $4k of value loss. Plan a longer hold.
- DeKalb County population projected at +28% by 2050 — long-run rental-demand tailwind backs the buy-and-hold thesis.
- At projected returns (-3.0% appreciation + 4.6% rent growth), your $35k cash investment doubles in ~7 years — after that, you're playing with house money.
Negotiation context
- It's been on market 40 days — a 3% lower offer ($121k) is reasonable based on typical stale-listing flexibility.
- Current owner paid $98k; 27% above their basis — modest negotiation headroom, anchor on the comps not their cost.
Risks & watch-outs
- Watch-outs: property tax is 3.0% of price.
- Climate carrying-cost: major wind risk, 27% chance of damaging wind over 30y; extreme-heat days projected 6→16/yr by 2055 (HVAC capex compounding) — expect insurance premiums to compound above CPI over the hold.
Questions for the listing agent
- It's been on market 40 days. Have you received any prior offers? Is the seller open to a 3% concession, seller financing, or rate buy-down credit?
- Property tax is high relative to price — has the assessment been appealed recently, and will the sale trigger a re-assessment?
- Is there a deadline driving the sale (1031 exchange, divorce, estate, relocation)? That informs how much negotiation room exists.
- Schools are D-rated, which usually means shorter tenancies and higher turnover. Who's the typical renter profile here, and what's been the actual vacancy rate?
- What's the average days-on-market for RENTAL listings here right now (not sales)? A rising rental-DOM trend means longer vacancies and softer asking-rent achievability than the comps imply.
- What's the recent tenant-quality profile in this submarket — average credit score on applications, eviction rate, late-payment / NSF rate, and stable-employment percentage? A property-management company in the area should have these aggregated.
- How much new for-sale + rental construction is in the pipeline within 1–3 miles? Heavy new supply typically softens prices + rents 12–24 months out; constrained supply supports both.
Investment metrics
- 1% rule
- 1.49% ✓
- Cap rate
- 10.59%
- Cash-on-cash
- 15.35%
- DSCR
- 1.68
- GRM
- 5.6
CMA / ARV
- ARV (median comp)
- $221,781
- List price
- $125,000
- Delta
- -43.64%
- Verdict
- UNDERPRICED
- Comps
- 20 within 1.0 mi
Show comp detail 8 sales within ~0.75 mi
| Address | Dist | Beds/Ba | Sqft | Sold | Price | $/sf | Match |
|---|---|---|---|---|---|---|---|
| 4342 Lincolndale Dr | 0.03mi | 3/2.5 | 992 (-6%) | 12mo | $170,500 | $172 | 77 |
| 3339 Clevemont Ct | 0.19mi | 3/2.0 | 1,150 (+10%) | 5mo | $210,000 | $183 | 71 |
| 4293 Westglen Rd | 0.37mi | 3/2.0 | 1,128 (+7%) | 14mo | $207,000 | $184 | 59 |
| 3501 Mosley Rd | 0.47mi | 3/2.0 | 980 (-7%) | 10mo | $43,000 | $44 | 58 |
| 3491 Oscors Rd | 0.39mi | 3/2.0 | 1,000 (-5%) | 23mo | $240,000 | $240 | 55 |
| 3406 Homeward Trl | 0.29mi | 3/2.0 | 1,176 (+12%) | 22mo | $197,000 | $168 | 48 |
| 3420 County Line Rd | 0.32mi | 3/2.0 | 936 (-11%) | 24mo | $289,900 | $310 | 47 |
| 3350 Homeward Trl | 0.33mi | 2/2.0 (-1) | 1,151 (+10%) | 22mo | $205,000 | $178 | 45 |
Match score weights: distance 35% · size 25% · config 20% · recency 20%. Top-matched comps best support the ARV.
Projected returns pro-forma
-3.0% appreciation · 4.56% rent growth · sell at horizon
- IRR
- 8.1%
- Equity multiple
- 1.32×
- Total profit
- $11,367
- Equity at exit
- $18,638
- IRR
- 18.9%
- Equity multiple
- 2.71×
- Total profit
- $59,732
- Equity at exit
- $10,808
Cash invested: $35,000 (down + closing). Projections, not guarantees.
Landlord ↔ Tenant lean methodology
- Overall (STATE)
- 90 Strongly Landlord-Friendly
- State Georgia
- 90 Strongly Landlord-Friendly · R+3
- County
- — inherits STATE
- City
- — inherits STATE
ZIP-level market 30294
- Home prices YoY
- -25.0%
- Rents YoY
- 4.6%
- Active inventory
- 254
- Price-to-rent
- 5.6×
Monthly cashflow live
- Estimated rent
- $1,864 high interval (Pro) →
- Mortgage (P&I)
- −$656
- Tax from tax record
- −$317 /mo · $3,807/yr
- Insurance
- −$52
- HOA
- −$0
- Vacancy / Maint / Mgmt
- −$391
- Net cashflow
- $448
Break-even live
Sensitivity live
| Price | -10% $519 | -5% $483 | +0% $448 | +5% $412 | +10% $377 |
|---|---|---|---|---|---|
| Rent | -10% $301 | -5% $374 | +0% $448 | +5% $521 | +10% $595 |
| Rate | -1.0pp $511 | -0.5pp $480 | base $448 | +0.5pp $415 | +1.0pp $383 |
UW: 25.0% down · 7.5% · 30yr · 1.5% tax · 5.0% vac · 8.0% maint · 8.0% mgmt
Financing live
Cash to close
- Down payment
- $31,250
- Closing costs
- $3,750
- Reserves months
- —
- Total cash needed
- —
Loan-product check · same deal, 3 products live
Conventional
25% down · 7.5% · 30yr
- Down + closing
- —
- Monthly P&I
- —
- Monthly cashflow
- —
- DSCR
- —
- Eligible?
- —
Personal DTI + credit; lowest rate.
DSCR
20% down · 8.5% · 30yr
- Down + closing
- —
- Monthly P&I
- —
- Monthly cashflow
- —
- DSCR
- —
- Eligible?
- —
No personal income docs; deal must DSCR.
Hard money
10% down · 12.0% · 12mo
- Down + closing
- —
- Monthly P&I
- —
- Monthly cashflow
- —
- DSCR
- —
- Eligible?
- —
Short-term bridge; refi at stabilization.
Rent comps 19 comps
| Address | Beds | Baths | Sqft | Rent | $/sqft | DOM | Units | Dist |
|---|---|---|---|---|---|---|---|---|
| 3335 Crestview Ct Ellenwood, GA | 3.0 | 2.5 | 1492 | $1,650 | $1.11 | 26d | 1 | 0.23mi |
| 4402 Davana Dr Ellenwood, GA | 3.0 | 1.0 | 1056 | $1,578 | $1.49 | 1d | 1 | 0.23mi |
| 3378 Homeward Trl Ellenwood, GA | 3.0 | 2.0 | 1176 | $1,695 | $1.44 | 22d | 1 | 0.26mi |
| 3342 Crestview Ct Ellenwood, GA | 3.0 | 2.0 | 1290 | $1,601 | $1.24 | 7d | 1 | 0.26mi |
| 3428 Homeward Trl Ellenwood, GA | 3.0 | 2.0 | 1242 | $1,795 | $1.45 | 14d | 1 | 0.30mi |
| 3303 Homeward Trl Ellenwood, GA | 3.0 | 2.0 | 1456 | $1,799 | $1.24 | 23d | 1 | 0.42mi |
| 4229 Catalpa Park Ellenwood, GA | 3.0 | 2.0 | 1280 | $1,675 | $1.31 | 45d | 1 | 0.75mi |
| 37 Poole Cir Ellenwood, GA | 3.0 | 2.0 | 1080 | $1,475 | $1.37 | 45d | 1 | 0.84mi |
| 39 Poole Cir Ellenwood, GA | 3.0 | 2.0 | 1080 | $1,475 | $1.37 | 14d | 1 | 0.85mi |
| 46 Poole Cir Ellenwood, GA | 3.0 | 2.0 | 1080 | $1,475 | $1.37 | 26d | 1 | 0.92mi |
| 48 Poole Cir Ellenwood, GA | 3.0 | 2.0 | 1080 | $1,475 | $1.37 | 20d | 1 | 0.93mi |
| 65 Poole Cir Ellenwood, GA | 3.0 | 2.0 | 1080 | $1,475 | $1.37 | 20d | 1 | 0.97mi |
| 67 Poole Cir Ellenwood, GA | 3.0 | 2.0 | 1080 | $1,475 | $1.37 | 20d | 1 | 0.98mi |
| 3821 River Rd Ellenwood, GA | 3.0 | 2.0 | 1455 | $2,195 | $1.51 | 45d | 1 | 0.99mi |
| 3637 Windmill Rd Ellenwood, GA | 3.0 | 1.0 | 1200 | $1,695 | $1.41 | 26d | 1 | 1.33mi |
| 3868 Leyland Dr Decatur, GA | 3.0 | 2.5 | 1312 | $1,923 | $1.47 | 45d | 1 | 1.39mi |
| 3862 Shane Ct Ellenwood, GA | 4.0 | 2.0 | 1372 | $1,750 | $1.28 | 1d | 1 | 1.39mi |
| 3830 Riverside Pkwy Decatur, GA | 3.0 | 2.5 | 1286 | $1,865 | $1.45 | 1d | 1 | 1.45mi |
| 4153 Ward Lake Trl Ellenwood, GA | 3.0 | 2.0 | 1460 | $1,930 | $1.32 | 45d | 1 | 1.50mi |
Listing history 22 events
-
2026-06-21days on market $125,000 Active 40 DOM
-
2026-06-18days on market $125,000 Active 37 DOM
-
2026-06-17days on market $125,000 Active 36 DOM
-
2026-06-16days on market $125,000 Active 35 DOM
-
2026-06-15days on market $125,000 Active 34 DOM
-
2026-06-13days on market $125,000 Active 32 DOM
-
2026-06-09days on market $125,000 Active 28 DOM
-
2026-06-08pricedays on market $125,000 Active 27 DOM
-
2026-06-07days on market $140,000 Active 26 DOM
-
2026-06-04days on market $140,000 Active 23 DOM
-
2026-06-03days on market $140,000 Active 22 DOM
-
2026-06-02days on market $140,000 Active 21 DOM
-
2026-06-01days on market $140,000 Active 20 DOM
-
2026-05-31days on market $140,000 Active 19 DOM
-
2026-05-12$140,000 Active 307-char remark
-
2011-05-07price $15,300 Reduced
-
2006-09-20soldstatus $98,500
-
1998-11-18soldstatus $77,500
-
1989-12-29soldstatus $39,808
-
1987-09-30soldstatus $46,800
-
1982-05-21soldstatus $40,800
-
1980-11-11soldstatus $39,200
ⓘ Source: listings_history table (triggers on properties + properties_extension) + one-shot
backfill from property_details.listing_events for pre-trigger history.
Tax reassessment forecast GA · Resets to sale price
- Current annual tax
- $3,807 · $317/mo
- Projected year-2 tax
- $3,807 · $317/mo
- Expected delta
- $0/yr ($0/mo · 0.0%)
ⓘ Screening estimate from a state-policy table — verify with the county assessor before closing.
Climate risk First Street
- Flood 1/10 Low FEMA zone X (unshaded) · 0% chance over 30 yrs
- Wildfire 3/10 Moderate
- Heat 5/10 Major 6 d/yr ≥105°F today · 16 d/yr by 30 yrs out
- Wind 6/10 Major 27% chance of damaging wind over 30 yrs
- Air quality 5/10 Major 6 unhealthy d/yr today · 8 by 30 yrs out
Nearby sold comps map
Loading sold comps map…
Walkable amenities ~0.75 mi
Loading nearby amenities…
Taxation est. · year 1
- Rental income
- $22,370
- − Mortgage interest
- −$7,002
- − Property taxes
- −$3,807
- − Insurance
- −$625
- − Repairs & maintenance
- −$1,790
- − Management
- −$1,790
- − Depreciation
- −$3,636
- Taxable income
- $3,721
- Est. tax owed @ 24.0%
- −$893
- After-tax cash flow
- $4,481/yr
For passive investors: Depreciation is non-cash, so a rental often shows a tax loss while cash-flowing — sheltering income. Rental losses are passive: they offset passive income freely, and up to $25,000/yr can offset ordinary (W-2) income if you actively participate and your MAGI is under $100k (phasing out to $0 by $150k); unused losses carry forward. On sale, claimed depreciation is recaptured at up to 25%, and gains may owe capital-gains tax (a 1031 exchange can defer both). Figures are a year-1 estimate at your 24.0% rate — not tax advice; consult a CPA.
Schools (NCES district)
- District
- Dekalb County
- NCES district ID
- 1301740
- Math proficiency
- 19% ▼ -12.00%
- Reading proficiency
- 28% ▼ -7.00%
- Median HH income
- $51,448
- Composite
- 20.92/100
- National rank
- #8482
- State rank
- #125 of 174 in GA
Livability — Panthersville
- Score
- 66/100
- State rank
- #180
- US rank
- #11244
Category grades
Schools grade is shown separately in the Schools card above.
Census & demographics
- County
- Henry County · 316,359 people
- Metro
- Atlanta-Sandy Springs-Alpharetta, GA
- Population (ZIP)
- 41,983
- Household income
- $79,762
- Rent vs Own
- Severe rent burden
- 864.0
Population outlook (DeKalb County) Hauer SSP2
- Today (2025)
- 839,977 people
- By 2030
- 891,768 · +6.2%
- By 2040
- 988,894 · +17.7%
- By 2050
- 1,074,583 · +27.9%
- By 2075
- 1,245,026 · +48.2%
- By 2100
- 1,303,135 · +55.1%
Race, ethnicity, and origin ACS 2023
- Neighborhood character
- Predominantly Black (84%)
- Race & ethnicity
- Black 84% Hispanic / Latino 7% Two or more races 6% White 6% Asian 1%
- Hispanic origin (detail)
- Mexican 6%
- Common ancestry
- Hispanic 1%
- Foreign-born
- 7% · Canada, Vietnam
- Languages at home
- 91% English-only · Spanish 6% Vietnamese 1% French/Haitian/Cajun 1%
Political lean MEDSL · DeKalb
- 2024 margin
- Solid D (+64.8) · D 81.9% · R 17.1% · Other 1.0%
- 2008→2024 swing
- +6.1pp toward D · 2008: 58.6pp · 2024: 64.8pp
- All cycles
- 2024: D+64.8 2020: D+67.4 2016: D+64.8 2012: D+56.8 2008: D+58.6
Not yet ingested
- Civics
- —
Market trends
- HPI YoY
- ▼ -70.99%
- Current HPI
- 213.1999
- Rent YoY
- ▲ 4.56%
- Metro
- Atlanta-Sandy Springs-Alpharetta, GA
- State GDP YoY
- ▲ 2.66%
- F500 in state
- 28
Industry mix (Fortune 500 HQ in GA)
| Industry | F500 HQs | Revenue |
|---|---|---|
| Paper / Packaging | 2 | $29B |
|
||
| Retail | 1 | $160B |
|
||
| Transportation / Logistics | 1 | $91B |
|
||
| Airlines | 1 | $62B |
|
||
| Consumer Goods | 1 | $47B |
|
||
| Utilities | 1 | $25B |
|
||
Price history
+218.9% since first listed9 events — show timeline
- 2026-06-08 Price Changed $125,000 FMLS
- 2026-05-12 Listed $140,000 FMLS
- 2011-05-07 Price Changed $15,300 GAMLS
- 2006-09-20 Sold (Public Records) $98,500 Public Records
- 1998-11-18 Sold (Public Records) $77,500 Public Records
- 1989-12-29 Sold (Public Records) $39,808 Public Records
- 1987-09-30 Sold (Public Records) $46,800 Public Records
- 1982-05-21 Sold (Public Records) $40,800 Public Records
- 1980-11-11 Sold (Public Records) $39,200 Public Records
Property tax history
+7.8%/yrLatest (2025): $3,807 · +62.3% YoY. Source: county tax records.
Cash-flow waterfall
monthlySold comps — $/sqft
last 12 mo · ≤1 miLoading sold comps…