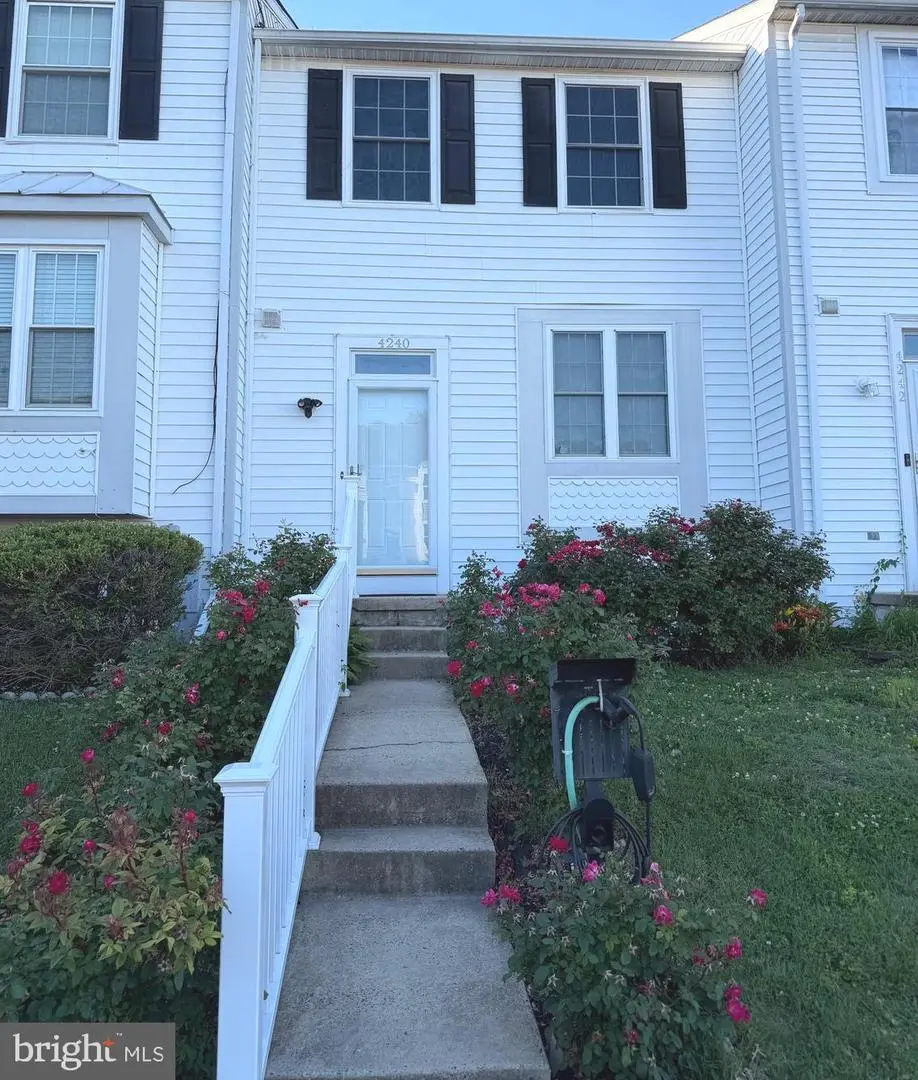
4240 Chapel Gate Pl · Riverside, MD
Flood risk 1/10 · Minimal
- FEMA flood zone
- X (unshaded)
- Chance of flooding over 30 yrs
- 0.0%
- Est. flood insurance / yr
- $473 – $860
Fire risk 1/10 · Minimal
- Est. fire insurance / yr
- $755 – $1,403
Heat risk 8/10 · Major
- Hot days now (above 105°F)
- 7 days/yr
- Hot days in 30 yrs
- 15 days/yr
Wind risk 6/10 · Moderate
- Chance of severe wind over 30 yrs
- 27.0%
Air-quality risk 3/10 · Minor
- Unhealthy air days now
- 2 days/yr
- Unhealthy air days in 30 yrs
- 3 days/yr
Risk factors via First Street. Map © Google.
Why this score? — see what drove the D grade
The composite is a weighted blend of 9 inputs, each scored 0–100. Each bar is that input's sub-score; the figure is the points it added to the 100-point composite (weight × sub-score).
- Cash flow +10.2/30.0
- ARV discount +8.0/15.0
- Appreciation +5.0/10.0
- Livability +4.0/5.0
- DSCR +2.9/10.0
- Schools +2.9/10.0
- 1% rule +2.7/10.0
- Rent growth +2.5/5.0
- Condition / age +2.5/5.0
$289,900
🖨 Deal sheet (PDF) 📄 Offer letter ✓ Due diligence
Listing remarks MLS
This home is a hop and a skip from I95, Rt 7, and Rt 40, within 5 miles of Aberdeen and Edgewood Proving Grounds. This home is currently a month-to-month rental, but it's ready for your particular color of paint, if you really want to put your touch on it. The basement is being used as an office, but that bathroom makes it a very nice bedroom idea with a full bathroom, for maybe an older teen or just a theater room away from the kids while you wait for the laundry room to finish the last cycle. The glass kitchen cabinets, island, and stainless appliances are something that you would have to see, but the 2 bedrooms are massive, with a "Jack and Jill" bathroom to the master bedroom. Start or end your nights with some local walking trails, or grab some good food from one of the local spots. This house is in the middle of all the local activity.
Key facts
- $93 HOA
- 2 parking spots
- Community pool
Property features AI
Finance
- Other: Not in a federal flood zone; Land assessed separately; Located in city limits (urban setting); Blacktop road access; Ground rent paid annually
- Financial info: Fee simple ownership
- HOA & community: Monthly HOA fee of $75; Quarterly condo/coop fee of $55; HOA covers lawn maintenance and common area maintenance; Property manager present; Pets allowed on a case-by-case basis
Exterior
- Parking: Off-street parking
- Utilities: Public water; Public sewer; 200+ amp electric service; Electric hot water
- Home design: Interior townhouse/rowhouse; Main entrance faces south; Entry level is 1
- Construction: Frame construction; Block foundation; Composite roof
- Exterior features: Picket rear fencing; Backs to trees; Interior lot; Sloping lot; Level entry at main
Interior
- Bedrooms: Three bedrooms on the upper level
- Flooring: Laminate flooring; Fully carpeted areas
- Bathrooms: Two full bathrooms; One half bathroom
- Heating & cooling: Heat pump heating; Central air conditioning
- Interior features: Drywall walls and ceilings; Fully finished basement (100% finished)
Neighborhood map
What this means for you Summary
Snapshot
- This is a 3-bed/2.5-bath townhouse listed at $290k.
Deal economics
- At list price, monthly cash flow is $-166 ($-2k/yr) — negative.
- To cash-flow at today's rent, offer at most $261k (10.1% below list).
- To meet the 1% rule (rent ≥ 1% of price), the offer needs to be $222k (23.3% below list).
- Recommended offer: $222k (23.3% below list) — sets the bar for 1% rule.
- Cap rate 5.6% vs local median 3.7% in Riverside — top-decile yield for the area; either an underpriced asset or a hidden risk that comps aren't pricing in. Stress-test before assuming the spread holds.
Location & tenants
- Location reads 79/100 on livability (#58 in MD, #2,187 nationally) — a middle-class / working-renter tenant base. Strengths: employment A+, housing A+, health & safety A+; Watch: crime D, amenities F.
- Harford County Public Schools (suburban): math 22% / reading 39% proficiency, ranked #9 of 24 in MD (top 38%) — families likely to look elsewhere, expect single-tenant / working-renter base with shorter leases.
- Zoned schools: Church Creek Elementary (math 11% / reading 21%, grade F, #441 of 860 statewide, top 52%, 725 students, 58% FRL); Aberdeen Middle (math 5% / reading 27%, grade F, #183 of 225 statewide, top 84%, 1,082 students, 63% FRL); Aberdeen High (math 47% / reading 56%, grade D+, #105 of 222 statewide, top 47%, 1,495 students, 53% FRL) — zoned schools average 58% FRL vs 24% district-wide (34 pts higher); higher-poverty schools than district average — tighter screening recommended.
- Market conditions: 17 active listings in the ZIP; 15 comparable units currently listed for rent nearby; rentals at typical pace (median 26d on market — plan ~3-4 weeks tenant-placement turnaround); 47% of comp listings sitting > 30 days — soft ceiling on asking rent; solid renter incomes; 803 units permitted in Harford County in 2024 (26 in 5+ unit buildings).
Forward outlook
- In year one you build about $2k of equity ($2k loan paydown + $16 appreciation (0.0% local appreciation)).
Negotiation context
- It's been on market 16 days — a 2% lower offer ($286k) is reasonable based on typical stale-listing flexibility.
- 2 sale attempts since 19y ago; this cycle's ask is 35% above the opening price — seller raised mid-cycle; expect resistance to lowballs.
- Current owner paid $225k; 29% above their basis — modest negotiation headroom, anchor on the comps not their cost.
Risks & watch-outs
- Climate carrying-cost: major wind risk, 27% chance of damaging wind over 30y; extreme-heat days projected 7→15/yr by 2055 (HVAC capex compounding) — expect insurance premiums to compound above CPI over the hold.
Questions for the listing agent
- What do current leases actually rent for vs. the listed asking? Can we see a recent rent roll and the last 12 months of T-12 income?
- What does the HOA fee cover, when was the last increase, and are there any pending special assessments or reserve-fund shortfalls?
- Is there a deadline driving the sale (1031 exchange, divorce, estate, relocation)? That informs how much negotiation room exists.
- Schools are D-rated, which usually means shorter tenancies and higher turnover. Who's the typical renter profile here, and what's been the actual vacancy rate?
- Crime grade is D in this area — have there been break-ins, vandalism, or insurance claims at this property in the last 3 years? What carrier currently insures it and at what premium?
- The area grade is low — what's the realistic commute time and amenity access for the typical tenant pool here? Any planned neighborhood developments (good or bad) we should know about?
- What's the average days-on-market for RENTAL listings here right now (not sales)? A rising rental-DOM trend means longer vacancies and softer asking-rent achievability than the comps imply.
- What's the recent tenant-quality profile in this submarket — average credit score on applications, eviction rate, late-payment / NSF rate, and stable-employment percentage? A property-management company in the area should have these aggregated.
- How much new for-sale + rental construction is in the pipeline within 1–3 miles? Heavy new supply typically softens prices + rents 12–24 months out; constrained supply supports both.
Investment metrics
- 1% rule
- 0.77% ✗
- Cap rate
- 5.61%
- Cash-on-cash
- -2.45%
- DSCR
- 0.89
- GRM
- 10.9
CMA / ARV
- ARV (on-the-fly)
- $293,080
- Comps found
- 12
Show comp detail 12 sales within ~0.75 mi
| Address | Dist | Beds/Ba | Sqft | Sold | Price | $/sf | Match |
|---|---|---|---|---|---|---|---|
| 4205 Goodson Ct | 0.08mi | 3/2.5 | 1,728 (+0%) | 6mo | $267,500 | $155 | 90 |
| 4326 Gilmer Ct | 0.13mi | 3/2.0 | 1,664 (-4%) | 0mo | $289,900 | $174 | 86 |
| 4252 Chapel Gate Pl | 0.02mi | 4/2.5 (+1) | 1,703 (-1%) | 8mo | $270,000 | $159 | 86 |
| 4211 Chapelgate Pl | 0.09mi | 3/2.5 | 1,854 (+8%) | 4mo | $295,000 | $159 | 80 |
| 4320 Gilmer Ct | 0.12mi | 3/2.0 | 1,550 (-10%) | 3mo | $311,000 | $201 | 73 |
| 4242 Goodson Ct | 0.06mi | 2/3.0 (-1) | 1,544 (-10%) | 1mo | $271,000 | $176 | 72 |
| 4405 Danbury Sq | 0.26mi | 3/2.5 | 1,548 (-10%) | 4mo | $315,000 | $203 | 67 |
| 1312 Germander Dr | 0.42mi | 4/1.5 (+1) | 1,710 (-1%) | 4mo | $283,500 | $166 | 67 |
| 1310 Germander Dr | 0.42mi | 3/2.0 | 1,620 (-6%) | 7mo | $275,000 | $170 | 63 |
| 1433 Golden Rod Ct #1433 | 0.45mi | 2/2.5 (-1) | 1,608 (-7%) | 3mo | $278,000 | $173 | 60 |
| 4342 Downs Sq | 0.61mi | 2/1.5 (-1) | 1,836 (+6%) | 7mo | $275,000 | $150 | 46 |
| 1437 Golden Rod Ct #1437 | 0.44mi | 4/2.0 (+1) | 1,946 (+13%) | 8mo | $220,000 | $113 | 44 |
Match score weights: distance 35% · size 25% · config 20% · recency 20%. Top-matched comps best support the ARV.
Projected returns pro-forma
0.01% appreciation · 3.0% rent growth · sell at horizon
- IRR
- -5.0%
- Equity multiple
- 0.77×
- Total profit
- $-18,991
- Equity at exit
- $84,259
- IRR
- 0.9%
- Equity multiple
- 1.10×
- Total profit
- $7,905
- Equity at exit
- $101,348
Cash invested: $81,172 (down + closing). Projections, not guarantees.
Landlord ↔ Tenant lean methodology
- Overall (STATE)
- 27 Tenant-Leaning
- State Maryland
- 27 Tenant-Leaning · D+14
- County
- — inherits STATE
- City
- — inherits STATE
ZIP-level market 21017
- Home prices YoY
- 0.0%
- Active inventory
- 17
- Price-to-rent
- 10.9×
Monthly cashflow live
- Estimated rent
- $2,224 high interval (Pro) →
- Mortgage (P&I)
- −$1,520
- Tax from tax record
- −$189 /mo · $2,268/yr
- Insurance
- −$121
- HOA
- −$93
- Vacancy / Maint / Mgmt
- −$467
- Net cashflow
- $-166
Break-even live
Sensitivity live
| Price | -10% $-2 | -5% $-84 | +0% $-166 | +5% $-248 | +10% $-330 |
|---|---|---|---|---|---|
| Rent | -10% $-342 | -5% $-254 | +0% $-166 | +5% $-78 | +10% $10 |
| Rate | -1.0pp $-20 | -0.5pp $-92 | base $-166 | +0.5pp $-241 | +1.0pp $-318 |
UW: 25.0% down · 7.5% · 30yr · 1.5% tax · 5.0% vac · 8.0% maint · 8.0% mgmt
Financing live
Cash to close
- Down payment
- $72,475
- Closing costs
- $8,697
- Reserves months
- —
- Total cash needed
- —
Loan-product check · same deal, 3 products live
Conventional
25% down · 7.5% · 30yr
- Down + closing
- —
- Monthly P&I
- —
- Monthly cashflow
- —
- DSCR
- —
- Eligible?
- —
Personal DTI + credit; lowest rate.
DSCR
20% down · 8.5% · 30yr
- Down + closing
- —
- Monthly P&I
- —
- Monthly cashflow
- —
- DSCR
- —
- Eligible?
- —
No personal income docs; deal must DSCR.
Hard money
10% down · 12.0% · 12mo
- Down + closing
- —
- Monthly P&I
- —
- Monthly cashflow
- —
- DSCR
- —
- Eligible?
- —
Short-term bridge; refi at stabilization.
Rent comps 15 comps
| Address | Beds | Baths | Sqft | Rent | $/sqft | DOM | Units | Dist |
|---|---|---|---|---|---|---|---|---|
| 1335 Stockett Sq Belcamp, MD | 3.0 | 1.5 | 1152 | $1,950 | $1.69 | 45d | 1 | 0.08mi |
| 4203 Chapel Gate Pl Belcamp, MD | 3.0 | 2.5 | 1236 | $2,419 | $1.96 | 6d | 1 | 0.09mi |
| 4330 Gilmer Ct Belcamp, MD | 3.0 | 1.5 | 1694 | $2,200 | $1.30 | 25d | 1 | 0.16mi |
| 1303 Sandwort Ct #102 Belcamp, MD | 3.0 | 2.0 | 1232 | $2,200 | $1.79 | 19d | 1 | 0.35mi |
| 1300 Liriope Ct Belcamp, MD | 1.0–3.0 | 1.0–2.0 | 974 | $2,280 | $2.34 | 4d | 19 | 0.40mi |
| 1300 Liriope Ct Belcamp, MD | 1.0–3.0 | 1.0–2.0 | 974 | $2,249 | $2.31 | 45d | 32 | 0.40mi |
| 1250 Independence Sq Belcamp, MD | 3.0 | 1.5 | 1152 | $1,950 | $1.69 | 45d | 1 | 0.42mi |
| 1402 Golden Rod Ct #5 Belcamp, MD | 2.0 | 2.0 | 1100 | $1,650 | $1.50 | 45d | 1 | 0.49mi |
| 1414 Primrose Pl Belcamp, MD | 2.0 | 1.5 | 1664 | $1,750 | $1.05 | 46d | 1 | 0.50mi |
| 1427 Sedum Sq Belcamp, MD | 4.0 | 2.5 | 2010 | $2,500 | $1.24 | 6d | 1 | 0.60mi |
| 1405 Garcia Ct Aberdeen, MD | 3.0 | 3.0 | 1644 | $2,692 | $1.64 | 46d | 1 | 0.69mi |
| 1405 Garcia Ct Aberdeen, MD | 3.0 | 2.0 | 1335 | $2,507 | $1.88 | 12d | 1 | 0.69mi |
| 1405 Garcia Ct Aberdeen, MD | 3.0 | 2.0 | 1335 | $2,429 | $1.82 | 25d | 1 | 0.69mi |
| 4307 Greys Run Cir Belcamp, MD | 3.0 | 1.5 | 1605 | $2,600 | $1.62 | 45d | 1 | 0.73mi |
| 2786 Megan Way Bel Air, MD | 1.0–2.0 | 1.0–2.0 | 1092 | $2,490 | $2.28 | 0d | 30 | 1.15mi |
HOA detail
- Monthly dues
- $93 · $1,116/yr
- Likely covers
- landscaping
Listing history 13 events
-
2026-06-21days on market $289,900 Active 16 DOM
-
2026-06-18days on market $289,900 Active 13 DOM
-
2026-06-17days on market $289,900 Active 12 DOM
-
2026-06-16days on market $289,900 Active 11 DOM
-
2026-06-15price $289,900 Active 10 DOM
-
2026-06-15days on market $299,900 Active 10 DOM
-
2026-06-13days on market $299,900 Active 8 DOM
-
2026-06-09days on market $299,900 Active 4 DOM
-
2026-06-08days on market $299,900 Active 3 DOM
-
2026-06-07status $299,900 Active 2 DOM
-
2026-06-04days on market $299,900 Coming Soon 2 DOM
-
2026-06-03remarks 699-char remark
-
2026-06-03$299,900 Coming Soon 1 DOM
ⓘ Source: listings_history table (triggers on properties + properties_extension) + one-shot
backfill from property_details.listing_events for pre-trigger history.
Tax reassessment forecast MD · Partial reset (capped growth)
- Current annual tax
- $2,268 · $189/mo
- Projected year-2 tax
- $2,714 · $226/mo
- Expected delta
- +$446/yr (+$37/mo · 19.7%)
ⓘ Screening estimate from a state-policy table — verify with the county assessor before closing.
Climate risk First Street
- Flood 1/10 Low FEMA zone X (unshaded) · 0% chance over 30 yrs
- Wildfire 1/10 Low
- Heat 8/10 Severe 7 d/yr ≥105°F today · 15 d/yr by 30 yrs out
- Wind 6/10 Major 27% chance of damaging wind over 30 yrs
- Air quality 3/10 Moderate 2 unhealthy d/yr today · 3 by 30 yrs out
Nearby sold comps map
Loading sold comps map…
Walkable amenities ~0.75 mi
Loading nearby amenities…
Taxation est. · year 1
- Rental income
- $26,690
- − Mortgage interest
- −$16,239
- − Property taxes
- −$2,268
- − Insurance
- −$1,450
- − Repairs & maintenance
- −$2,135
- − Management
- −$2,135
- − HOA
- −$1,116
- − Depreciation
- −$8,433
- Taxable loss
- −$7,086
- Est. tax savings @ 24.0%
- +$1,701
- After-tax cash flow
- $-291/yr
For passive investors: Depreciation is non-cash, so a rental often shows a tax loss while cash-flowing — sheltering income. Rental losses are passive: they offset passive income freely, and up to $25,000/yr can offset ordinary (W-2) income if you actively participate and your MAGI is under $100k (phasing out to $0 by $150k); unused losses carry forward. On sale, claimed depreciation is recaptured at up to 25%, and gains may owe capital-gains tax (a 1031 exchange can defer both). Figures are a year-1 estimate at your 24.0% rate — not tax advice; consult a CPA.
Schools (NCES district)
- District
- Harford County Public Schools
- NCES district ID
- 2400390
- Math proficiency
- 22% ▼ -23.00%
- Reading proficiency
- 39% ▼ -12.00%
- Median HH income
- $79,569
- Composite
- 29.38/100
- National rank
- #6527
- State rank
- #9 of 24 in MD
Livability — Riverside
- Score
- 79/100
- State rank
- #58
- US rank
- #2187
Category grades
Schools grade is shown separately in the Schools card above.
Census & demographics
- Census place
- Riverside, MD
- County
- Harford County · 198,512 people
- City population
- 6,404
- Metro
- Baltimore-Columbia-Towson, MD
- Population (ZIP)
- 6,648
- Household income
- $106,831
- Rent vs Own
- Severe rent burden
- 96.0
Population outlook (Harford County) Hauer SSP2
- Today (2025)
- 262,292 people
- By 2030
- 266,437 · +1.6%
- By 2040
- 269,954 · +2.9%
- By 2050
- 265,659 · +1.3%
- By 2075
- 252,886 · -3.6%
- By 2100
- 224,014 · -14.6%
Race, ethnicity, and origin ACS 2023
- Neighborhood character
- Majority White (62%)
- Race & ethnicity
- White 62% Black 26% Hispanic / Latino 6% Two or more races 6% Asian 2%
- Hispanic origin (detail)
- Puerto Rican 3%
- Common ancestry
- Romanian 5% Lithuanian 2%
- Foreign-born
- 8% · Canada
- Languages at home
- 90% English-only · Spanish 5% Russian/Polish/Slavic 2% Tagalog/Filipino 1%
Political lean MEDSL · Harford
- 2024 margin
- R (+13.8) · D 41.9% · R 55.7% · Other 2.4%
- 2008→2024 swing
- +5.0pp toward D · 2008: -18.8pp · 2024: -13.8pp
- All cycles
- 2024: R+13.8 2020: R+12.0 2016: R+24.5 2012: R+19.5 2008: R+18.8
Not yet ingested
- Civics
- —
Market trends
- HPI YoY
- ▬ 0.01%
- Current HPI
- 246.6348
- Rent YoY
- —
- Metro
- Baltimore-Columbia-Towson, MD
- State GDP YoY
- ▲ 2.97%
- F500 in state
- 12
Industry mix (Fortune 500 HQ in MD)
| Industry | F500 HQs | Revenue |
|---|---|---|
| Aerospace / Defense | 1 | $71B |
|
||
| Utilities | 1 | $25B |
|
||
| Hotels | 1 | $24B |
|
||
| Consumer Goods | 1 | $7B |
|
||
| Real Estate | 1 | $6B |
|
||
| Chemicals | 1 | $2B |
|
||
Price history
-57.4% since first listed13 events — show timeline
- 2026-06-03 Coming Soon $299,900 BRIGHT MLS
- 2021-05-05 Sold (Public Records) $225,000 Public Records
- 2021-05-05 Sold (Public Records) $225,000 Public Records
- 2021-04-30 Sold (MLS) $225,000 BRIGHT MLS
- 2021-04-23 Pending — BRIGHT MLS
- 2021-03-29 Contingent — BRIGHT MLS
- 2021-03-23 Listed $215,000 BRIGHT MLS
- 2007-08-08 Sold (Public Records) $212,500 Public Records
- 2007-07-19 Sold (MLS) $212,500 MRIS
- 2007-06-01 Delisted — MRIS
- 2007-04-14 Listed $209,500 MRIS
- 1992-02-10 Sold (Public Records) $92,785 Public Records
- 1991-04-17 Sold (Public Records) $703,500 Public Records
Property tax history
+1.3%/yrLatest (2025): $2,268 · +8.2% YoY. Source: county tax records.
Cash-flow waterfall
monthlySold comps — $/sqft
last 12 mo · ≤1 miLoading sold comps…