330 3rd Ave Unit 9A · New York, NY
Flood risk 1/10 · Minimal
- FEMA flood zone
- X (unshaded)
- Chance of flooding over 30 yrs
- 0.0%
- Est. flood insurance / yr
- $507 – $1,088
Fire risk 1/10 · Minimal
- Est. fire insurance / yr
- $691 – $1,283
Heat risk 7/10 · Major
- Hot days now (above 99°F)
- 7 days/yr
- Hot days in 30 yrs
- 15 days/yr
Wind risk 6/10 · Moderate
- Chance of severe wind over 30 yrs
- 27.0%
Air-quality risk 4/10 · Minor
- Unhealthy air days now
- 5 days/yr
- Unhealthy air days in 30 yrs
- 7 days/yr
Risk factors via First Street. Map © Google.
Why this score? — see what drove the C- grade
The composite is a weighted blend of 9 inputs, each scored 0–100. Each bar is that input's sub-score; the figure is the points it added to the 100-point composite (weight × sub-score).
- Cash flow +10.0/30.0
- Appreciation +7.9/10.0
- ARV discount +7.5/15.0
- 1% rule +6.9/10.0
- Schools +5.0/10.0
- Rent growth +3.8/5.0
- Livability +3.8/5.0
- DSCR +2.9/10.0
- Condition / age +2.5/5.0
$675,000
🖨 Deal sheet 📄 Offer letter ✓ Due diligence
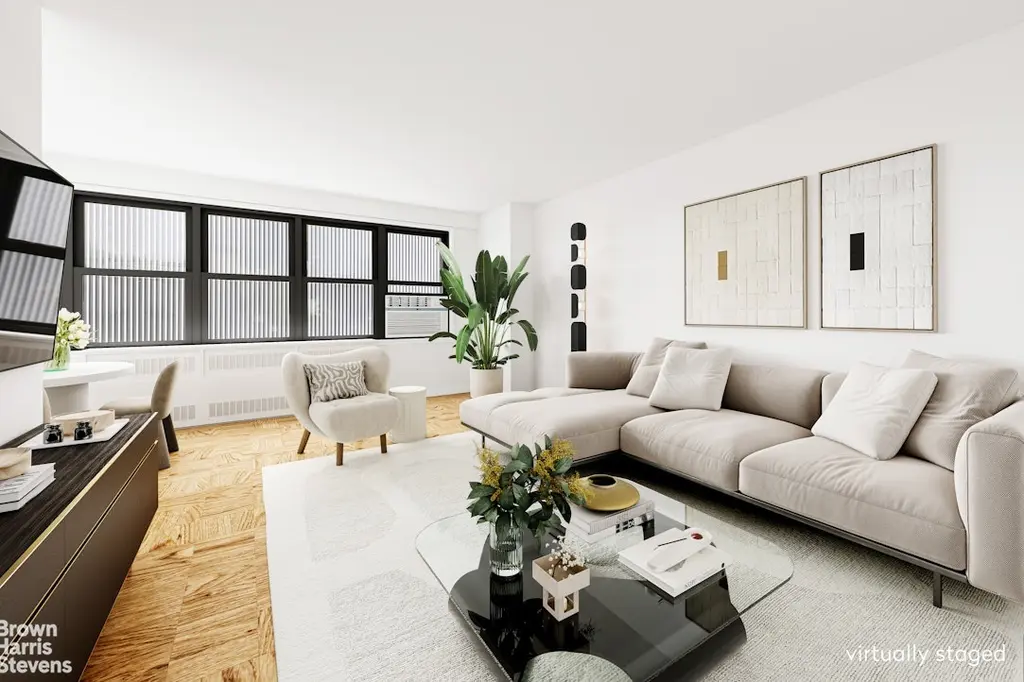
Listing remarks
Peaceful, oversized junior four offering exceptional flexibility as a convertible two-bedroom, complete with a spacious dining alcove ideal for a home office or second bedroom. The expansive living room provides ample room for both comfortable living and effortless entertaining. The recently renovated kitchen features sleek maple cabinetry, quartz countertops, and top-of-the-line stainless steel appliances. A beautifully updated, spa-like bathroom is outfitted with modern fixtures and a deep soaking tub for ultimate relaxation. The king-size primary bedroom easily accommodates nightstands and additional furnishings, while the thoughtfully designed layout offers abundant closet space and
Key facts
- Dining alcove
- Junior four
- Renovated kitchen
Tags
Property features AI
Finance
- Other: Multifamily building with 206 total units; Pets allowed in building (restrictions apply)
- HOA & community: Monthly association fee of $2,080
Exterior
- Parking: Has garage
- Home design: Located on entry level 9; Building has 20 stories
- Construction: Building name: 330 Third Avenue; Elevator building
- Exterior features: No notable exterior features listed; West exposure
Interior
- Bedrooms: Total of 4 rooms (includes bedrooms and living spaces)
- Bathrooms: 1 full bathroom
- Heating & cooling: Has cooling
- Interior features: Dining area
- Laundry & utility: Building laundry
Neighborhood map
What this means for you Summary
Snapshot
- This is a 2-bed/1.0-bath condo listed at $675k.
Deal economics
- At list price, monthly cash flow is $-406 ($-5k/yr) — negative.
- To cash-flow at today's rent, offer at most $616k (8.7% below list).
- Meets the 1% rule at list price ($8k rent vs $675k).
- Recommended offer: $616k (8.7% below list) — sets the bar for cash-flow.
- Cap rate 5.6% vs local median 2.6% in New York — top-decile yield for the area; either an underpriced asset or a hidden risk that comps aren't pricing in. Stress-test before assuming the spread holds.
Location & tenants
- Location reads 75/100 on livability (#268 in NY, #4,188 nationally) — a middle-class / working-renter tenant base. Strengths: amenities A+, commute A+, health & safety A; Watch: crime F, cost of living F.
- Market conditions: Rents rising fast (+5.1%/yr); 232 active listings in the ZIP; 40 comparable units currently listed for rent nearby; rentals leasing fast (median 8d on market — plan ~1-2 weeks tenant-placement turnaround); high-income renter base; 4,467 units permitted in New York County in 2024 (4,463 in 5+ unit buildings).
- At $8,023/mo this rent would consume 66% of the median local household income ($145k/yr) (locally 2470% of renters already pay >50% of income on rent) — very limited rent-growth headroom before tenants either downsize or default.
Forward outlook
- In year one you build about $43k of equity ($5k loan paydown + $38k appreciation (5.7% local appreciation)).
- New York County population projected at +21% by 2050 — long-run rental-demand tailwind backs the buy-and-hold thesis.
- By year 2, paydown + projected appreciation supports a ~$69k cash-out refi (75% LTV) — recoverable capital for the next deal without selling this one.
Negotiation context
- It's been on market 70 days — a 6% lower offer ($634k) is reasonable based on typical stale-listing flexibility.
- 2 sale attempts since 3y ago; this cycle's ask has dropped $50k (7%) from the opening price — seller is motivated, your offer sets the floor, not the list.
Risks & watch-outs
- Watch-outs: HOA is 26% of rent.
- Climate carrying-cost: major wind risk, 27% chance of damaging wind over 30y; extreme-heat days projected 7→15/yr by 2055 (HVAC capex compounding) — expect insurance premiums to compound above CPI over the hold.
Questions for the listing agent
- What do current leases actually rent for vs. the listed asking? Can we see a recent rent roll and the last 12 months of T-12 income?
- It's been on market 70 days. Have you received any prior offers? Is the seller open to a 9% concession, seller financing, or rate buy-down credit?
- Built in 1964 — when were the roof, HVAC, electrical panel, plumbing, and water heater last replaced?
- What does the HOA fee cover, when was the last increase, and are there any pending special assessments or reserve-fund shortfalls?
- Any open or pending special assessments — roof, HVAC, plumbing, elevator, façade? What's the per-unit balance and payoff schedule, and is the seller paying it off at close or rolling it to the buyer?
- Why hasn't it sold? Are there any deal-killer items the seller is aware of (foundation, flood, title, zoning, code violations)?
- Is there a deadline driving the sale (1031 exchange, divorce, estate, relocation)? That informs how much negotiation room exists.
- Schools are B-rated — typically a magnet for longer-tenancy family renters. What's the average tenant stay here, and is there a school-zone premium baked into asking?
- Crime grade is F in this area — have there been break-ins, vandalism, or insurance claims at this property in the last 3 years? What carrier currently insures it and at what premium?
- What's the average days-on-market for RENTAL listings here right now (not sales)? A rising rental-DOM trend means longer vacancies and softer asking-rent achievability than the comps imply.
- What's the recent tenant-quality profile in this submarket — average credit score on applications, eviction rate, late-payment / NSF rate, and stable-employment percentage? A property-management company in the area should have these aggregated.
- How much new apartment / multifamily construction is in the pipeline within 1–3 miles? Heavy new supply (>2% of stock underway) typically softens rents 12–24 months out; light construction supports rent growth.
Investment metrics
- 1% rule
- 1.19% ✓
- Cap rate
- 5.57%
- Cash-on-cash
- -2.58%
- DSCR
- 0.89
- GRM
- 7.0
CMA / ARV
No comps found within radius.
Projected returns pro-forma
5.7% appreciation · 5.08% rent growth · sell at horizon
- IRR
- 13.8%
- Equity multiple
- 1.93×
- Total profit
- $175,580
- Equity at exit
- $411,608
- IRR
- 15.5%
- Equity multiple
- 4.07×
- Total profit
- $580,786
- Equity at exit
- $735,688
Cash invested: $189,000 (down + closing). Projections, not guarantees.
Landlord ↔ Tenant lean methodology
- Overall (CITY)
- 0 Strongly Tenant-Friendly
- State New York
- 15 Strongly Tenant-Friendly · D+10
- County
- — inherits STATE
- City New York
- 0 Strongly Tenant-Friendly · D+34
ZIP-level market 10010
- Home prices YoY
- 2.0%
- Rents YoY
- 5.1%
- Active inventory
- 232
- Price-to-rent
- 7.0×
Monthly cashflow live
- Estimated rent
- $8,023 high interval (Pro) →
- Mortgage (P&I)
- −$3,540
- Tax est. 1.5%
- −$844 /mo · $10,125/yr
- Insurance
- −$281
- HOA
- −$2,080
- Vacancy / Maint / Mgmt
- −$1,685
- Net cashflow
- $-406
Break-even live
UW: 25.0% down · 7.5% · 30yr · 1.5% tax · 5.0% vac · 8.0% maint · 8.0% mgmt
Financing live
Cash to close
- Down payment
- $168,750
- Closing costs
- $20,250
- Reserves months
- —
- Total cash needed
- —
Loan-product check · same deal, 3 products live
Conventional
25% down · 7.5% · 30yr
- Down + closing
- —
- Monthly P&I
- —
- Monthly cashflow
- —
- DSCR
- —
- Eligible?
- —
Personal DTI + credit; lowest rate.
DSCR
20% down · 8.5% · 30yr
- Down + closing
- —
- Monthly P&I
- —
- Monthly cashflow
- —
- DSCR
- —
- Eligible?
- —
No personal income docs; deal must DSCR.
Hard money
10% down · 12.0% · 12mo
- Down + closing
- —
- Monthly P&I
- —
- Monthly cashflow
- —
- DSCR
- —
- Eligible?
- —
Short-term bridge; refi at stabilization.
Rent comps 40 comps
| Address | Beds | Baths | Sqft | Rent | $/sqft | DOM | Units | Dist |
|---|---|---|---|---|---|---|---|---|
| 290 3rd Ave #279 New York, NY | 1.0 | 1.0 | 607 | $9,740 | $16.03 | 3d | 2 | 0.11mi |
| 250 E 21st St Unit 8D New York, NY | 1.0 | 1.0 | 688 | $9,525 | $13.84 | 2d | 1 | 0.24mi |
| 155 E 31st St #2190 New York, NY | 1.0–2.0 | 1.0–1.5 | 725 | $8,070 | $11.13 | 7d | 2 | 0.34mi |
| 241 5th Ave Unit 11A New York, NY | 2.0 | 2.0 | 991 | $8,995 | $9.08 | 24d | 1 | 0.37mi |
| 121 Madison Ave New York, NY | 2.0–4.0 | 1.0–2.0 | 1012 | $7,295 | $7.20 | 7d | 3 | 0.37mi |
| 10 E 29th St New York, NY | 1.0–3.0 | 1.0–3.0 | 1323 | $11,510 | $8.70 | 1d | 4 | 0.37mi |
| 230 E 32nd St New York, NY | 2.0 | 1.0 | 800 | $5,395 | $6.74 | 16d | 2 | 0.37mi |
| 141 E 33rd St #1278 New York, NY | 2.0 | 1.0–1.5 | 683 | $7,210 | $10.56 | 7d | 3 | 0.43mi |
| 346 E 18th St Unit 1254596P New York, NY | 2.0 | 2.0 | 699 | $12,979 | $18.57 | 22d | 1 | 0.43mi |
| 222 E 34th St #999 New York, NY | 1.0 | 1.0 | 554 | $5,490 | $9.91 | 6d | 1 | 0.47mi |
| 309 5th Ave New York, NY | 1.0 | 1.0 | 597 | $7,596 | $12.72 | 7d | 13 | 0.48mi |
| 43 W 27th St #1055 New York, NY | 2.0 | 1.0 | 740 | $9,940 | $13.43 | 24d | 1 | 0.51mi |
| 776 6th Ave New York, NY | 2.0 | 1.0–2.0 | 756 | $10,644 | $14.07 | 1d | 18 | 0.54mi |
| 1 Union Sq S #1174 New York, NY | 2.0 | 1.0–2.0 | 775 | $13,210 | $17.05 | 10d | 3 | 0.55mi |
| 30 Waterside Plz New York, NY | 2.0 | 1.0–2.0 | 743 | $6,598 | $8.88 | 1d | 33 | 0.55mi |
| 20 Waterside Plz #978 New York, NY | 1.0 | 1.0 | 682 | $4,760 | $6.98 | 6d | 1 | 0.57mi |
| 399 E 34th St Unit 1025362P New York, NY | 1.0 | 1.0 | 570 | $9,174 | $16.09 | 22d | 1 | 0.58mi |
| 30 Park Ave #1347 New York, NY | 2.0 | 1.0 | 950 | $9,570 | $10.07 | 1d | 3 | 0.58mi |
| 120 W 23rd St #693 New York, NY | 2.0 | 2.0 | 900 | $10,140 | $11.27 | 20d | 1 | 0.60mi |
| 401 E 34th St New York, NY | 3.0 | 1.0–2.0 | 887 | $7,340 | $8.27 | 1d | 55 | 0.60mi |
| 41 Park Ave New York, NY | 2.0 | 1.0–2.0 | 815 | $8,170 | $10.02 | 7d | 3 | 0.61mi |
| 556 3rd Ave New York, NY | 1.0 | 1.0 | 540 | $5,635 | $10.44 | 1d | 2 | 0.61mi |
| 556 3rd Ave New York, NY | 1.0 | 1.0 | 580 | $5,240 | $9.03 | 19d | 2 | 0.61mi |
| 117 W 28th St #1467 New York, NY | 1.0 | 2.0 | 1000 | $8,760 | $8.76 | 24d | 1 | 0.63mi |
| 120 W 21st St New York, NY | 2.0 | 1.0–2.0 | 676 | $9,036 | $13.37 | 4d | 14 | 0.64mi |
| 209 1st Ave Unit 1370708P New York, NY | 1.0 | 1.0 | 602 | $12,000 | $19.93 | 24d | 1 | 0.66mi |
| 138 E 38th St New York, NY | 3.0 | 1.0–2.0 | 750 | $6,420 | $8.56 | 24d | 4 | 0.66mi |
| 101 E 10th St #1153 New York, NY | 1.0–2.0 | 1.0–2.0 | 575 | $16,510 | $28.71 | 1d | 2 | 0.70mi |
| 160 W 24th St New York, NY | 2.0 | 1.0–2.0 | 731 | $10,290 | $14.07 | 1d | 12 | 0.70mi |
| 222 E 39th St New York, NY | 1.0–4.0 | 1.0–2.0 | 1100 | $6,850 | $6.23 | 6d | 19 | 0.70mi |
| 222 E 39th St New York, NY | 4.0 | 1.0–2.0 | 1100 | $6,972 | $6.34 | 10d | 19 | 0.70mi |
| 222 E 39th St New York, NY | 1.0–4.0 | 1.0–2.0 | 1100 | $6,783 | $6.17 | 20d | 19 | 0.70mi |
| 222 E 39th St New York, NY | 1.0–4.0 | 1.0–2.0 | 1100 | $6,133 | $5.58 | 3d | 20 | 0.70mi |
| 222 E 39th St New York, NY | 1.0–4.0 | 1.0–2.0 | 1100 | $6,783 | $6.17 | 24d | 18 | 0.70mi |
| 166 2nd Ave Unit 9KK New York, NY | 2.0 | 1.5 | 950 | $8,100 | $8.53 | 7d | 1 | 0.71mi |
| 101 W 15th St New York, NY | 1.0 | 1.0 | 562 | $9,550 | $16.98 | 1d | 2 | 0.71mi |
| 540 6th Ave Unit 6A New York, NY | 1.0 | 1.0 | 793 | $8,450 | $10.66 | 7d | 1 | 0.72mi |
| 112 E 10th St Unit 1021937P New York, NY | 1.0–3.0 | 1.0–2.5 | 1296 | $13,688 | $10.56 | 3d | 2 | 0.73mi |
| 180 W 20th St #1202 New York, NY | 2.0 | 1.0–2.0 | 791 | $13,780 | $17.41 | 1d | 3 | 0.74mi |
| 108 W 15th St #205 New York, NY | 1.0–2.0 | 1.0 | 697 | $10,040 | $14.39 | 3d | 2 | 0.75mi |
HOA detail condo
- Monthly dues
- $2,080 · $24,960/yr
- Assessments
- None detected in remarks — confirm with the listing agent.
Listing history 17 events
-
2026-06-18days on market $675,000 Active 70 DOM
-
2026-06-17days on market $675,000 Active 69 DOM
-
2026-06-15days on market $675,000 Active 67 DOM
-
2026-06-13days on market $675,000 Active 65 DOM
-
2026-06-10days on market $675,000 Active 61 DOM
-
2026-06-08days on market $675,000 Active 60 DOM
-
2026-06-08days on market $675,000 Active 59 DOM
-
2026-06-04days on market $675,000 Active 56 DOM
-
2026-06-03days on market $675,000 Active 55 DOM
-
2026-06-01days on market $675,000 Active 53 DOM
-
2026-06-01price $675,000 Active 52 DOM
-
2026-05-31days on market $700,000 Active 52 DOM
-
2026-05-13price $700,000
-
2026-04-09$725,000 Active
-
2023-07-26price $650,000
-
2023-05-08price $700,000
-
2023-03-30$750,000 Active
ⓘ Source: listings_history table (triggers on properties + properties_extension) + one-shot
backfill from property_details.listing_events for pre-trigger history.
Climate risk First Street
- Flood 1/10 Low FEMA zone X (unshaded) · 0% chance over 30 yrs
- Wildfire 1/10 Low
- Heat 7/10 Severe 7 d/yr ≥99°F today · 15 d/yr by 30 yrs out
- Wind 6/10 Major 27% chance of damaging wind over 30 yrs
- Air quality 4/10 Moderate 5 unhealthy d/yr today · 7 by 30 yrs out
Nearby sold comps map
Loading sold comps map…
Walkable amenities ~0.75 mi
Loading nearby amenities…
Taxation est. · year 1
- Rental income
- $96,279
- − Mortgage interest
- −$37,810
- − Property taxes
- −$10,125
- − Insurance
- −$3,375
- − Repairs & maintenance
- −$7,702
- − Management
- −$7,702
- − HOA
- −$24,960
- − Depreciation
- −$19,636
- Taxable loss
- −$15,033
- Est. tax savings @ 24.0%
- +$3,608
- After-tax cash flow
- $-1,269/yr
For passive investors: Depreciation is non-cash, so a rental often shows a tax loss while cash-flowing — sheltering income. Rental losses are passive: they offset passive income freely, and up to $25,000/yr can offset ordinary (W-2) income if you actively participate and your MAGI is under $100k (phasing out to $0 by $150k); unused losses carry forward. On sale, claimed depreciation is recaptured at up to 25%, and gains may owe capital-gains tax (a 1031 exchange can defer both). Figures are a year-1 estimate at your 24.0% rate — not tax advice; consult a CPA.
Schools (NCES district)
No district data.
Livability — New York
- Score
- 75/100
- State rank
- #268
- US rank
- #4188
Category grades
Schools grade is shown separately in the Schools card above.
Census & demographics
- Census place
- New York, NY
- County
- New York County · 1,599,927 people
- City population
- 7,731,280
- Metro
- New York-Newark-Jersey City, NY-NJ-PA
- Population (ZIP)
- 30,702
- Household income
- $144,969
- Rent vs Own
- Severe rent burden
- 2470.0
Population outlook (New York County) Hauer SSP2
- Today (2025)
- 1,825,725 people
- By 2030
- 1,904,611 · +4.3%
- By 2040
- 2,052,719 · +12.4%
- By 2050
- 2,206,601 · +20.9%
- By 2075
- 2,509,427 · +37.4%
- By 2100
- 2,702,933 · +48.0%
Race, ethnicity, and origin ACS 2023
- Neighborhood character
- Diverse neighborhood (Simpson 0.57)
- Race & ethnicity
- White 63% Asian 14% Black 9% Two or more races 9% Hispanic / Latino 8%
- Hispanic origin (detail)
- Mexican 1% Puerto Rican 2%
- Common ancestry
- Romanian 5% Italian 3% Scotch-Irish 2%
- Foreign-born
- 21% · Canada, China, South Korea
- Languages at home
- 80% English-only · Spanish 4% Chinese 4% Other Indo-European 3%
Political lean MEDSL · New York
- 2024 margin
- Solid D (+64.8) · D 82.4% · R 17.6%
- 2008→2024 swing
- -7.4pp toward R · 2008: 72.2pp · 2024: 64.8pp
- All cycles
- 2024: D+64.8 2020: D+74.5 2016: D+77.2 2012: D+69.6 2008: D+72.2
Not yet ingested
- Civics
- —
Market trends
- HPI YoY
- ▲ 5.70%
- Current HPI
- 293.8611
- Rent YoY
- ▲ 5.08%
- Metro
- New York-Newark-Jersey City, NY-NJ-PA
- State GDP YoY
- ▲ 2.60%
- F500 in state
- 92
Industry mix (Fortune 500 HQ in NY)
| Industry | F500 HQs | Revenue |
|---|---|---|
| Financial Services | 10 | $950B |
|
||
| Consumer Goods | 9 | $162B |
|
||
| Insurance | 4 | $225B |
|
||
| Telecommunications | 2 | $144B |
|
||
| Pharmaceuticals | 2 | $112B |
|
||
| Media / Entertainment | 2 | $69B |
|
||
Price history
-6.7% since first listed5 events — show timeline
- 2026-05-13 Price Changed $700,000 RLS at REBNY
- 2026-04-09 Listed $725,000 RLS at REBNY
- 2023-07-26 Price Changed $650,000 RLS at REBNY
- 2023-05-08 Price Changed $700,000 RLS at REBNY
- 2023-03-30 Listed $750,000 RLS at REBNY
Cash-flow waterfall
monthlySold comps — $/sqft
last 12 mo · ≤1 miLoading sold comps…