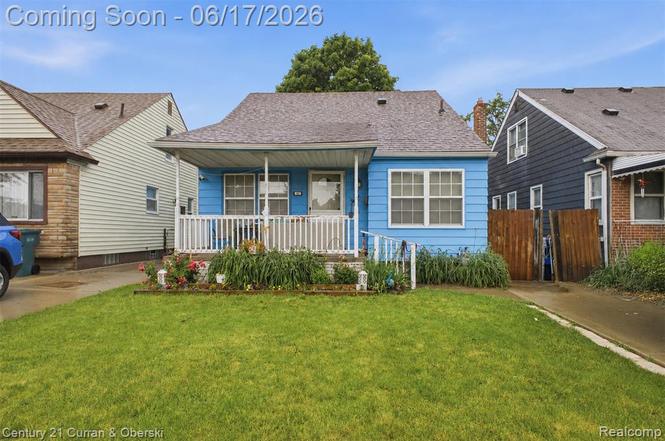
1854 Pagel Ave · Lincoln Park, MI
Flood risk 1/10 · Minimal
- FEMA flood zone
- X (unshaded)
- Chance of flooding over 30 yrs
- 0.0%
- Est. flood insurance / yr
- $473 – $860
Fire risk 1/10 · Minimal
- Est. fire insurance / yr
- $784 – $1,456
Heat risk 3/10 · Minor
- Hot days now (above 96°F)
- 7 days/yr
- Hot days in 30 yrs
- 15 days/yr
Wind risk 2/10 · Minimal
- Chance of severe wind over 30 yrs
- —
Air-quality risk 3/10 · Minor
- Unhealthy air days now
- 3 days/yr
- Unhealthy air days in 30 yrs
- 5 days/yr
Risk factors via First Street. Map © Google.
Why this score? — see what drove the D+ grade
The composite is a weighted blend of 9 inputs, each scored 0–100. Each bar is that input's sub-score; the figure is the points it added to the 100-point composite (weight × sub-score).
- Cash flow +14.5/30.0
- ARV discount +14.0/15.0
- DSCR +4.4/10.0
- 1% rule +4.2/10.0
- Livability +4.0/5.0
- Rent growth +3.7/5.0
- Condition / age +2.5/5.0
- Schools +2.0/10.0
- Appreciation +0.0/10.0
$154,900
🖨 Deal sheet (PDF) 📄 Offer letter ✓ Due diligence
Listing remarks MLS
GREAT INVESTMENT IN THE CITY OF LINCOLN PARK!! COME TAKE A LOOK AT THIS 3 BEDROOM BUNGALOW !! FEATURING 1 FULL BATH, NICE SIZE LIVING ROOM & KITCHEN W/ FENCED BACKYARD. DON'T MISS THE OPPORTUNITY!!Cash offers only. PROPERTY SOLD IN AS IS CONDITION. BUYER AND BUYERS AGENT TO VERIFY ALL INFO.
Key facts
- 3,920 sq ft lot
- Built 1946
Property features AI
Exterior
- Utilities: Public water; Public sewer (assumed from public water and standard city property); Natural gas; Electric service for central A/C and forced air
- Home design: Residential 1-1/2 story; Built in 1946; Entry-level main living areas
- Construction: Vinyl siding; Basement foundation
- Exterior features: Paved street frontage; 40' frontage; Subdivision: Lincoln Homes Sub
Interior
- Kitchen: Entry-level kitchen (approx. 11 x 17)
- Bedrooms: Two entry-level bedrooms (9 x 11 and 11 x 10); One second-floor bedroom (approx. 14' width)
- Bathrooms: One full bathroom on entry level (approx. 7 x 6)
- Heating & cooling: Forced air heating; Central A/C; Natural gas heat
- Interior features: Total of 5 rooms; Unfinished basement
- Laundry & utility: Basement available for utilities/laundry
Neighborhood map
What this means for you Summary
Snapshot
- This is a 3-bed/1.0-bath single-family listed at $155k.
Deal economics
- At list price, monthly cash flow is $35 ($419/yr) — positive.
- The deal already cash-flows at list — no discount required.
- To meet the 1% rule (rent ≥ 1% of price), the offer needs to be $142k (8.2% below list).
- Recommended offer: $142k (8.2% below list) — sets the bar for 1% rule.
Location & tenants
- Location reads 80/100 on livability (#82 in MI, #1,720 nationally) — a professional / high-income tenant draw. Strengths: amenities A+, commute A+, cost of living A+; Watch: crime F, employment D-.
- Lincoln Park School District (suburban): math 15% / reading 32% proficiency, ranked #440 of 540 in MI (top 82%) — low school quality limits family demand, transient renter base, plan for 1-2y turnover; 72% free/reduced lunch — lower-income household profile, screen leases tightly.
- Zoned schools: James Foote School (math 12% / reading 27%, grade F, #1,110 of 1,397 statewide, top 81%, 300 students, 92% FRL); Lincoln Park Middle School (math 12% / reading 35%, grade F, #399 of 493 statewide, top 81%, 1,105 students, 86% FRL); Lincoln Park High School (math 5% / reading 33%, grade F, #630 of 713 statewide, top 88%, 1,367 students, 79% FRL).
- Market conditions: Rents rising fast (+4.7%/yr); 154 active listings in the ZIP; 13 comparable units currently listed for rent nearby; rentals at typical pace (median 26d on market — plan ~3-4 weeks tenant-placement turnaround); 2,639 units permitted in Wayne County in 2024 (1,216 in 5+ unit buildings).
Forward outlook
- Local home prices are declining (-3.0%/yr); year-one equity from $1k of loan paydown is wiped out by about $5k of value loss. Plan a longer hold.
- Wayne County population projected at -17% by 2050 — secular population decline; favor cash flow + early exit over multi-decade hold.
Negotiation context
- Only 1 days on market — expect competitive offers; lowballing is unlikely to land.
- 5 sale attempts since 9y ago; this cycle's ask is 287% above the opening price — seller raised mid-cycle; expect resistance to lowballs.
- Current owner paid $35k; list at $155k implies a 343% gain — meaningful room to come down on a strong offer.
Risks & watch-outs
- Watch-outs: built in 1946 — expect roof / HVAC / electrical / plumbing capex.
Questions for the listing agent
- Built in 1946 — when were the roof, HVAC, electrical panel, plumbing, and water heater last replaced?
- Is there a deadline driving the sale (1031 exchange, divorce, estate, relocation)? That informs how much negotiation room exists.
- Schools are D-rated, which usually means shorter tenancies and higher turnover. Who's the typical renter profile here, and what's been the actual vacancy rate?
- Crime grade is F in this area — have there been break-ins, vandalism, or insurance claims at this property in the last 3 years? What carrier currently insures it and at what premium?
- The area grade is low — what's the realistic commute time and amenity access for the typical tenant pool here? Any planned neighborhood developments (good or bad) we should know about?
- What's the average days-on-market for RENTAL listings here right now (not sales)? A rising rental-DOM trend means longer vacancies and softer asking-rent achievability than the comps imply.
- What's the recent tenant-quality profile in this submarket — average credit score on applications, eviction rate, late-payment / NSF rate, and stable-employment percentage? A property-management company in the area should have these aggregated.
- How much new for-sale + rental construction is in the pipeline within 1–3 miles? Heavy new supply typically softens prices + rents 12–24 months out; constrained supply supports both.
Investment metrics
- 1% rule
- 0.92% ✗
- Cap rate
- 6.56%
- Cash-on-cash
- 0.97%
- DSCR
- 1.04
- GRM
- 9.1
CMA / ARV
- ARV (on-the-fly)
- $181,272
- Comps found
- 12
Show comp detail 12 sales within ~0.75 mi
| Address | Dist | Beds/Ba | Sqft | Sold | Price | $/sf | Match |
|---|---|---|---|---|---|---|---|
| 1415 Richmond Ave | 0.54mi | 3/1.0 | 1,134 (-2%) | 2mo | $165,000 | $146 | 69 |
| 1644 Stewart Ave | 0.28mi | 3/1.0 | 1,284 (+10%) | 4mo | $155,000 | $121 | 66 |
| 1829 Alard Ave | 0.31mi | 3/1.0 | 1,026 (-12%) | 1mo | $206,000 | $201 | 66 |
| 1311 Gregory St | 0.66mi | 3/1.0 | 1,128 (-3%) | 1mo | $145,900 | $129 | 64 |
| 1453 Buckingham Ave | 0.51mi | 3/1.0 | 1,221 (+5%) | 5mo | $140,000 | $115 | 64 |
| 2148 Meyer Ct | 0.32mi | 3/1.0 | 1,000 (-14%) | 0mo | $219,900 | $220 | 62 |
| 2121 Buckingham Ave | 0.30mi | 3/1.0 | 1,012 (-13%) | 4mo | $159,900 | $158 | 61 |
| 2071 Meyer Ct | 0.25mi | 3/1.5 | 999 (-14%) | 2mo | $190,000 | $190 | 61 |
| 2366 Progress Ave | 0.73mi | 3/1.0 | 1,120 (-4%) | 3mo | $145,000 | $129 | 57 |
| 2359 Detroit Ave | 0.69mi | 3/1.0 | 1,080 (-7%) | 1mo | $196,000 | $181 | 55 |
| 1670 Michigan Blvd | 0.64mi | 4/1.0 (+1) | 1,211 (+4%) | 4mo | $189,000 | $156 | 55 |
| 2162 Leblanc St | 0.75mi | 3/1.0 | 1,335 (+15%) | 3mo | $135,000 | $101 | 38 |
Match score weights: distance 35% · size 25% · config 20% · recency 20%. Top-matched comps best support the ARV.
Projected returns pro-forma
-3.0% appreciation · 4.65% rent growth · sell at horizon
- IRR
- -12.9%
- Equity multiple
- 0.53×
- Total profit
- $-20,442
- Equity at exit
- $23,096
- IRR
- -1.4%
- Equity multiple
- 0.89×
- Total profit
- $-4,620
- Equity at exit
- $13,393
Cash invested: $43,372 (down + closing). Projections, not guarantees.
Landlord ↔ Tenant lean methodology
- Overall (STATE)
- 62 Landlord-Friendly
- State Michigan
- 62 Landlord-Friendly · EVEN
- County
- — inherits STATE
- City
- — inherits STATE
ZIP-level market 48146
- Home prices YoY
- -32.7%
- Rents YoY
- 4.7%
- Active inventory
- 154
- Price-to-rent
- 9.1×
Monthly cashflow live
- Estimated rent
- $1,422 high interval (Pro) →
- Mortgage (P&I)
- −$812
- Tax from tax record
- −$211 /mo · $2,538/yr
- Insurance
- −$65
- HOA
- −$0
- Vacancy / Maint / Mgmt
- −$299
- Net cashflow
- $35
Break-even live
Sensitivity live
| Price | -10% $123 | -5% $79 | +0% $35 | +5% $-9 | +10% $-53 |
|---|---|---|---|---|---|
| Rent | -10% $-77 | -5% $-21 | +0% $35 | +5% $91 | +10% $147 |
| Rate | -1.0pp $113 | -0.5pp $74 | base $35 | +0.5pp $-5 | +1.0pp $-46 |
UW: 25.0% down · 7.5% · 30yr · 1.5% tax · 5.0% vac · 8.0% maint · 8.0% mgmt
Financing live
Cash to close
- Down payment
- $38,725
- Closing costs
- $4,647
- Reserves months
- —
- Total cash needed
- —
Loan-product check · same deal, 3 products live
Conventional
25% down · 7.5% · 30yr
- Down + closing
- —
- Monthly P&I
- —
- Monthly cashflow
- —
- DSCR
- —
- Eligible?
- —
Personal DTI + credit; lowest rate.
DSCR
20% down · 8.5% · 30yr
- Down + closing
- —
- Monthly P&I
- —
- Monthly cashflow
- —
- DSCR
- —
- Eligible?
- —
No personal income docs; deal must DSCR.
Hard money
10% down · 12.0% · 12mo
- Down + closing
- —
- Monthly P&I
- —
- Monthly cashflow
- —
- DSCR
- —
- Eligible?
- —
Short-term bridge; refi at stabilization.
Rent comps 13 comps
| Address | Beds | Baths | Sqft | Rent | $/sqft | DOM | Units | Dist |
|---|---|---|---|---|---|---|---|---|
| 2235 Moore Rd Unit 1 Lincoln Park, MI | 2.0 | 1.0 | 800 | $1,000 | $1.25 | 26d | 1 | 0.42mi |
| 1343 Pagel Ave Unit 2-Upper Lincoln Park, MI | 2.0 | 1.0 | 1000 | $1,250 | $1.25 | 19d | 1 | 0.62mi |
| 9725 Fox Ave Allen Park, MI | 3.0 | 1.5 | 940 | $1,850 | $1.97 | 45d | 1 | 0.66mi |
| 1760 Saint Johns Blvd Apt 14 Lincoln Park, MI | 2.0 | 1.0 | 750 | $995 | $1.33 | 26d | 1 | 0.82mi |
| 1750 Saint Johns Blvd Unit 17 Lincoln Park, MI | 2.0 | 1.0 | 750 | $1,025 | $1.37 | 26d | 1 | 0.82mi |
| 11400 Fordline St Allen Park, MI | 1.0–2.0 | 1.0 | 880 | $1,400 | $1.59 | 0d | 1 | 0.95mi |
| 4163 Burns Ave Lincoln Park, MI | 3.0 | 1.0 | 900 | $1,500 | $1.67 | 3d | 1 | 1.00mi |
| 9814 Quandt Ave Allen Park, MI | 3.0 | 2.0 | 1050 | $1,800 | $1.71 | 45d | 1 | 1.11mi |
| 1552 Hanover St Lincoln Park, MI | 2.0 | 1.0 | 800 | $1,250 | $1.56 | 26d | 1 | 1.24mi |
| 9725 Ruth Allen Park, MI | 3.0 | 1.5 | 1110 | $1,800 | $1.62 | 4d | 1 | 1.32mi |
| 854 Harrison Blvd Lincoln Park, MI | 3.0 | 1.0 | 1410 | $1,750 | $1.24 | 45d | 1 | 1.42mi |
| 1130 21st St Wyandotte, MI | 3.0 | 1.0 | 864 | $1,420 | $1.64 | 0d | 1 | 1.43mi |
| 750 Harrison Blvd Unit 5 Lincoln Park, MI | 2.0 | 1.0 | 800 | $995 | $1.24 | 6d | 1 | 1.49mi |
Listing history 3 events
-
2026-06-17status $154,900 Active 1 DOM
-
2026-06-16remarks 695-char remark
-
2026-06-16$154,900 Coming Soon 1 DOM
ⓘ Source: listings_history table (triggers on properties + properties_extension) + one-shot
backfill from property_details.listing_events for pre-trigger history.
Tax reassessment forecast MI · Partial reset (capped growth)
- Current annual tax
- $2,538 · $211/mo
- Projected year-2 tax
- $2,538 · $211/mo
- Expected delta
- $0/yr ($0/mo · 0.0%)
ⓘ Screening estimate from a state-policy table — verify with the county assessor before closing.
Climate risk First Street
- Flood 1/10 Low FEMA zone X (unshaded) · 0% chance over 30 yrs
- Wildfire 1/10 Low
- Heat 3/10 Moderate 7 d/yr ≥96°F today · 15 d/yr by 30 yrs out
- Wind 2/10 Low
- Air quality 3/10 Moderate 3 unhealthy d/yr today · 5 by 30 yrs out
Nearby sold comps map
Loading sold comps map…
Walkable amenities ~0.75 mi
Loading nearby amenities…
Taxation est. · year 1
- Rental income
- $17,062
- − Mortgage interest
- −$8,677
- − Property taxes
- −$2,538
- − Insurance
- −$774
- − Repairs & maintenance
- −$1,365
- − Management
- −$1,365
- − Depreciation
- −$4,506
- Taxable loss
- −$2,163
- Est. tax savings @ 24.0%
- +$519
- After-tax cash flow
- $939/yr
For passive investors: Depreciation is non-cash, so a rental often shows a tax loss while cash-flowing — sheltering income. Rental losses are passive: they offset passive income freely, and up to $25,000/yr can offset ordinary (W-2) income if you actively participate and your MAGI is under $100k (phasing out to $0 by $150k); unused losses carry forward. On sale, claimed depreciation is recaptured at up to 25%, and gains may owe capital-gains tax (a 1031 exchange can defer both). Figures are a year-1 estimate at your 24.0% rate — not tax advice; consult a CPA.
Schools (NCES district)
- District
- Lincoln Park School District
- NCES district ID
- 2621600
- Math proficiency
- 15% ▼ -5.00%
- Reading proficiency
- 32% ▬ 0.00%
- Median HH income
- $41,486
- Composite
- 19.93/100
- National rank
- #8678
- State rank
- #440 of 540 in MI
Livability — Lincoln Park
- Score
- 80/100
- State rank
- #82
- US rank
- #1720
Category grades
Schools grade is shown separately in the Schools card above.
Census & demographics
- Census place
- Lincoln Park, MI
- County
- Wayne County · 1,562,939 people
- City population
- 39,257
- Metro
- Detroit-Warren-Dearborn, MI
- Population (ZIP)
- 39,257
- Household income
- $58,616
- Rent vs Own
- Severe rent burden
- 1142.0
Population outlook (Wayne County) Hauer SSP2
- Today (2025)
- 1,675,273 people
- By 2030
- 1,620,300 · -3.3%
- By 2040
- 1,502,341 · -10.3%
- By 2050
- 1,384,039 · -17.4%
- By 2075
- 1,124,592 · -32.9%
- By 2100
- 881,193 · -47.4%
Race, ethnicity, and origin ACS 2023
- Neighborhood character
- Diverse neighborhood (Simpson 0.57)
- Race & ethnicity
- White 60% Hispanic / Latino 25% Two or more races 12% Black 9% Native American 1%
- Hispanic origin (detail)
- Mexican 19% Puerto Rican 3%
- Common ancestry
- Romanian 6% Lithuanian 4% Slovak 1%
- Foreign-born
- 9% · Canada
- Languages at home
- 80% English-only · Spanish 17% Arabic 2%
Political lean MEDSL · Wayne
- 2024 margin
- Strong D (+29.0) · D 62.7% · R 33.7% · Other 3.6%
- 2008→2024 swing
- -20.5pp toward R · 2008: 49.5pp · 2024: 29.0pp
- All cycles
- 2024: D+29.0 2020: D+38.1 2016: D+37.3 2012: D+46.9 2008: D+49.5
Not yet ingested
- Civics
- —
Market trends
- HPI YoY
- ▼ -108.25%
- Current HPI
- 222.8545
- Rent YoY
- ▲ 4.65%
- Metro
- Detroit-Warren-Dearborn, MI
- State GDP YoY
- ▲ 1.37%
- F500 in state
- 28
Industry mix (Fortune 500 HQ in MI)
| Industry | F500 HQs | Revenue |
|---|---|---|
| Automotive Parts | 3 | $48B |
|
||
| Automotive | 2 | $372B |
|
||
| Chemicals | 1 | $45B |
|
||
| Automotive Retail | 1 | $29B |
|
||
| Healthcare / Medical Devices | 1 | $23B |
|
||
| Automotive Technology | 1 | $20B |
|
||
Price history
+210.4% since first listed16 events — show timeline
- 2026-06-16 Coming Soon $154,900 MiRealSource-MiMLS
- 2018-04-11 Sold (MLS) $35,000 MiRealSource-MiMLS
- 2018-04-11 Sold (MLS) $35,000 REALCOMP
- 2018-03-02 Pending — MiRealSource-MiMLS
- 2018-03-02 Pending — REALCOMP
- 2018-02-14 Listed $40,000 MiRealSource-MiMLS
- 2018-02-14 Listed $40,000 REALCOMP
- 2018-02-09 Price Changed $40,000 MiRealSource-MiMLS
- 2018-02-09 Listing Removed — REALCOMP
- 2018-02-09 Listing Removed — MiRealSource-MiMLS
- 2018-02-09 Price Changed $40,000 REALCOMP
- 2018-02-08 Relisted — REALCOMP
- 2017-12-11 Pending — MiRealSource-MiMLS
- 2017-12-11 Pending — REALCOMP
- 2017-10-19 Listed $49,900 MiRealSource-MiMLS
- 2017-10-19 Listed $49,900 REALCOMP
Property tax history
+3.8%/yrLatest (2025): $2,538 · +1.3% YoY. Source: county tax records.
Cash-flow waterfall
monthlySold comps — $/sqft
last 12 mo · ≤1 miLoading sold comps…