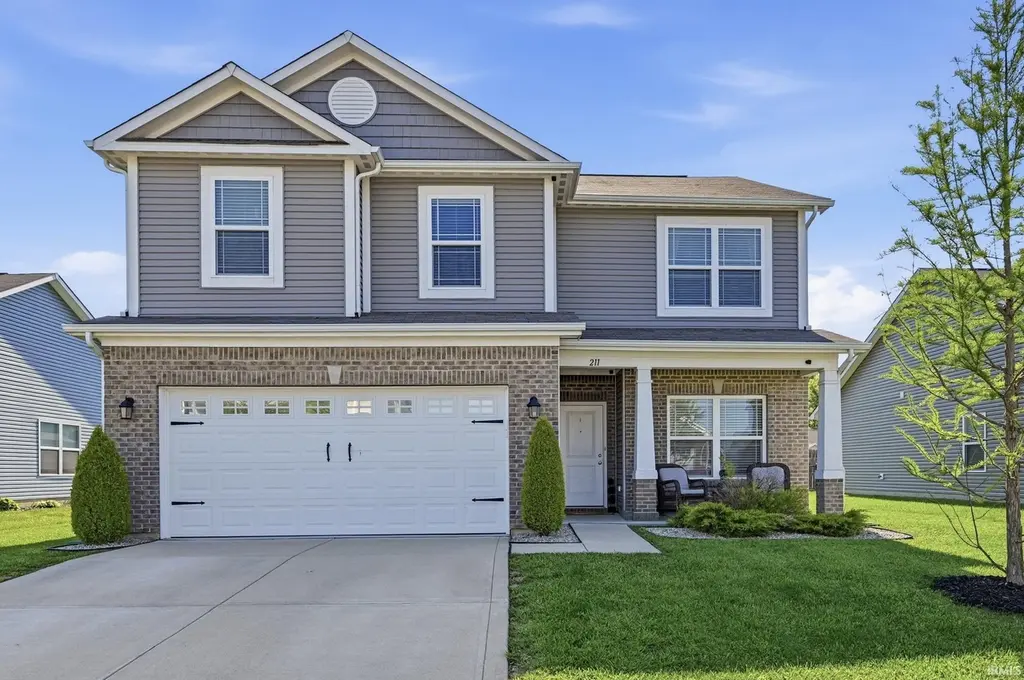
211 Thistlewood Dr · Greenfield, IN
Flood risk 1/10 · Minimal
- FEMA flood zone
- X (unshaded)
- Chance of flooding over 30 yrs
- 0.0%
- Est. flood insurance / yr
- $507 – $1,088
Fire risk 1/10 · Minimal
- Est. fire insurance / yr
- $717 – $1,331
Heat risk 4/10 · Minor
- Hot days now (above 102°F)
- 7 days/yr
- Hot days in 30 yrs
- 19 days/yr
Wind risk 2/10 · Minimal
- Chance of severe wind over 30 yrs
- 1.0%
Air-quality risk 2/10 · Minimal
- Unhealthy air days now
- 1 days/yr
- Unhealthy air days in 30 yrs
- 2 days/yr
Risk factors via First Street. Map © Google.
Why this score? — see what drove the D grade
The composite is a weighted blend of 9 inputs, each scored 0–100. Each bar is that input's sub-score; the figure is the points it added to the 100-point composite (weight × sub-score).
- Cash flow +13.2/30.0
- ARV discount +9.7/15.0
- DSCR +4.0/10.0
- Schools +4.0/10.0
- Livability +3.7/5.0
- Rent growth +3.2/5.0
- 1% rule +3.1/10.0
- Condition / age +2.5/5.0
- Appreciation +0.0/10.0
$299,500
🖨 Deal sheet (PDF) 📄 Offer letter ✓ Due diligence
Listing remarks MLS
Built in 2017, this home offers 2,130 square feet of comfortable living space. The covered front porch is the perfect space to enjoy your morning coffee or catch up with the neighbors. The home offers a formal living room and a spacious family room. The kitchen has a large island that is perfect for prepping meals and has all appliances included in the sale. The upper level offers a large loft, convenient laundry space, and 4 large bedrooms. The primary suite is exceptionally spacious and features a walk-in closet, stand-up shower, and soaking tub. The back yard has a concrete patio space, storage shed, and a fully fenced in lawn that could offer the perfect space for pets. Spacious 2 car garage offers plenty of additional storage space.
Key facts
- Covered front porch
- Walk-in closet
- Soaking tub
Tags
Property features AI
Finance
- Other: Lot under 1/4 acre
- HOA & community: Homeowners association with an annual fee of $428
Exterior
- Parking: Attached 2-car garage
- Utilities: Public water; Municipal sewer connected; No solid waste service listed
- Home design: Single family residence; Two levels; Ownership subject to mandatory fee
- Construction: Vinyl with brick exterior; Slab foundation
- Exterior features: Patio; Full chain-link fence
Interior
- Kitchen: Dishwasher; Microwave; Electric oven; Refrigerator
- Bedrooms: 4 bedrooms on the upper level
- Bathrooms: 2 full bathrooms; 1 half bathroom
- Heating & cooling: Forced air heating (natural gas); Central air conditioning
- Interior features: Kitchen island; Eat-in kitchen; Pantry; Walk-in closet(s)
- Laundry & utility: Electric water heater
Neighborhood map
What this means for you Summary
Snapshot
- This is a 4-bed/2.5-bath single-family listed at $300k.
Deal economics
- At list price, monthly cash flow is $-5 ($-63/yr) — negative.
- To cash-flow at today's rent, offer at most $299k (0.3% below list).
- To meet the 1% rule (rent ≥ 1% of price), the offer needs to be $244k (18.7% below list).
- Recommended offer: $244k (18.7% below list) — sets the bar for 1% rule.
- Cap rate 6.3% vs local median 4.7% in Greenfield — top-decile yield for the area; either an underpriced asset or a hidden risk that comps aren't pricing in. Stress-test before assuming the spread holds.
Location & tenants
- Location reads 73/100 on livability (#88 in IN) — a middle-class / working-renter tenant base. Strengths: cost of living A+, housing A+; Watch: amenities F, commute F.
- Greenfield-Central Community Schools (other): math 47% / reading 45% proficiency, ranked #83 of 301 in IN (top 28%) — families likely to look elsewhere, expect single-tenant / working-renter base with shorter leases.
- Zoned schools: Weston Elementary School (math 57% / reading 32%, grade F, #379 of 994 statewide, top 41%, 327 students, 44% FRL); Greenfield Central Junior High Sch (math 38% / reading 42%, grade F, #120 of 330 statewide, top 37%, 675 students, 45% FRL); Greenfield-Central High School (math 37% / reading 65%, grade D+, #115 of 369 statewide, top 31%, 1,462 students, 35% FRL).
- Market conditions: Rents rising (+2.9%/yr); 481 active listings in the ZIP; 2 comparable units currently listed for rent nearby; solid renter incomes; 1,091 units permitted in Hancock County in 2024 (0 in 5+ unit buildings).
- This rent runs 35% of the median local income ($83k/yr) — at the standard rent-burdened threshold; future hikes will face affordability resistance.
Forward outlook
- Local home prices are declining (-3.0%/yr); year-one equity from $2k of loan paydown is wiped out by about $9k of value loss. Plan a longer hold.
- Hancock County population projected at +7% by 2050 — modest demand growth; plan on rents tracking national, not racing it.
Negotiation context
- It's been on market 33 days — a 3% lower offer ($291k) is reasonable based on typical stale-listing flexibility.
- 3 sale attempts since 9y ago with the ask held roughly flat each time — persistent listings suggest the price (not the market) is what's stuck; bring a comps-based counter.
- Current owner paid $178k; list at $300k implies a 68% gain — meaningful room to come down on a strong offer.
Questions for the listing agent
- What do current leases actually rent for vs. the listed asking? Can we see a recent rent roll and the last 12 months of T-12 income?
- It's been on market 33 days. Have you received any prior offers? Is the seller open to a 19% concession, seller financing, or rate buy-down credit?
- What does the HOA fee cover, when was the last increase, and are there any pending special assessments or reserve-fund shortfalls?
- Is there a deadline driving the sale (1031 exchange, divorce, estate, relocation)? That informs how much negotiation room exists.
- Schools are B-rated — typically a magnet for longer-tenancy family renters. What's the average tenant stay here, and is there a school-zone premium baked into asking?
- The area grade is low — what's the realistic commute time and amenity access for the typical tenant pool here? Any planned neighborhood developments (good or bad) we should know about?
- What's the average days-on-market for RENTAL listings here right now (not sales)? A rising rental-DOM trend means longer vacancies and softer asking-rent achievability than the comps imply.
- What's the recent tenant-quality profile in this submarket — average credit score on applications, eviction rate, late-payment / NSF rate, and stable-employment percentage? A property-management company in the area should have these aggregated.
- How much new for-sale + rental construction is in the pipeline within 1–3 miles? Heavy new supply typically softens prices + rents 12–24 months out; constrained supply supports both.
Investment metrics
- 1% rule
- 0.81% ✗
- Cap rate
- 6.27%
- Cash-on-cash
- -0.08%
- DSCR
- 1.00
- GRM
- 10.2
CMA / ARV
- ARV (on-the-fly)
- $315,240
- Comps found
- 12
Show comp detail 12 sales within ~0.75 mi
| Address | Dist | Beds/Ba | Sqft | Sold | Price | $/sf | Match |
|---|---|---|---|---|---|---|---|
| 475 Rocky Rd | 0.14mi | 4/2.5 | 2,114 (-1%) | 1mo | $310,000 | $147 | 91 |
| 611 Melrose Ct | 0.44mi | 4/2.5 | 2,165 (+2%) | 1mo | $342,700 | $158 | 76 |
| 156 Tinker Trl | 0.07mi | 4/2.5 | 2,388 (+12%) | 3mo | $319,900 | $134 | 74 |
| 2055 Meridian Springs Ln | 0.47mi | 4/2.5 | 2,160 (+1%) | 3mo | $289,400 | $134 | 73 |
| 184 Thistlewood Dr | 0.06mi | 3/2.5 (-1) | 1,820 (-15%) | 1mo | $295,000 | $162 | 67 |
| 117 Tinker Trl | 0.16mi | 3/2.5 (-1) | 1,820 (-15%) | 2mo | $294,000 | $162 | 61 |
| 276 Oakswept Way | 0.61mi | 4/2.5 | 2,176 (+2%) | 8mo | $322,689 | $148 | 61 |
| 1946 Meridian Springs Ln | 0.59mi | 4/2.5 | 2,212 (+4%) | 7mo | $310,000 | $140 | 60 |
| 851 Sonoma Ln | 0.66mi | 4/2.5 | 2,053 (-4%) | 7mo | $289,000 | $141 | 57 |
| 498 Old Glory Dr | 0.56mi | 3/2.5 (-1) | 2,230 (+5%) | 8mo | $330,000 | $148 | 55 |
| 305 Briar Path Dr | 0.70mi | 3/2.5 (-1) | 1,967 (-8%) | 5mo | $329,076 | $167 | 46 |
| 2180 Meridian Springs Ln | 0.54mi | 4/2.0 | 1,854 (-13%) | 8mo | $300,000 | $162 | 45 |
Match score weights: distance 35% · size 25% · config 20% · recency 20%. Top-matched comps best support the ARV.
Projected returns pro-forma
-3.0% appreciation · 2.88% rent growth · sell at horizon
- IRR
- -16.6%
- Equity multiple
- 0.41×
- Total profit
- $-49,212
- Equity at exit
- $44,656
- IRR
- -8.6%
- Equity multiple
- 0.47×
- Total profit
- $-44,690
- Equity at exit
- $25,895
Cash invested: $83,860 (down + closing). Projections, not guarantees.
Landlord ↔ Tenant lean methodology
- Overall (STATE)
- 90 Strongly Landlord-Friendly
- State Indiana
- 90 Strongly Landlord-Friendly · R+11
- County
- — inherits STATE
- City
- — inherits STATE
ZIP-level market 46140
- Rents YoY
- 2.9%
- Active inventory
- 481
- Price-to-rent
- 10.2×
Monthly cashflow live
- Estimated rent
- $2,435 medium interval (Pro) →
- Mortgage (P&I)
- −$1,571
- Tax from tax record
- −$198 /mo · $2,371/yr
- Insurance
- −$125
- HOA
- −$36
- Vacancy / Maint / Mgmt
- −$511
- Net cashflow
- $-5
Break-even live
Sensitivity live
| Price | -10% $164 | -5% $79 | +0% $-5 | +5% $-90 | +10% $-175 |
|---|---|---|---|---|---|
| Rent | -10% $-198 | -5% $-101 | +0% $-5 | +5% $91 | +10% $187 |
| Rate | -1.0pp $146 | -0.5pp $71 | base $-5 | +0.5pp $-83 | +1.0pp $-162 |
UW: 25.0% down · 7.5% · 30yr · 1.5% tax · 5.0% vac · 8.0% maint · 8.0% mgmt
Financing live
Cash to close
- Down payment
- $74,875
- Closing costs
- $8,985
- Reserves months
- —
- Total cash needed
- —
Loan-product check · same deal, 3 products live
Conventional
25% down · 7.5% · 30yr
- Down + closing
- —
- Monthly P&I
- —
- Monthly cashflow
- —
- DSCR
- —
- Eligible?
- —
Personal DTI + credit; lowest rate.
DSCR
20% down · 8.5% · 30yr
- Down + closing
- —
- Monthly P&I
- —
- Monthly cashflow
- —
- DSCR
- —
- Eligible?
- —
No personal income docs; deal must DSCR.
Hard money
10% down · 12.0% · 12mo
- Down + closing
- —
- Monthly P&I
- —
- Monthly cashflow
- —
- DSCR
- —
- Eligible?
- —
Short-term bridge; refi at stabilization.
Rent comps 2 comps
| Address | Beds | Baths | Sqft | Rent | $/sqft | DOM | Units | Dist |
|---|---|---|---|---|---|---|---|---|
| 176 Heartwood Hl Greenfield, IN | 4.0 | 2.5 | 2295 | $2,489 | $1.08 | 0d | 1 | 0.48mi |
| 968 Lotus Dr Greenfield, IN | 3.0–5.0 | 2.0–3.0 | 2049 | $2,245 | $1.10 | 0d | 8 | 1.44mi |
HOA detail
- Monthly dues
- $36 · $432/yr
Listing history 21 events
-
2026-06-21days on market $299,500 Active 33 DOM
-
2026-06-18days on market $299,500 Active 30 DOM
-
2026-06-17days on market $299,500 Active 29 DOM
-
2026-06-16days on market $299,500 Active 28 DOM
-
2026-06-15days on market $299,500 Active 27 DOM
-
2026-06-13days on market $299,500 Active 25 DOM
-
2026-06-13days on market $299,500 Active 24 DOM
-
2026-06-09days on market $299,500 Active 21 DOM
-
2026-06-08days on market $299,500 Active 20 DOM
-
2026-06-07pricedays on market $299,500 Active 19 DOM
-
2026-06-05pricedays on market $305,500 Active 16 DOM
-
2026-06-03days on market $309,500 Active 15 DOM
-
2026-06-02days on market $309,500 Active 14 DOM
-
2026-06-01days on market $309,500 Active 13 DOM
-
2026-05-31days on market $309,500 Active 12 DOM
-
2026-05-19$309,500 Active 747-char remark
Show marketing remark (747 chars)
Built in 2017, this home offers 2,130 square feet of comfortable living space. The covered front porch is the perfect space to enjoy your morning coffee or catch up with the neighbors. The home offers a formal living room and a spacious family room. The kitchen has a large island that is perfect for prepping meals and has all appliances included in the sale. The upper level offers a large loft, convenient laundry space, and 4 large bedrooms. The primary suite is exceptionally spacious and features a walk-in closet, stand-up shower, and soaking tub. The back yard has a concrete patio space, storage shed, and a fully fenced in lawn that could offer the perfect space for pets. Spacious 2 car garage offers plenty of additional storage space.
-
2026-05-19$309,500 Active
Show marketing remark (747 chars)
Built in 2017, this home offers 2,130 square feet of comfortable living space. The covered front porch is the perfect space to enjoy your morning coffee or catch up with the neighbors. The home offers a formal living room and a spacious family room. The kitchen has a large island that is perfect for prepping meals and has all appliances included in the sale. The upper level offers a large loft, convenient laundry space, and 4 large bedrooms. The primary suite is exceptionally spacious and features a walk-in closet, stand-up shower, and soaking tub. The back yard has a concrete patio space, storage shed, and a fully fenced in lawn that could offer the perfect space for pets. Spacious 2 car garage offers plenty of additional storage space.
-
2017-10-20soldstatus $177,900 Sold 519-char remark
Show marketing remark (519 chars)
New construction by Westport Homes in beautiful Sawmill. This Columbia features 4 BR, loft, flex room or formal living room & 2.5 baths. You will love the tall 9' ceilings, painted stair spindles, upgraded cabinets & flooring, kitchen island & overall layout of this home. Convenient upstairs laundry, impressive master bath w/double bowl vanity, garden tub & separate shower. Also features water softener rough-in, neutral interior paint, gas furnace & more! Popular Greenfield community with pool.
-
2017-09-06status Pending 519-char remark
Show marketing remark (519 chars)
New construction by Westport Homes in beautiful Sawmill. This Columbia features 4 BR, loft, flex room or formal living room & 2.5 baths. You will love the tall 9' ceilings, painted stair spindles, upgraded cabinets & flooring, kitchen island & overall layout of this home. Convenient upstairs laundry, impressive master bath w/double bowl vanity, garden tub & separate shower. Also features water softener rough-in, neutral interior paint, gas furnace & more! Popular Greenfield community with pool.
-
2017-07-27price $177,900 519-char remark
Show marketing remark (519 chars)
New construction by Westport Homes in beautiful Sawmill. This Columbia features 4 BR, loft, flex room or formal living room & 2.5 baths. You will love the tall 9' ceilings, painted stair spindles, upgraded cabinets & flooring, kitchen island & overall layout of this home. Convenient upstairs laundry, impressive master bath w/double bowl vanity, garden tub & separate shower. Also features water softener rough-in, neutral interior paint, gas furnace & more! Popular Greenfield community with pool.
-
2017-04-24$180,615 Active 519-char remark
Show marketing remark (519 chars)
New construction by Westport Homes in beautiful Sawmill. This Columbia features 4 BR, loft, flex room or formal living room & 2.5 baths. You will love the tall 9' ceilings, painted stair spindles, upgraded cabinets & flooring, kitchen island & overall layout of this home. Convenient upstairs laundry, impressive master bath w/double bowl vanity, garden tub & separate shower. Also features water softener rough-in, neutral interior paint, gas furnace & more! Popular Greenfield community with pool.
ⓘ Source: listings_history table (triggers on properties + properties_extension) + one-shot
backfill from property_details.listing_events for pre-trigger history.
Tax reassessment forecast IN · Partial reset (capped growth)
- Current annual tax
- $2,371 · $198/mo
- Projected year-2 tax
- $2,458 · $205/mo
- Expected delta
- +$87/yr (+$7/mo · 3.7%)
ⓘ Screening estimate from a state-policy table — verify with the county assessor before closing.
Climate risk First Street
- Flood 1/10 Low FEMA zone X (unshaded) · 0% chance over 30 yrs
- Wildfire 1/10 Low
- Heat 4/10 Moderate 7 d/yr ≥102°F today · 19 d/yr by 30 yrs out
- Wind 2/10 Low 100% chance of damaging wind over 30 yrs
- Air quality 2/10 Low 1 unhealthy d/yr today · 2 by 30 yrs out
Nearby sold comps map
Loading sold comps map…
Walkable amenities ~0.75 mi
Loading nearby amenities…
Taxation est. · year 1
- Rental income
- $29,221
- − Mortgage interest
- −$16,777
- − Property taxes
- −$2,371
- − Insurance
- −$1,498
- − Repairs & maintenance
- −$2,338
- − Management
- −$2,338
- − HOA
- −$432
- − Depreciation
- −$8,713
- Taxable loss
- −$5,244
- Est. tax savings @ 24.0%
- +$1,259
- After-tax cash flow
- $1,195/yr
For passive investors: Depreciation is non-cash, so a rental often shows a tax loss while cash-flowing — sheltering income. Rental losses are passive: they offset passive income freely, and up to $25,000/yr can offset ordinary (W-2) income if you actively participate and your MAGI is under $100k (phasing out to $0 by $150k); unused losses carry forward. On sale, claimed depreciation is recaptured at up to 25%, and gains may owe capital-gains tax (a 1031 exchange can defer both). Figures are a year-1 estimate at your 24.0% rate — not tax advice; consult a CPA.
Schools (NCES district)
- District
- Greenfield-Central Community Schools
- NCES district ID
- 1804050
- Math proficiency
- 47% ▼ -12.00%
- Reading proficiency
- 45% ▼ -11.00%
- Median HH income
- $55,533
- Composite
- 40.01/100
- National rank
- #3827
- State rank
- #83 of 301 in IN
Livability — Greenfield
- Score
- 73/100
- State rank
- #88
- US rank
- #5094
Category grades
Schools grade is shown separately in the Schools card above.
Census & demographics
- Census place
- Greenfield, IN
- County
- Hancock County · 59,521 people
- City population
- 43,511
- Metro
- Indianapolis-Carmel-Anderson, IN
- Population (ZIP)
- 43,511
- Household income
- $83,056
- Rent vs Own
- Severe rent burden
- 795.0
Population outlook (Hancock County) Hauer SSP2
- Today (2025)
- 77,820 people
- By 2030
- 79,914 · +2.7%
- By 2040
- 82,734 · +6.3%
- By 2050
- 83,348 · +7.1%
- By 2075
- 82,439 · +5.9%
- By 2100
- 74,181 · -4.7%
Race, ethnicity, and origin ACS 2023
- Neighborhood character
- Predominantly White (92%)
- Race & ethnicity
- White 92% Two or more races 5% Hispanic / Latino 3% Black 1%
- Common ancestry
- Italian 3% Lithuanian 3% Slovak 1%
- Foreign-born
- 3% · Canada
- Languages at home
- 96% English-only · Spanish 2% Other Indo-European 1%
Political lean MEDSL · Hancock
- 2024 margin
- Solid R (+33.7) · D 32.2% · R 65.9% · Other 1.9%
- 2008→2024 swing
- -4.1pp toward R · 2008: -29.6pp · 2024: -33.7pp
- All cycles
- 2024: R+33.7 2020: R+37.5 2016: R+44.8 2012: R+41.0 2008: R+29.6
Not yet ingested
- Civics
- —
Market trends
- HPI YoY
- ▼ -131.67%
- Current HPI
- 225.0367
- Rent YoY
- ▲ 2.88%
- Metro
- Indianapolis-Carmel-Anderson, IN
- State GDP YoY
- ▲ 2.90%
- F500 in state
- 18
Industry mix (Fortune 500 HQ in IN)
| Industry | F500 HQs | Revenue |
|---|---|---|
| Industrial Machinery | 2 | $37B |
|
||
| Healthcare | 1 | $177B |
|
||
| Pharmaceuticals | 1 | $45B |
|
||
| Metals / Steel | 1 | $18B |
|
||
| Agriculture | 1 | $17B |
|
||
| Packaging | 1 | $12B |
|
||
Price history
+71.4% since first listed6 events — show timeline
- 2026-05-19 Listed $309,500 MIBOR as Distributed by MLS Grid
- 2026-05-19 Listed $309,500 IRMLS
- 2017-10-20 Sold (MLS) $177,900 MIBOR as Distributed by MLS Grid
- 2017-09-06 Pending — MIBOR as Distributed by MLS Grid
- 2017-07-27 Price Changed $177,900 MIBOR as Distributed by MLS Grid
- 2017-04-24 Listed $180,615 MIBOR as Distributed by MLS Grid
Property tax history
+5.3%/yrLatest (2025): $2,371 · -12.2% YoY. Source: county tax records.
Cash-flow waterfall
monthlySold comps — $/sqft
last 12 mo · ≤1 miLoading sold comps…