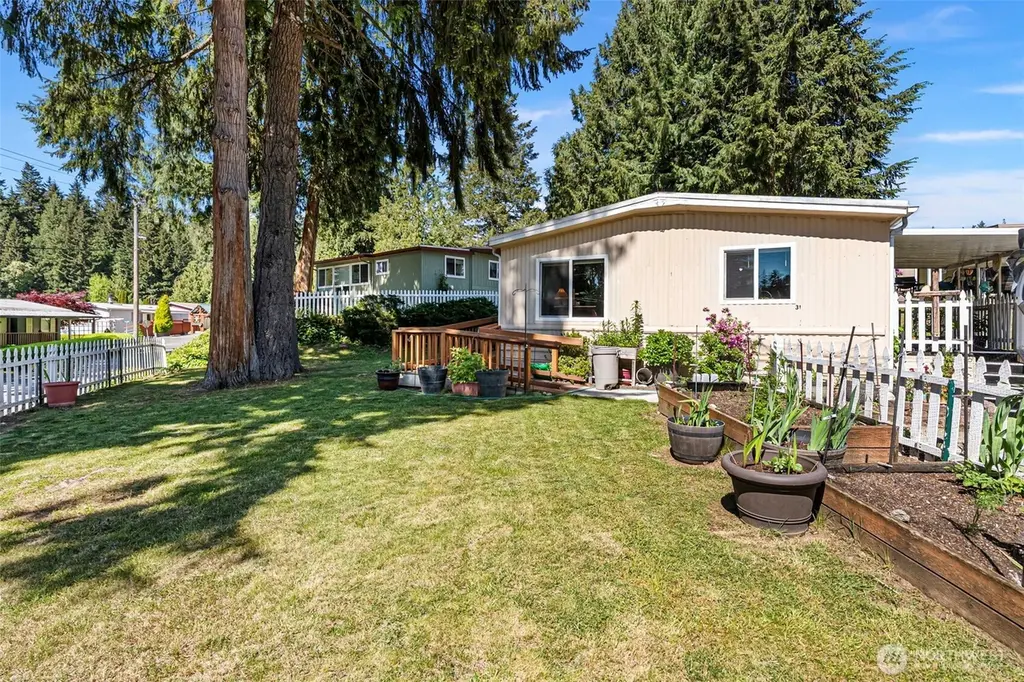
16300 NE State Hwy 305 #31 · Suquamish, WA
Flood risk 1/10 · Minimal
- FEMA flood zone
- X (unshaded)
- Chance of flooding over 30 yrs
- 0.0%
- Est. flood insurance / yr
- $507 – $1,088
Fire risk 3/10 · Minor
- Est. fire insurance / yr
- $604 – $1,122
Heat risk 3/10 · Minor
- Hot days now (above 86°F)
- 7 days/yr
- Hot days in 30 yrs
- 15 days/yr
Wind risk 1/10 · Minimal
- Chance of severe wind over 30 yrs
- —
Air-quality risk 6/10 · Moderate
- Unhealthy air days now
- 9 days/yr
- Unhealthy air days in 30 yrs
- 9 days/yr
Risk factors via First Street. Map © Google.
Why this score? — see what drove the B+ grade
The composite is a weighted blend of 9 inputs, each scored 0–100. Each bar is that input's sub-score; the figure is the points it added to the 100-point composite (weight × sub-score).
- Cash flow +30.0/30.0
- ARV discount +15.0/15.0
- 1% rule +10.0/10.0
- DSCR +10.0/10.0
- Schools +5.4/10.0
- Livability +3.5/5.0
- Rent growth +2.7/5.0
- Condition / age +2.5/5.0
- Appreciation +0.0/10.0
$75,000
🖨 Deal sheet 📄 Offer letter ✓ Due diligence
Listing remarks
Welcome to easy living in Poulsbo’s most desirable 55+ communities! Situated on a sunny corner lot in Cedar Glen, this charming 2-bedroom, .75-bath home offers comfort, convenience, wheel chair accessibility, and low-maintenance living in the heart of Kitsap County. Inside, you’ll find a light-filled layout with inviting living spaces, an efficient kitchen, and thoughtful updates throughout. The spacious yard offers room for gardening, relaxing, or enjoying peaceful mornings with coffee on the patio. Cedar Glen residents enjoy a welcoming community atmosphere complete with a clubhouse and well-maintained paved streets. Conveniently located on the bus line and just minutes from d
Key facts
- Spacious yard
- Clubhouse
- Bus line
Tags
Property features AI
Finance
- Other: Buyer to verify schools
- Financial info: Listing terms: Cash; Land lease amount: $1,029
- HOA & community: Located in Cedar Glen Mobile Home Park (senior community); 97 homes in the park; Park amenities include BBQs, clubhouse, common area, high-speed internet available, recreational area, RV parking; Park approved for sale; Land lease applies
Exterior
- Parking: Uncovered parking
- Utilities: Electric energy source; Public water; Public sewer; Puget Sound Energy power
- Home design: Manufactured home (double wide); One story; Moduline Gilbralter model; Mobile home remains
- Construction: Metal/vinyl construction materials; Torch down roof; Metal skirting; Tie down foundation; Manufactured after 06/15/1976
- Exterior features: Metal/vinyl exterior; Patio/porch/deck; Corner lot; Paved
Interior
- Kitchen: Dishwasher; Microwave; Refrigerator; Stove/Range; Kitchen with eating space
- Bedrooms: 2 bedrooms
- Flooring: Laminate flooring
- Bathrooms: One three-quarter bathroom with shower
- Heating & cooling: Forced air heating
- Interior features: Dining room; Entry; Kitchen with eating space; Living room; Dishwasher; Microwave; Refrigerator; Stove/Range; Washer; Dryer
- Laundry & utility: Washer; Dryer
Neighborhood map
What this means for you Summary
Snapshot
- This is a 2-bed/1.0-bath manufactured listed at $75k.
Deal economics
- At list price, monthly cash flow is $1k ($14k/yr) — positive.
- The deal already cash-flows at list — no discount required.
- Meets the 1% rule at list price ($2k rent vs $75k).
- Recommended offer: $73k (3.0% below list) — sets the bar for market timing.
Location & tenants
- Location reads 69/100 on livability (#262 in WA) — a middle-class / working-renter tenant base. Strengths: housing A+, employment A-, schools B+; Watch: cost of living C-, amenities F, commute F.
- North Kitsap School District (suburban): math 53% / reading 65% proficiency, ranked #54 of 291 in WA (top 19%) — acceptable for families but not a draw, mixed tenant base, ~2y average lease.
- Market conditions: Rents flat; 265 active listings in the ZIP; high-income renter base; 1,294 units permitted in Kitsap County in 2024 (302 in 5+ unit buildings).
Forward outlook
- Local home prices are declining (-3.0%/yr); year-one equity from $519 of loan paydown is wiped out by about $2k of value loss. Plan a longer hold.
- Kitsap County population projected at +8% by 2050 — modest demand growth; plan on rents tracking national, not racing it.
- At projected returns (-3.0% appreciation + 0.7% rent growth), your $21k cash investment doubles in ~2 years — after that, you're playing with house money.
Negotiation context
- It's been on market 37 days — a 3% lower offer ($73k) is reasonable based on typical stale-listing flexibility.
- 3 sale attempts since 14y ago; this cycle's ask has dropped $5k (6%) from the opening price — seller is motivated, your offer sets the floor, not the list.
- Current owner paid $32k; list at $75k implies a 131% gain — meaningful room to come down on a strong offer.
Questions for the listing agent
- It's been on market 37 days. Have you received any prior offers? Is the seller open to a 3% concession, seller financing, or rate buy-down credit?
- Built in 1976 — when were the roof, HVAC, electrical panel, plumbing, and water heater last replaced?
- Is there a deadline driving the sale (1031 exchange, divorce, estate, relocation)? That informs how much negotiation room exists.
- Schools are B-rated — typically a magnet for longer-tenancy family renters. What's the average tenant stay here, and is there a school-zone premium baked into asking?
- What's the average days-on-market for RENTAL listings here right now (not sales)? A rising rental-DOM trend means longer vacancies and softer asking-rent achievability than the comps imply.
- What's the recent tenant-quality profile in this submarket — average credit score on applications, eviction rate, late-payment / NSF rate, and stable-employment percentage? A property-management company in the area should have these aggregated.
- How much new for-sale + rental construction is in the pipeline within 1–3 miles? Heavy new supply typically softens prices + rents 12–24 months out; constrained supply supports both.
Investment metrics
- 1% rule
- 2.80% ✓
- Cap rate
- 24.51%
- Cash-on-cash
- 65.06%
- DSCR
- 3.89
- GRM
- 3.0
CMA / ARV
- ARV (median comp)
- $127,000
- List price
- $75,000
- Delta
- -40.94%
- Verdict
- UNDERPRICED
- Comps
- 1 within 2.0 mi
Show comp detail 2 sales within ~0.75 mi
| Address | Dist | Beds/Ba | Sqft | Sold | Price | $/sf | Match |
|---|---|---|---|---|---|---|---|
| 16300 NE State Highway 305 #25 | 0.01mi | 2/1.0 | 793 (-8%) | 18mo | $55,000 | $69 | 71 |
| 16300 NE State Highway 305 #68 | 0.01mi | 2/2.0 | 960 (+11%) | 12mo | $75,999 | $79 | 67 |
Match score weights: distance 35% · size 25% · config 20% · recency 20%. Top-matched comps best support the ARV.
Projected returns pro-forma
-3.0% appreciation · 0.71% rent growth · sell at horizon
- IRR
- 61.6%
- Equity multiple
- 3.65×
- Total profit
- $55,671
- Equity at exit
- $11,183
- IRR
- 65.4%
- Equity multiple
- 6.88×
- Total profit
- $123,465
- Equity at exit
- $6,485
Cash invested: $21,000 (down + closing). Projections, not guarantees.
Landlord ↔ Tenant lean methodology
- Overall (STATE)
- 28 Tenant-Leaning
- State Washington
- 28 Tenant-Leaning · D+8
- County
- — inherits STATE
- City
- — inherits STATE
ZIP-level market 98370
- Rents YoY
- 0.7%
- Active inventory
- 265
- Price-to-rent
- 3.0×
Monthly cashflow live
- Estimated rent
- $2,097 medium interval (Pro) →
- Mortgage (P&I)
- −$393
- Tax est. 1.5%
- −$94 /mo · $1,125/yr
- Insurance
- −$31
- HOA
- −$0
- Vacancy / Maint / Mgmt
- −$440
- Net cashflow
- $1,139
Break-even live
UW: 25.0% down · 7.5% · 30yr · 1.5% tax · 5.0% vac · 8.0% maint · 8.0% mgmt
Financing live
Cash to close
- Down payment
- $18,750
- Closing costs
- $2,250
- Reserves months
- —
- Total cash needed
- —
Loan-product check · same deal, 3 products live
Conventional
25% down · 7.5% · 30yr
- Down + closing
- —
- Monthly P&I
- —
- Monthly cashflow
- —
- DSCR
- —
- Eligible?
- —
Personal DTI + credit; lowest rate.
DSCR
20% down · 8.5% · 30yr
- Down + closing
- —
- Monthly P&I
- —
- Monthly cashflow
- —
- DSCR
- —
- Eligible?
- —
No personal income docs; deal must DSCR.
Hard money
10% down · 12.0% · 12mo
- Down + closing
- —
- Monthly P&I
- —
- Monthly cashflow
- —
- DSCR
- —
- Eligible?
- —
Short-term bridge; refi at stabilization.
Listing history 23 events
-
2026-06-18days on market $75,000 Active 37 DOM
-
2026-06-17days on market $75,000 Active 36 DOM
-
2026-06-16days on market $75,000 Active 35 DOM
-
2026-06-15days on market $75,000 Active 34 DOM
-
2026-06-14days on market $75,000 Active 32 DOM
-
2026-06-13pricedays on market $75,000 Active 31 DOM
-
2026-06-10days on market $80,000 Active 29 DOM
-
2026-06-09days on market $80,000 Active 28 DOM
-
2026-06-08days on market $80,000 Active 27 DOM
-
2026-06-07days on market $80,000 Active 26 DOM
-
2026-06-02days on market $80,000 Active 21 DOM
-
2026-06-01days on market $80,000 Active 20 DOM
-
2026-05-31days on market $80,000 Active 19 DOM
-
2026-05-30days on market $80,000 Active 18 DOM
-
2026-05-12$80,000 Active
-
2018-10-31soldstatus $32,500 Sold
-
2018-10-25status Pending
-
2018-10-12price $39,999
-
2018-09-26$47,999 Active
-
2013-03-01historical
-
2013-02-28soldstatus $22,000 Sold
-
2013-02-05status Pending Inspection
-
2012-07-30$27,500 Active
ⓘ Source: listings_history table (triggers on properties + properties_extension) + one-shot
backfill from property_details.listing_events for pre-trigger history.
Climate risk First Street
- Flood 1/10 Low FEMA zone X (unshaded) · 0% chance over 30 yrs
- Wildfire 3/10 Moderate
- Heat 3/10 Moderate 7 d/yr ≥86°F today · 15 d/yr by 30 yrs out
- Wind 1/10 Low
- Air quality 6/10 Major 9 unhealthy d/yr today · 9 by 30 yrs out
Nearby sold comps map
Loading sold comps map…
Walkable amenities ~0.75 mi
Loading nearby amenities…
Taxation est. · year 1
- Rental income
- $25,168
- − Mortgage interest
- −$4,201
- − Property taxes
- −$1,125
- − Insurance
- −$375
- − Repairs & maintenance
- −$2,013
- − Management
- −$2,013
- − Depreciation
- −$2,182
- Taxable income
- $13,258
- Est. tax owed @ 24.0%
- −$3,182
- After-tax cash flow
- $10,481/yr
For passive investors: Depreciation is non-cash, so a rental often shows a tax loss while cash-flowing — sheltering income. Rental losses are passive: they offset passive income freely, and up to $25,000/yr can offset ordinary (W-2) income if you actively participate and your MAGI is under $100k (phasing out to $0 by $150k); unused losses carry forward. On sale, claimed depreciation is recaptured at up to 25%, and gains may owe capital-gains tax (a 1031 exchange can defer both). Figures are a year-1 estimate at your 24.0% rate — not tax advice; consult a CPA.
Schools (NCES district)
- District
- North Kitsap School District
- NCES district ID
- 5305760
- Math proficiency
- 53% ▼ -1.00%
- Reading proficiency
- 65% ▲ 1.00%
- Median HH income
- $68,919
- Composite
- 53.68/100
- National rank
- #3092
- State rank
- #54 of 291 in WA
Livability — Suquamish
- Score
- 69/100
- State rank
- #262
- US rank
- #9023
Category grades
Schools grade is shown separately in the Schools card above.
Census & demographics
- Census place
- Suquamish, WA
- County
- Kitsap County · 243,099 people
- City population
- 3,412
- Metro
- Bremerton-Silverdale-Port Orchard, WA
- Population (ZIP)
- 33,655
- Household income
- $116,756
- Rent vs Own
- Severe rent burden
- 904.0
Population outlook (Kitsap County) Hauer SSP2
- Today (2025)
- 277,525 people
- By 2030
- 285,040 · +2.7%
- By 2040
- 294,957 · +6.3%
- By 2050
- 300,622 · +8.3%
- By 2075
- 315,580 · +13.7%
- By 2100
- 304,340 · +9.7%
Race, ethnicity, and origin ACS 2023
- Neighborhood character
- Predominantly White (79%)
- Race & ethnicity
- White 79% Two or more races 11% Hispanic / Latino 9% Asian 3% Black 1%
- Hispanic origin (detail)
- Mexican 5%
- Common ancestry
- Portuguese 7% Italian 4% Slovak 3%
- Foreign-born
- 6% · Canada, South Korea
- Languages at home
- 93% English-only · Spanish 4% Other Indo-European 1% Other Asian/Pacific 1%
Political lean MEDSL · Kitsap
- 2024 margin
- Strong D (+20.9) · D 58.8% · R 37.9% · Other 3.3%
- 2008→2024 swing
- +8.6pp toward D · 2008: 12.3pp · 2024: 20.9pp
- All cycles
- 2024: D+20.9 2020: D+18.1 2016: D+11.6 2012: D+11.1 2008: D+12.3
Not yet ingested
- Civics
- —
Market trends
- HPI YoY
- ▼ -342.47%
- Current HPI
- 347.3427
- Rent YoY
- ▲ 0.71%
- Metro
- Bremerton-Silverdale-Port Orchard, WA
- State GDP YoY
- ▲ 4.65%
- F500 in state
- 22
Industry mix (Fortune 500 HQ in WA)
| Industry | F500 HQs | Revenue |
|---|---|---|
| Retail | 2 | $269B |
|
||
| Technology / Retail | 1 | $638B |
|
||
| Technology | 1 | $245B |
|
||
| Telecommunications | 1 | $38B |
|
||
| Food / Beverage | 1 | $36B |
|
||
| Automotive / Trucks | 1 | $34B |
|
||
Price history
+172.7% since first listed10 events — show timeline
- 2026-06-11 Price Changed $75,000 NWMLS as Distributed by MLS Grid
- 2026-05-12 Listed $80,000 NWMLS as Distributed by MLS Grid
- 2018-10-31 Sold (MLS) $32,500 NWMLS as Distributed by MLS Grid
- 2018-10-25 Pending — NWMLS as Distributed by MLS Grid
- 2018-10-12 Price Changed $39,999 NWMLS as Distributed by MLS Grid
- 2018-09-26 Listed $47,999 NWMLS as Distributed by MLS Grid
- 2013-03-01 Delisted — NWMLS as Distributed by MLS Grid
- 2013-02-28 Sold (MLS) $22,000 NWMLS as Distributed by MLS Grid
- 2013-02-05 Pending — NWMLS as Distributed by MLS Grid
- 2012-07-30 Listed $27,500 NWMLS as Distributed by MLS Grid
Cash-flow waterfall
monthlySold comps — $/sqft
last 12 mo · ≤1 miLoading sold comps…