 Triplex
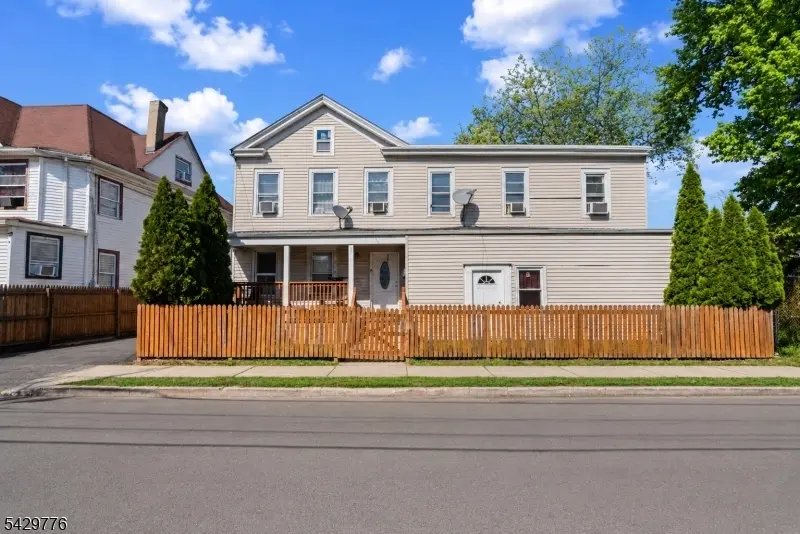
111-115 Liberty St · Plainfield, NJ
Flood risk 1/10 · Minimal
- FEMA flood zone
- X (unshaded)
- Chance of flooding over 30 yrs
- 0.0%
- Est. flood insurance / yr
- $507 – $1,088
Fire risk 2/10 · Minimal
- Est. fire insurance / yr
- $526 – $976
Heat risk 7/10 · Major
- Hot days now (above 103°F)
- 7 days/yr
- Hot days in 30 yrs
- 15 days/yr
Wind risk 6/10 · Moderate
- Chance of severe wind over 30 yrs
- 27.0%
Air-quality risk 4/10 · Minor
- Unhealthy air days now
- 4 days/yr
- Unhealthy air days in 30 yrs
- 5 days/yr
Risk factors via First Street. Map © Google.
Why this score? — see what drove the C grade
The composite is a weighted blend of 9 inputs, each scored 0–100. Each bar is that input's sub-score; the figure is the points it added to the 100-point composite (weight × sub-score).
- Cash flow +19.6/30.0
- ARV discount +7.5/15.0
- DSCR +6.2/10.0
- 1% rule +5.2/10.0
- Appreciation +5.0/10.0
- Condition / age +3.8/5.0
- Livability +3.2/5.0
- Rent growth +2.5/5.0
- Schools +2.2/10.0
$619,000
🖨 Deal sheet 📄 Offer letter ✓ Due diligence
Multi-family units
County records classify this as Multi-Family (2-4 Unit). Listing-text estimate: 3 units. confirmed
Listing remarks
Spacious three family home in Plainfield New Jersey featuring an oversize parking area with space for about 9 cars, conveniently located near shopping, schools, restaurants and public transportation and just six blocks from the Plainfield train station for an easy New York City commute. Excellent opportunity for investors or owner occupied seeking strong rental potential and ample parking spaces. Buyer responsible for CO.
Key facts
- 9 parking spots
- Built 1900
- Listed 40 days
Property features AI
Finance
- Other: Owner/tenant payment arrangements specified per unit
- Financial info: 3-unit multifamily property; Operating income and expenses reported as 0; Expenses include insurance and taxes
Exterior
- Parking: 9 parking spaces; Blacktop driveway
- Utilities: All utilities underground; Electric service available; Natural gas available; Public sewer; Public water
- Home design: 2-story unit style; Approximate year built
- Construction: Vinyl siding; Asphalt shingle roof
- Exterior features: Metal fence; Level lot
Interior
- Kitchen: Each unit includes a kitchen
- Bedrooms: Unit 1: 4 bedrooms (single level); Unit 2: 1 bedroom (two levels); Unit 3: 1 bedroom (three levels)
- Bathrooms: 4 full bathrooms total; Unit 1: 2 bathrooms; Unit 2: 1 bathroom; Unit 3: 1 bathroom
- Heating & cooling: Forced hot air heating (3 units); Natural gas fuel; Wall A/C units; Window A/C units
- Interior features: Carbon monoxide detector; Smoke detector; Finished (partial) basement; Has basement; Water heater: see remarks
- Laundry & utility: Owner pays water for all units; Tenants pay electric, gas, and heat for their units
Neighborhood map
What this means for you Summary
Snapshot
- This is a 3 × 2-bed/1.3-bath units multifamily listed at $619k. Condition is rated good.
Deal economics
- At list price, monthly cash flow is $712 ($9k/yr) — positive. Per door: $237/mo.
- The deal already cash-flows at list — no discount required.
- Meets the 1% rule at list price ($6k rent vs $619k).
- Recommended offer: $600k (3.0% below list) — sets the bar for market timing.
- Cap rate 7.7% vs local median 3.4% in Plainfield — top-decile yield for the area; either an underpriced asset or a hidden risk that comps aren't pricing in. Stress-test before assuming the spread holds.
Location & tenants
- Location reads 65/100 on livability (#384 in NJ) — a middle-class / working-renter tenant base. Strengths: commute A+, housing A-; Watch: crime D+, amenities F, cost of living F.
- Plainfield Public School District (suburban): math 17% / reading 25% proficiency, ranked #588 of 612 in NJ (top 96%) — low school quality limits family demand, transient renter base, plan for 1-2y turnover; 74% free/reduced lunch — lower-income household profile, screen leases tightly.
- Zoned schools: Plainfield High School (1,925 students, 78% FRL).
- Market conditions: 1 active listings in the ZIP; 3 comparable units currently listed for rent nearby; rentals at typical pace (median 19d on market — plan ~3-4 weeks tenant-placement turnaround); 1,749 units permitted in Union County in 2024 (1,421 in 5+ unit buildings).
Forward outlook
- In year one you build about $23k of equity ($4k loan paydown + $19k appreciation (3.0% local appreciation)).
- Union County population projected at +17% by 2050 — long-run rental-demand tailwind backs the buy-and-hold thesis.
- At projected returns (3.0% appreciation + 3.0% rent growth), your $173k cash investment doubles in ~5 years — after that, you're playing with house money.
- By year 2, paydown + projected appreciation supports a ~$37k cash-out refi (75% LTV) — recoverable capital for the next deal without selling this one.
Negotiation context
- It's been on market 40 days — a 3% lower offer ($600k) is reasonable based on typical stale-listing flexibility.
Risks & watch-outs
- Watch-outs: built in 1900 — expect roof / HVAC / electrical / plumbing capex.
- Climate carrying-cost: major wind risk, 27% chance of damaging wind over 30y; extreme-heat days projected 7→15/yr by 2055 (HVAC capex compounding) — expect insurance premiums to compound above CPI over the hold.
Questions for the listing agent
- It's been on market 40 days. Have you received any prior offers? Is the seller open to a 3% concession, seller financing, or rate buy-down credit?
- Can we see the unit-by-unit rent roll, current vacancy, and any below-market leases? What's the average tenancy length?
- What capital expenditures (roof, boiler, parking lot, exteriors) have been made in the last 5 years, and what's planned in the next 2?
- Built in 1900 — when were the roof, HVAC, electrical panel, plumbing, and water heater last replaced?
- Is there a deadline driving the sale (1031 exchange, divorce, estate, relocation)? That informs how much negotiation room exists.
- Schools are D-rated, which usually means shorter tenancies and higher turnover. Who's the typical renter profile here, and what's been the actual vacancy rate?
- Crime grade is D in this area — have there been break-ins, vandalism, or insurance claims at this property in the last 3 years? What carrier currently insures it and at what premium?
- What's the average days-on-market for RENTAL listings here right now (not sales)? A rising rental-DOM trend means longer vacancies and softer asking-rent achievability than the comps imply.
- What's the recent tenant-quality profile in this submarket — average credit score on applications, eviction rate, late-payment / NSF rate, and stable-employment percentage? A property-management company in the area should have these aggregated.
- How much new apartment / multifamily construction is in the pipeline within 1–3 miles? Heavy new supply (>2% of stock underway) typically softens rents 12–24 months out; light construction supports rent growth.
Investment metrics
- 1% rule
- 1.02% ✓
- Cap rate
- 7.67%
- Cash-on-cash
- 4.93%
- DSCR
- 1.22
- GRM
- 8.2
CMA / ARV
No comps found within radius.
Show comp detail 3 sales within ~0.75 mi
| Address | Dist | Beds/Ba | Sqft | Sold | Price | $/sf | Match |
|---|---|---|---|---|---|---|---|
| 425 John St | 0.39mi | 6/3.0 | 1,664 | 9mo | $570,000 | $343 | 59 |
| 74 Mercer Ave | 0.36mi | 6/2.0 | 2,732 | 6mo | $730,000 | $267 | 58 |
| 427 John St | 0.39mi | 6/3.0 | 1,616 | 12mo | $600,000 | $371 | 56 |
Match score weights: distance 35% · size 25% · config 20% · recency 20%. Top-matched comps best support the ARV.
Projected returns pro-forma
3.0% appreciation · 3.0% rent growth · sell at horizon
- IRR
- 12.1%
- Equity multiple
- 1.69×
- Total profit
- $120,002
- Equity at exit
- $278,329
- IRR
- 14.2%
- Equity multiple
- 3.10×
- Total profit
- $363,883
- Equity at exit
- $428,939
Cash invested: $173,320 (down + closing). Projections, not guarantees.
Landlord ↔ Tenant lean methodology
- Overall (STATE)
- 21 Tenant-Leaning
- State New Jersey
- 21 Tenant-Leaning · D+6
- County
- — inherits STATE
- City
- — inherits STATE
ZIP-level market 07060-1123
- Active inventory
- 1
- Price-to-rent
- 24.5×
Monthly cashflow live
- Estimated rent
- $6,316 high interval (Pro) →
- Mortgage (P&I)
- −$3,246
- Tax est. 1.5%
- −$774 /mo · $9,285/yr
- Insurance
- −$258
- HOA
- −$0
- Vacancy / Maint / Mgmt
- −$1,326
- Net cashflow
- $712
Break-even live
3-unit breakdown (identical units grouped — click to expand)
| Units | Beds | Baths | Est. rent |
|---|---|---|---|
| 3× units | 2 | 1.3 | $6,315 |
| #1 | 2 | 1.3 | $2,105 |
| #2 | 2 | 1.3 | $2,105 |
| #3 | 2 | 1.3 | $2,105 |
| Total (3 units) | $6,316 | ||
UW: 25.0% down · 7.5% · 30yr · 1.5% tax · 5.0% vac · 8.0% maint · 8.0% mgmt
Financing live
Cash to close
- Down payment
- $154,750
- Closing costs
- $18,570
- Reserves months
- —
- Total cash needed
- —
Loan-product check · same deal, 3 products live
Conventional
25% down · 7.5% · 30yr
- Down + closing
- —
- Monthly P&I
- —
- Monthly cashflow
- —
- DSCR
- —
- Eligible?
- —
Personal DTI + credit; lowest rate.
DSCR
20% down · 8.5% · 30yr
- Down + closing
- —
- Monthly P&I
- —
- Monthly cashflow
- —
- DSCR
- —
- Eligible?
- —
No personal income docs; deal must DSCR.
Hard money
10% down · 12.0% · 12mo
- Down + closing
- —
- Monthly P&I
- —
- Monthly cashflow
- —
- DSCR
- —
- Eligible?
- —
Short-term bridge; refi at stabilization.
Rent comps 3 comps
| Address | Beds | Baths | Sqft | Rent | $/sqft | DOM | Units | Dist |
|---|---|---|---|---|---|---|---|---|
| 124 Lafayette Pl Plainfield, NJ | 5.0 | 3.0 | 2352 | $4,100 | $1.74 | 2d | 1 | 0.39mi |
| 325 Stebbins Pl Unit 2 Plainfield, NJ | 5.0 | 1.0 | — | $3,150 | — | 24d | 1 | 0.78mi |
| 1145 Evergreen Ave Unit 1 Plainfield, NJ | 5.0 | 2.5 | 4000 | $5,000 | $1.25 | 18d | 1 | 1.07mi |
Listing history 12 events
-
2026-06-16statusdays on market $619,000 Under Contract 40 DOM
-
2026-06-15days on market $619,000 Active 39 DOM
-
2026-06-13days on market $619,000 Active 37 DOM
-
2026-06-09days on market $619,000 Active 33 DOM
-
2026-06-08days on market $619,000 Active 32 DOM
-
2026-06-07days on market $619,000 Active 31 DOM
-
2026-06-04days on market $619,000 Active 28 DOM
-
2026-06-03days on market $619,000 Active 27 DOM
-
2026-06-02days on market $619,000 Active 26 DOM
-
2026-06-01days on market $619,000 Active 25 DOM
-
2026-05-31days on market $619,000 Active 24 DOM
-
2026-05-07$619,000 Active
ⓘ Source: listings_history table (triggers on properties + properties_extension) + one-shot
backfill from property_details.listing_events for pre-trigger history.
Climate risk First Street
- Flood 1/10 Low FEMA zone X (unshaded) · 0% chance over 30 yrs
- Wildfire 2/10 Low
- Heat 7/10 Severe 7 d/yr ≥103°F today · 15 d/yr by 30 yrs out
- Wind 6/10 Major 27% chance of damaging wind over 30 yrs
- Air quality 4/10 Moderate 4 unhealthy d/yr today · 5 by 30 yrs out
Nearby sold comps map
Loading sold comps map…
Walkable amenities ~0.75 mi
Loading nearby amenities…
Taxation est. · year 1
- Rental income
- $75,792
- − Mortgage interest
- −$34,674
- − Property taxes
- −$9,285
- − Insurance
- −$3,095
- − Repairs & maintenance
- −$6,063
- − Management
- −$6,063
- − Depreciation
- −$18,007
- Taxable loss
- −$1,396
- Est. tax savings @ 24.0%
- +$335
- After-tax cash flow
- $8,877/yr
For passive investors: Depreciation is non-cash, so a rental often shows a tax loss while cash-flowing — sheltering income. Rental losses are passive: they offset passive income freely, and up to $25,000/yr can offset ordinary (W-2) income if you actively participate and your MAGI is under $100k (phasing out to $0 by $150k); unused losses carry forward. On sale, claimed depreciation is recaptured at up to 25%, and gains may owe capital-gains tax (a 1031 exchange can defer both). Figures are a year-1 estimate at your 24.0% rate — not tax advice; consult a CPA.
Condition & rehab AI · 13 photos
This three-family home in Plainfield, NJ is in good condition with a good exterior and interior. It has a spacious parking area and is conveniently located near shopping, schools, restaurants, and public transportation. Painting, updating the kitchen, and landscaping improvements would increase its value.
Value-add opportunities
- Both Painting the exterior and interior — Fresh paint can enhance the curb appeal and interior aesthetics, making the property more attractive to potential buyers and renters.
- Both Updating the kitchen appliances — Modernizing the kitchen with new appliances can increase the property's value and appeal to a wider range of buyers and renters.
- Both Landscaping improvements — Enhancing the landscaping can improve the property's curb appeal and make it more attractive to potential buyers and renters.
Renovation cost estimate screening
Value-add ROI direction
- Both Painting the exterior and interior — Fresh paint can enhance the curb appeal and interior aesthetics, making the property more attractive to potential buyers and renters. ↑
- Both Updating the kitchen appliances — Modernizing the kitchen with new appliances can increase the property's value and appeal to a wider range of buyers and renters. ↑
- Both Landscaping improvements — Enhancing the landscaping can improve the property's curb appeal and make it more attractive to potential buyers and renters. ↑
ⓘ Cost ranges are severity-bucket heuristics (US national rule-of-thumb). Get contractor quotes + a written scope before underwriting a rehab budget.
Schools (NCES district)
- District
- Plainfield Public School District
- NCES district ID
- 3413140
- Math proficiency
- 17% ▲ 1.00%
- Reading proficiency
- 25% ▲ 1.00%
- Median HH income
- $52,983
- Composite
- 22.21/100
- National rank
- #13512
- State rank
- #588 of 612 in NJ
Livability — Plainfield
- Score
- 65/100
- State rank
- #384
- US rank
- #13086
Category grades
Schools grade is shown separately in the Schools card above.
Census & demographics
- Census place
- Plainfield, NJ
Population outlook (Union County) Hauer SSP2
- Today (2025)
- 596,450 people
- By 2030
- 616,880 · +3.4%
- By 2040
- 658,185 · +10.4%
- By 2050
- 696,707 · +16.8%
- By 2075
- 785,448 · +31.7%
- By 2100
- 836,583 · +40.3%
Not yet ingested
- Political lean
- —
- Race & ethnicity
- —
- Common origin
- —
- Civics
- —
Market trends
- HPI YoY
- —
- Current HPI
- —
- Rent YoY
- —
- Metro
- —
- State GDP YoY
- ▲ 2.05%
- F500 in state
- 34
Industry mix (Fortune 500 HQ in NJ)
| Industry | F500 HQs | Revenue |
|---|---|---|
| Consumer Goods | 3 | $31B |
|
||
| Pharmaceuticals | 2 | $153B |
|
||
| Technology | 2 | $21B |
|
||
| Insurance | 2 | $20B |
|
||
| Healthcare | 2 | $19B |
|
||
| Financial Services | 1 | $70B |
|
||
Price history
1 event — show timeline
- 2026-05-07 Listed $619,000 GSMLS
Cash-flow waterfall
monthlySold comps — $/sqft
last 12 mo · ≤1 miLoading sold comps…