440 Suffolk Dr · Ferris, TX
Flood risk No data
- FEMA flood zone
- —
- Chance of flooding over 30 yrs
- —
- Est. flood insurance / yr
- —
Fire risk No data
- Est. fire insurance / yr
- —
Heat risk No data
- Hot days now (above threshold)
- —
- Hot days in 30 yrs
- —
Wind risk No data
- Chance of severe wind over 30 yrs
- —
Air-quality risk No data
- Unhealthy air days now
- —
- Unhealthy air days in 30 yrs
- —
Risk factors via First Street. Map © Google.
Why this score? — see what drove the F grade
The composite is a weighted blend of 9 inputs, each scored 0–100. Each bar is that input's sub-score; the figure is the points it added to the 100-point composite (weight × sub-score).
- Cash flow +7.3/30.0
- Livability +3.5/5.0
- Rent growth +2.5/5.0
- Schools +2.5/10.0
- Condition / age +2.5/5.0
- ARV discount +2.4/15.0
- DSCR +1.5/10.0
- 1% rule +0.9/10.0
- Appreciation +0.0/10.0
$366,900
🖨 Deal sheet (PDF) 📄 Offer letter ✓ Due diligence
Listing remarks MLS
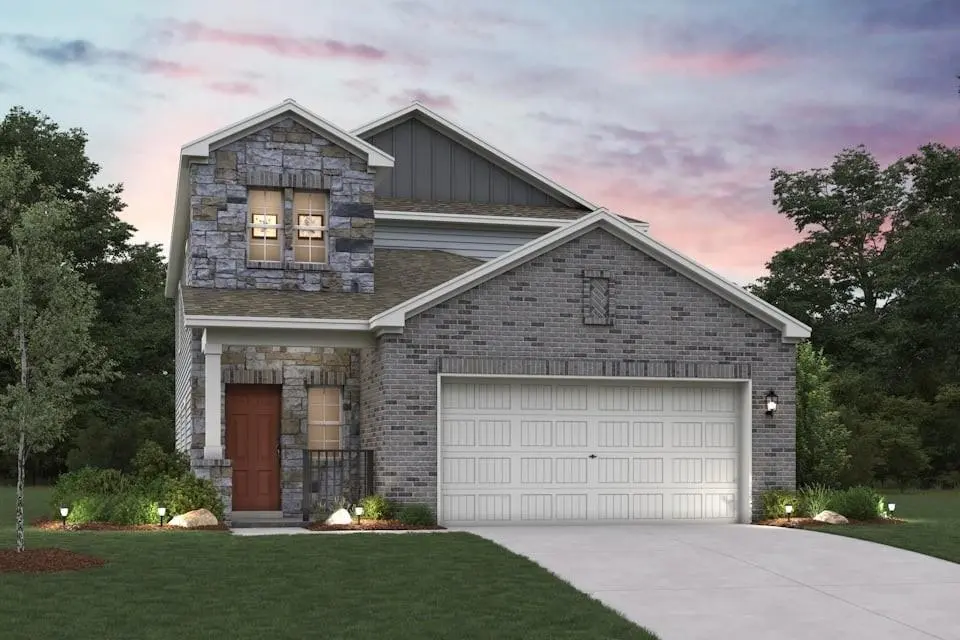
The Willow at Sperling Farms offers the perfect blend of space, style, and functionality across two thoughtfully designed stories. The main floor features a private primary suite with a large walk-in closet and a luxurious bath, along with an open-concept living, dining, and kitchen area that's perfect for entertaining or everyday living. Upstairs, three additional bedrooms share a full bath, accompanied by a versatile loft space—ideal for a media room, play area, or optional fifth bedroom. With approximately 2,512 square feet of living space, a covered patio, and a 2-bay garage, the Willow delivers a smart layout built for modern living. Conveniently located near I-45, Ferris offers a short drive to economic, entertainment and cultural hubs across the Dallas-Fort Worth metro area—plus local attractions, such as restaurants, shops, and year-round community events. You’ll love a charming small-town atmosphere that's only 20 miles from urban amenities in downtown Dallas! Est. April completion!
Key facts
- Versatile loft space
- Covered patio
- Large walk-in closet
Tags
Neighborhood map
What this means for you Summary
Snapshot
- This is a 4-bed/2.5-bath land listed at $367k.
Deal economics
- At list price, monthly cash flow is $-483 ($-6k/yr) — negative.
- To cash-flow at today's rent, offer at most $282k (23.3% below list).
- To meet the 1% rule (rent ≥ 1% of price), the offer needs to be $215k (41.4% below list).
- Recommended offer: $215k (41.4% below list) — sets the bar for 1% rule.
Location & tenants
- Location reads 69/100 on livability (#401 in TX) — a middle-class / working-renter tenant base. Strengths: employment A+, cost of living A+, housing A+; Watch: crime C-, amenities F, commute F.
- Ferris ISD (rural): math 28% / reading 29% proficiency, ranked #634 of 826 in TX (top 77%) — low school quality limits family demand, transient renter base, plan for 1-2y turnover; 67% free/reduced lunch — lower-income household profile, screen leases tightly.
- Zoned schools: Lucy Mae Mcdonald El (math 40% / reading 33%, grade F, #1,883 of 4,322 statewide, top 44%, 620 students, 83% FRL); Ferris J H (math 22% / reading 23%, grade F, #1,341 of 1,662 statewide, top 82%, 590 students, 79% FRL); Ferris H S (math 22% / reading 38%, grade F, #1,096 of 1,632 statewide, top 68%, 821 students, 76% FRL).
- Market conditions: 127 active listings in the ZIP; 12 comparable units currently listed for rent nearby; rentals at typical pace (median 23d on market — plan ~3-4 weeks tenant-placement turnaround); 3,016 units permitted in Ellis County in 2024 (20 in 5+ unit buildings).
Forward outlook
- Local home prices are declining (-3.0%/yr); year-one equity from $3k of loan paydown is wiped out by about $11k of value loss. Plan a longer hold.
- Ellis County population projected at +36% by 2050 — long-run rental-demand tailwind backs the buy-and-hold thesis.
Negotiation context
- It's been on market 122 days — a 12% lower offer ($323k) is reasonable based on typical stale-listing flexibility.
Questions for the listing agent
- What do current leases actually rent for vs. the listed asking? Can we see a recent rent roll and the last 12 months of T-12 income?
- It's been on market 122 days. Have you received any prior offers? Is the seller open to a 41% concession, seller financing, or rate buy-down credit?
- What does the HOA fee cover, when was the last increase, and are there any pending special assessments or reserve-fund shortfalls?
- Why hasn't it sold? Are there any deal-killer items the seller is aware of (foundation, flood, title, zoning, code violations)?
- Is there a deadline driving the sale (1031 exchange, divorce, estate, relocation)? That informs how much negotiation room exists.
- Schools are F-rated, which usually means shorter tenancies and higher turnover. Who's the typical renter profile here, and what's been the actual vacancy rate?
- The area grade is low — what's the realistic commute time and amenity access for the typical tenant pool here? Any planned neighborhood developments (good or bad) we should know about?
- What's the average days-on-market for RENTAL listings here right now (not sales)? A rising rental-DOM trend means longer vacancies and softer asking-rent achievability than the comps imply.
- What's the recent tenant-quality profile in this submarket — average credit score on applications, eviction rate, late-payment / NSF rate, and stable-employment percentage? A property-management company in the area should have these aggregated.
- How much new for-sale + rental construction is in the pipeline within 1–3 miles? Heavy new supply typically softens prices + rents 12–24 months out; constrained supply supports both.
Investment metrics
- 1% rule
- 0.59% ✗
- Cap rate
- 4.71%
- Cash-on-cash
- -5.65%
- DSCR
- 0.75
- GRM
- 14.2
CMA / ARV
- ARV (median comp)
- $329,667
- List price
- $366,900
- Delta
- 11.29%
- Verdict
- OVERPRICED
- Comps
- 20 within 1.0 mi
Projected returns pro-forma
-3.0% appreciation · 3.0% rent growth · sell at horizon
- IRR
- -26.0%
- Equity multiple
- 0.12×
- Total profit
- $-90,426
- Equity at exit
- $54,706
- IRR
- -23.1%
- Equity multiple
- -0.16×
- Total profit
- $-119,138
- Equity at exit
- $31,723
Cash invested: $102,732 (down + closing). Projections, not guarantees.
Landlord ↔ Tenant lean methodology
- Overall (STATE)
- 87 Strongly Landlord-Friendly
- State Texas
- 87 Strongly Landlord-Friendly · R+5
- County
- — inherits STATE
- City
- — inherits STATE
ZIP-level market 75125
- Home prices YoY
- -6.4%
- Active inventory
- 127
- Price-to-rent
- 14.2×
Monthly cashflow live
- Estimated rent
- $2,149 high interval (Pro) →
- Mortgage (P&I)
- −$1,924
- Tax from tax record
- −$91 /mo · $1,092/yr
- Insurance
- −$153
- HOA
- −$13
- Vacancy / Maint / Mgmt
- −$451
- Net cashflow
- $-483
Break-even live
Sensitivity live
| Price | -10% $-276 | -5% $-380 | +0% $-483 | +5% $-587 | +10% $-691 |
|---|---|---|---|---|---|
| Rent | -10% $-653 | -5% $-568 | +0% $-483 | +5% $-399 | +10% $-314 |
| Rate | -1.0pp $-299 | -0.5pp $-390 | base $-483 | +0.5pp $-578 | +1.0pp $-675 |
UW: 25.0% down · 7.5% · 30yr · 1.5% tax · 5.0% vac · 8.0% maint · 8.0% mgmt
Financing live
Cash to close
- Down payment
- $91,725
- Closing costs
- $11,007
- Reserves months
- —
- Total cash needed
- —
Loan-product check · same deal, 3 products live
Conventional
25% down · 7.5% · 30yr
- Down + closing
- —
- Monthly P&I
- —
- Monthly cashflow
- —
- DSCR
- —
- Eligible?
- —
Personal DTI + credit; lowest rate.
DSCR
20% down · 8.5% · 30yr
- Down + closing
- —
- Monthly P&I
- —
- Monthly cashflow
- —
- DSCR
- —
- Eligible?
- —
No personal income docs; deal must DSCR.
Hard money
10% down · 12.0% · 12mo
- Down + closing
- —
- Monthly P&I
- —
- Monthly cashflow
- —
- DSCR
- —
- Eligible?
- —
Short-term bridge; refi at stabilization.
Rent comps 12 comps
| Address | Beds | Baths | Sqft | Rent | $/sqft | DOM | Units | Dist |
|---|---|---|---|---|---|---|---|---|
| 485 Norfolk Dr Ferris, TX | 4.0 | 2.0 | 1773 | $2,275 | $1.28 | 22d | 1 | 0.26mi |
| 111 S Wood St Unit B Ferris, TX | 3.0 | 2.0 | 2200 | $1,700 | $0.77 | 45d | 1 | 0.34mi |
| 100 Clark Dr Ferris, TX | 3.0 | 2.0 | 1810 | $2,025 | $1.12 | 6d | 1 | 0.64mi |
| 860 Newport Dr Ferris, TX | 4.0 | 3.0 | 2082 | $2,395 | $1.15 | 3d | 1 | 0.66mi |
| 309 Jennie Marie Cir Ferris, TX | 3.0 | 2.0 | 1775 | $1,999 | $1.13 | 45d | 1 | 0.81mi |
| 309 Jennie Marie Cir Ferris, TX | 3.0 | 2.0 | 1775 | $1,999 | $1.13 | 17d | 1 | 0.81mi |
| 308 Micah Ln Ferris, TX | 4.0 | 2.5 | 2588 | $2,325 | $0.90 | 0d | 1 | 0.89mi |
| 808 Clark Dr Ferris, TX | 4.0 | 2.5 | 2153 | $2,379 | $1.10 | 25d | 1 | 0.94mi |
| 833 Serena Dr Ferris, TX | 4.0 | 2.0 | 1822 | $2,500 | $1.37 | 0d | 1 | 0.96mi |
| 841 Serena Dr Ferris, TX | 4.0 | 2.5 | 2153 | $2,395 | $1.11 | 0d | 1 | 0.97mi |
| 206 S Meadow Dr Ferris, TX | 3.0 | 2.0 | 2206 | $8,950 | $4.06 | 23d | 1 | 0.98mi |
| 206 S Meadow Dr Unit 1520042P Ferris, TX | 3.0 | 2.0 | 2195 | $12,712 | $5.79 | 23d | 1 | 0.98mi |
HOA detail
- Monthly dues
- $13 · $156/yr
Listing history 2 events
-
2026-01-18$366,900 Active 1024-char remark
Show marketing remark (1024 chars)
The Willow at Sperling Farms offers the perfect blend of space, style, and functionality across two thoughtfully designed stories. The main floor features a private primary suite with a large walk-in closet and a luxurious bath, along with an open-concept living, dining, and kitchen area that's perfect for entertaining or everyday living. Upstairs, three additional bedrooms share a full bath, accompanied by a versatile loft space—ideal for a media room, play area, or optional fifth bedroom. With approximately 2,512 square feet of living space, a covered patio, and a 2-bay garage, the Willow delivers a smart layout built for modern living. Conveniently located near I-45, Ferris offers a short drive to economic, entertainment and cultural hubs across the Dallas-Fort Worth metro area—plus local attractions, such as restaurants, shops, and year-round community events. You’ll love a charming small-town atmosphere that's only 20 miles from urban amenities in downtown Dallas! Est. April completion!
-
2024-10-03soldstatus
ⓘ Source: listings_history table (triggers on properties + properties_extension) + one-shot
backfill from property_details.listing_events for pre-trigger history.
Tax reassessment forecast TX · Resets to sale price
- Current annual tax
- $1,092 · $91/mo
- Projected year-2 tax
- $6,714 · $560/mo
- Expected delta
- +$5,622/yr (+$469/mo · 515.0%)
ⓘ Screening estimate from a state-policy table — verify with the county assessor before closing.
Nearby sold comps map
Loading sold comps map…
Walkable amenities ~0.75 mi
Loading nearby amenities…
Taxation est. · year 1
- Rental income
- $25,785
- − Mortgage interest
- −$20,552
- − Property taxes
- −$1,092
- − Insurance
- −$1,834
- − Repairs & maintenance
- −$2,063
- − Management
- −$2,063
- − HOA
- −$156
- − Depreciation
- −$10,673
- Taxable loss
- −$12,648
- Est. tax savings @ 24.0%
- +$3,036
- After-tax cash flow
- $-2,765/yr
For passive investors: Depreciation is non-cash, so a rental often shows a tax loss while cash-flowing — sheltering income. Rental losses are passive: they offset passive income freely, and up to $25,000/yr can offset ordinary (W-2) income if you actively participate and your MAGI is under $100k (phasing out to $0 by $150k); unused losses carry forward. On sale, claimed depreciation is recaptured at up to 25%, and gains may owe capital-gains tax (a 1031 exchange can defer both). Figures are a year-1 estimate at your 24.0% rate — not tax advice; consult a CPA.
Schools (NCES district)
- District
- Ferris ISD
- NCES district ID
- 4819170
- Math proficiency
- 28% ▼ -9.00%
- Reading proficiency
- 29% ▼ -3.00%
- Median HH income
- $53,468
- Composite
- 25.3/100
- National rank
- #7486
- State rank
- #634 of 826 in TX
Livability — Ferris
- Score
- 69/100
- State rank
- #401
- US rank
- #8294
Category grades
Schools grade is shown separately in the Schools card above.
Census & demographics
- Census place
- Ferris, TX
- Population (ZIP)
- 7,154
Population outlook (Ellis County) Hauer SSP2
- Today (2025)
- 194,556 people
- By 2030
- 209,679 · +7.8%
- By 2040
- 238,837 · +22.8%
- By 2050
- 265,451 · +36.4%
- By 2075
- 326,571 · +67.9%
- By 2100
- 362,156 · +86.1%
Race, ethnicity, and origin ACS 2023
- Neighborhood character
- Diverse neighborhood (Simpson 0.57)
- Race & ethnicity
- Hispanic / Latino 57% White 32% Two or more races 25% Black 10% Native American 3%
- Hispanic origin (detail)
- Mexican 54%
- Common ancestry
- Iranian 1% Slovak 1% Lithuanian 0%
- Foreign-born
- 9% · Canada
- Languages at home
- 57% English-only · Spanish 42%
Political lean MEDSL · Ellis
- 2024 margin
- Solid R (+31.1) · D 34.0% · R 65.1%
- 2008→2024 swing
- +11.2pp toward D · 2008: -42.2pp · 2024: -31.1pp
- All cycles
- 2024: R+31.1 2020: R+34.1 2016: R+45.4 2012: R+47.5 2008: R+42.2
Not yet ingested
- Civics
- —
Market trends
- HPI YoY
- ▼ -16.54%
- Current HPI
- 243.4525
- Rent YoY
- —
- Metro
- —
- State GDP YoY
- ▲ 3.95%
- F500 in state
- 110
Industry mix (Fortune 500 HQ in TX)
| Industry | F500 HQs | Revenue |
|---|---|---|
| Energy | 16 | $1,198B |
|
||
| Technology | 5 | $198B |
|
||
| Engineering / Construction | 4 | $72B |
|
||
| Energy Services | 3 | $60B |
|
||
| Utilities | 3 | $41B |
|
||
| Healthcare | 2 | $330B |
|
||
Price history
2 events — show timeline
- 2026-01-18 Listed $366,900 NTREIS
- 2024-10-03 Sold (Public Records) — Public Records
Cash-flow waterfall
monthlySold comps — $/sqft
last 12 mo · ≤1 miLoading sold comps…