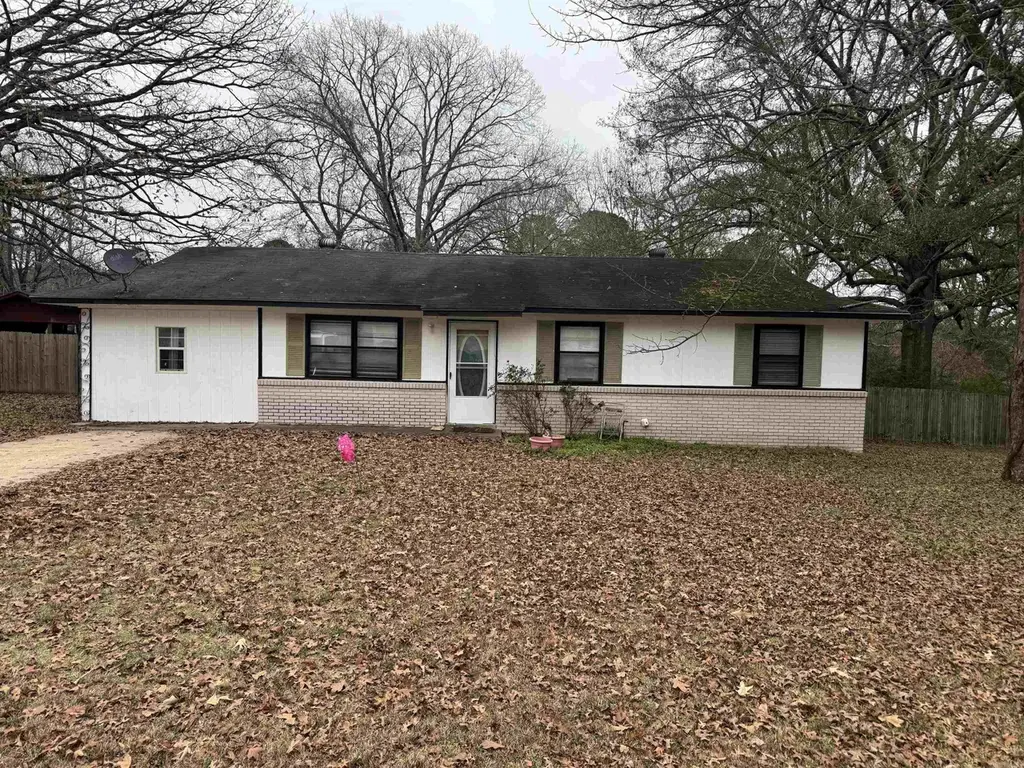
17804 Cullipher Ln · East End, AR
Flood risk 1/10 · Minimal
- FEMA flood zone
- X (unshaded)
- Chance of flooding over 30 yrs
- 0.0%
- Est. flood insurance / yr
- $507 – $1,088
Fire risk 5/10 · Moderate
- Est. fire insurance / yr
- $1,499 – $2,785
Heat risk 6/10 · Moderate
- Hot days now (above 111°F)
- 7 days/yr
- Hot days in 30 yrs
- 19 days/yr
Wind risk 4/10 · Minor
- Chance of severe wind over 30 yrs
- 12.0%
Air-quality risk 2/10 · Minimal
- Unhealthy air days now
- 0 days/yr
- Unhealthy air days in 30 yrs
- 1 days/yr
Risk factors via First Street. Map © Google.
Why this score? — see what drove the C- grade
The composite is a weighted blend of 9 inputs, each scored 0–100. Each bar is that input's sub-score; the figure is the points it added to the 100-point composite (weight × sub-score).
- Cash flow +19.5/30.0
- ARV discount +10.7/15.0
- DSCR +6.2/10.0
- 1% rule +4.4/10.0
- Rent growth +3.3/5.0
- Livability +3.1/5.0
- Schools +2.6/10.0
- Condition / age +2.5/5.0
- Appreciation +0.0/10.0
$140,000
🖨 Deal sheet (PDF) 📄 Offer letter ✓ Due diligence
Listing remarks MLS
CHECK OUT THIS HOME!! 3 bedroom and 1.5 bath, located near the interstate, I-530 off of Bingham Rd. This home has newly done floors in most of the areas! You can enjoy sitting outside in the fenced in back yard that comes with a barn like shop and plenty of storage. You are close to Little Rock and the Airport as well. Call me today to see this home and fall in love!
Key facts
- Barn like shop
- Newly done floors
- Fenced in back yard
Tags
Neighborhood map
What this means for you Summary
Snapshot
- This is a 3-bed/1.0-bath single-family listed at $140k.
Deal economics
- At list price, monthly cash flow is $159 ($2k/yr) — positive.
- The deal already cash-flows at list — no discount required.
- To meet the 1% rule (rent ≥ 1% of price), the offer needs to be $132k (5.8% below list).
- Recommended offer: $123k (12.0% below list) — sets the bar for market timing.
- Cap rate 7.7% vs local median 3.3% in East End — top-decile yield for the area; either an underpriced asset or a hidden risk that comps aren't pricing in. Stress-test before assuming the spread holds.
Location & tenants
- Location reads 62/100 on livability (#210 in AR) — a middle-class / working-renter tenant base. Strengths: cost of living A+, housing A+, employment B+; Watch: amenities F, commute F, health & safety F.
- Pulaski County Spec. School District (rural): math 27% / reading 31% proficiency, ranked #150 of 238 in AR (top 63%) — low school quality limits family demand, transient renter base, plan for 1-2y turnover.
- Zoned schools: Bates Elementary School (math 17% / reading 17%, grade F, #398 of 454 statewide, top 89%, 417 students, 98% FRL); Fuller Middle School (math 13% / reading 24%, grade F, #181 of 201 statewide, top 90%, 440 students, 100% FRL); Wilbur D. Mills High School (math 6% / reading 15%, grade F, #271 of 292 statewide, top 93%, 640 students, 99% FRL) — zoned schools average 99% FRL vs 48% district-wide (51 pts higher); higher-poverty schools than district average — tighter screening recommended.
- Zoned-school proficiency averages 15% at this address vs 29% district-wide (-14 pts) — the specific schools serving this property underperform the Pulaski County Spec. School District average; the district grade overstates school quality for this exact location.
- Market conditions: Rents rising (+3.4%/yr); 126 active listings in the ZIP; 1,006 units permitted in Pulaski County in 2024 (0 in 5+ unit buildings).
- This rent runs 30% of the median local income ($52k/yr) — at the standard rent-burdened threshold; future hikes will face affordability resistance.
Forward outlook
- Local home prices are declining (-3.0%/yr); year-one equity from $968 of loan paydown is wiped out by about $4k of value loss. Plan a longer hold.
- Pulaski County population projected at +6% by 2050 — modest demand growth; plan on rents tracking national, not racing it.
Negotiation context
- It's been on market 161 days — a 12% lower offer ($123k) is reasonable based on typical stale-listing flexibility.
- 2 sale attempts; this cycle's ask has dropped $20k (12%) from the opening price — seller is motivated, your offer sets the floor, not the list.
Risks & watch-outs
- Climate carrying-cost: moderate wildfire risk; extreme-heat days projected 7→19/yr by 2055 (HVAC capex compounding) — expect insurance premiums to compound above CPI over the hold.
Questions for the listing agent
- It's been on market 161 days. Have you received any prior offers? Is the seller open to a 12% concession, seller financing, or rate buy-down credit?
- Built in 1972 — when were the roof, HVAC, electrical panel, plumbing, and water heater last replaced?
- Why hasn't it sold? Are there any deal-killer items the seller is aware of (foundation, flood, title, zoning, code violations)?
- Is there a deadline driving the sale (1031 exchange, divorce, estate, relocation)? That informs how much negotiation room exists.
- Schools are F-rated, which usually means shorter tenancies and higher turnover. Who's the typical renter profile here, and what's been the actual vacancy rate?
- What's the average days-on-market for RENTAL listings here right now (not sales)? A rising rental-DOM trend means longer vacancies and softer asking-rent achievability than the comps imply.
- What's the recent tenant-quality profile in this submarket — average credit score on applications, eviction rate, late-payment / NSF rate, and stable-employment percentage? A property-management company in the area should have these aggregated.
- How much new for-sale + rental construction is in the pipeline within 1–3 miles? Heavy new supply typically softens prices + rents 12–24 months out; constrained supply supports both.
Investment metrics
- 1% rule
- 0.94% ✗
- Cap rate
- 7.66%
- Cash-on-cash
- 4.87%
- DSCR
- 1.22
- GRM
- 8.8
CMA / ARV
- ARV (median comp)
- $150,746
- List price
- $140,000
- Delta
- -7.13%
- Verdict
- FAIR
- Comps
- 5 within 1.0 mi
Projected returns pro-forma
-3.0% appreciation · 3.36% rent growth · sell at horizon
- IRR
- -8.4%
- Equity multiple
- 0.69×
- Total profit
- $-12,112
- Equity at exit
- $20,874
- IRR
- 1.5%
- Equity multiple
- 1.11×
- Total profit
- $4,343
- Equity at exit
- $12,105
Cash invested: $39,200 (down + closing). Projections, not guarantees.
Landlord ↔ Tenant lean methodology
- Overall (STATE)
- 92 Strongly Landlord-Friendly
- State Arkansas
- 92 Strongly Landlord-Friendly · R+14
- County
- — inherits STATE
- City
- — inherits STATE
ZIP-level market 72206
- Rents YoY
- 3.4%
- Active inventory
- 126
- Price-to-rent
- 8.8×
Monthly cashflow live
- Estimated rent
- $1,318 medium interval (Pro) →
- Mortgage (P&I)
- −$734
- Tax from tax record
- −$90 /mo · $1,081/yr
- Insurance
- −$58
- HOA
- −$0
- Vacancy / Maint / Mgmt
- −$277
- Net cashflow
- $159
Break-even live
Sensitivity live
| Price | -10% $238 | -5% $199 | +0% $159 | +5% $119 | +10% $80 |
|---|---|---|---|---|---|
| Rent | -10% $55 | -5% $107 | +0% $159 | +5% $211 | +10% $263 |
| Rate | -1.0pp $230 | -0.5pp $195 | base $159 | +0.5pp $123 | +1.0pp $86 |
UW: 25.0% down · 7.5% · 30yr · 1.5% tax · 5.0% vac · 8.0% maint · 8.0% mgmt
Financing live
Cash to close
- Down payment
- $35,000
- Closing costs
- $4,200
- Reserves months
- —
- Total cash needed
- —
Loan-product check · same deal, 3 products live
Conventional
25% down · 7.5% · 30yr
- Down + closing
- —
- Monthly P&I
- —
- Monthly cashflow
- —
- DSCR
- —
- Eligible?
- —
Personal DTI + credit; lowest rate.
DSCR
20% down · 8.5% · 30yr
- Down + closing
- —
- Monthly P&I
- —
- Monthly cashflow
- —
- DSCR
- —
- Eligible?
- —
No personal income docs; deal must DSCR.
Hard money
10% down · 12.0% · 12mo
- Down + closing
- —
- Monthly P&I
- —
- Monthly cashflow
- —
- DSCR
- —
- Eligible?
- —
Short-term bridge; refi at stabilization.
Listing history 21 events
-
2026-06-21days on market $140,000 Active 161 DOM
-
2026-06-18days on market $140,000 Active 158 DOM
-
2026-06-17days on market $140,000 Active 157 DOM
-
2026-06-16days on market $140,000 Active 156 DOM
-
2026-06-15days on market $140,000 Active 155 DOM
-
2026-06-14days on market $140,000 Active 153 DOM
-
2026-06-13days on market $140,000 Active 152 DOM
-
2026-06-10days on market $140,000 Active 150 DOM
-
2026-06-09days on market $140,000 Active 149 DOM
-
2026-06-08days on market $140,000 Active 148 DOM
-
2026-06-07days on market $140,000 Active 147 DOM
-
2026-06-05days on market $140,000 Active 144 DOM
-
2026-06-03days on market $140,000 Active 143 DOM
-
2026-06-02days on market $140,000 Active 142 DOM
-
2026-06-01days on market $140,000 Active 141 DOM
-
2026-05-31days on market $140,000 Active 140 DOM
-
2026-05-31days on market $140,000 Active 139 DOM
-
2026-04-03status Back on Market 370-char remark
Show marketing remark (370 chars)
CHECK OUT THIS HOME!! 3 bedroom and 1.5 bath, located near the interstate, I-530 off of Bingham Rd. This home has newly done floors in most of the areas! You can enjoy sitting outside in the fenced in back yard that comes with a barn like shop and plenty of storage. You are close to Little Rock and the Airport as well. Call me today to see this home and fall in love!
-
2026-04-01historical 370-char remark
Show marketing remark (370 chars)
CHECK OUT THIS HOME!! 3 bedroom and 1.5 bath, located near the interstate, I-530 off of Bingham Rd. This home has newly done floors in most of the areas! You can enjoy sitting outside in the fenced in back yard that comes with a barn like shop and plenty of storage. You are close to Little Rock and the Airport as well. Call me today to see this home and fall in love!
-
2026-02-15price $140,000 370-char remark
Show marketing remark (370 chars)
CHECK OUT THIS HOME!! 3 bedroom and 1.5 bath, located near the interstate, I-530 off of Bingham Rd. This home has newly done floors in most of the areas! You can enjoy sitting outside in the fenced in back yard that comes with a barn like shop and plenty of storage. You are close to Little Rock and the Airport as well. Call me today to see this home and fall in love!
-
2025-12-21$160,000 New Listing 370-char remark
Show marketing remark (370 chars)
CHECK OUT THIS HOME!! 3 bedroom and 1.5 bath, located near the interstate, I-530 off of Bingham Rd. This home has newly done floors in most of the areas! You can enjoy sitting outside in the fenced in back yard that comes with a barn like shop and plenty of storage. You are close to Little Rock and the Airport as well. Call me today to see this home and fall in love!
ⓘ Source: listings_history table (triggers on properties + properties_extension) + one-shot
backfill from property_details.listing_events for pre-trigger history.
Tax reassessment forecast AR · Resets to sale price
- Current annual tax
- $1,081 · $90/mo
- Projected year-2 tax
- $1,081 · $90/mo
- Expected delta
- $0/yr ($0/mo · 0.0%)
ⓘ Screening estimate from a state-policy table — verify with the county assessor before closing.
Climate risk First Street
- Flood 1/10 Low FEMA zone X (unshaded) · 0% chance over 30 yrs
- Wildfire 5/10 Major
- Heat 6/10 Major 7 d/yr ≥111°F today · 19 d/yr by 30 yrs out
- Wind 4/10 Moderate 12% chance of damaging wind over 30 yrs
- Air quality 2/10 Low 0 unhealthy d/yr today · 1 by 30 yrs out
Nearby sold comps map
Loading sold comps map…
Walkable amenities ~0.75 mi
Loading nearby amenities…
Taxation est. · year 1
- Rental income
- $15,822
- − Mortgage interest
- −$7,842
- − Property taxes
- −$1,081
- − Insurance
- −$700
- − Repairs & maintenance
- −$1,266
- − Management
- −$1,266
- − Depreciation
- −$4,073
- Taxable loss
- −$406
- Est. tax savings @ 24.0%
- +$97
- After-tax cash flow
- $2,005/yr
For passive investors: Depreciation is non-cash, so a rental often shows a tax loss while cash-flowing — sheltering income. Rental losses are passive: they offset passive income freely, and up to $25,000/yr can offset ordinary (W-2) income if you actively participate and your MAGI is under $100k (phasing out to $0 by $150k); unused losses carry forward. On sale, claimed depreciation is recaptured at up to 25%, and gains may owe capital-gains tax (a 1031 exchange can defer both). Figures are a year-1 estimate at your 24.0% rate — not tax advice; consult a CPA.
Schools (NCES district)
- District
- Pulaski County Spec. School District
- NCES district ID
- 0511850
- Math proficiency
- 27% ▼ -13.00%
- Reading proficiency
- 31% ▼ -10.00%
- Median HH income
- $53,218
- Composite
- 25.67/100
- National rank
- #7394
- State rank
- #150 of 238 in AR
Livability — East End
- Score
- 62/100
- State rank
- #210
- US rank
- #16307
Category grades
Schools grade is shown separately in the Schools card above.
Census & demographics
- County
- Pulaski County · 372,764 people
- Metro
- Little Rock-North Little Rock-Conway, AR
- Population (ZIP)
- 22,667
- Household income
- $52,132
- Rent vs Own
- Severe rent burden
- 623.0
Population outlook (Pulaski County) Hauer SSP2
- Today (2025)
- 415,378 people
- By 2030
- 423,720 · +2.0%
- By 2040
- 435,182 · +4.8%
- By 2050
- 440,904 · +6.1%
- By 2075
- 445,521 · +7.3%
- By 2100
- 419,173 · +0.9%
Race, ethnicity, and origin ACS 2023
- Neighborhood character
- Diverse neighborhood (Simpson 0.59)
- Race & ethnicity
- Black 48% White 43% Two or more races 6% Hispanic / Latino 5%
- Hispanic origin (detail)
- Mexican 4%
- Common ancestry
- Iranian 1% Italian 1% Lithuanian 1%
- Foreign-born
- 1% · Canada
- Languages at home
- 94% English-only · Spanish 5%
Political lean MEDSL · Pulaski
- 2024 margin
- Strong D (+22.1) · D 59.8% · R 37.7% · Other 2.5%
- 2008→2024 swing
- +10.6pp toward D · 2008: 11.6pp · 2024: 22.1pp
- All cycles
- 2024: D+22.1 2020: D+22.5 2016: D+17.9 2012: D+11.4 2008: D+11.6
Not yet ingested
- Civics
- —
Market trends
- HPI YoY
- ▼ -88.64%
- Current HPI
- 158.3601
- Rent YoY
- ▲ 3.36%
- Metro
- Little Rock-North Little Rock-Conway, AR
- State GDP YoY
- ▲ 3.80%
- F500 in state
- 10
Industry mix (Fortune 500 HQ in AR)
| Industry | F500 HQs | Revenue |
|---|---|---|
| Retail | 1 | $681B |
|
||
| Food / Agriculture | 1 | $53B |
|
||
| Retail / Energy | 1 | $22B |
|
||
| Transportation / Logistics | 1 | $12B |
|
||
| Energy | 1 | $4B |
|
||
Price history
-12.5% since first listed4 events — show timeline
- 2026-04-03 Relisted — CARMLS
- 2026-04-01 Listing Removed — CARMLS
- 2026-02-15 Price Changed $140,000 CARMLS
- 2025-12-21 Listed $160,000 CARMLS
Property tax history
+3.9%/yrLatest (2025): $1,081 · +30.9% YoY. Source: county tax records.
Cash-flow waterfall
monthlySold comps — $/sqft
last 12 mo · ≤1 miLoading sold comps…