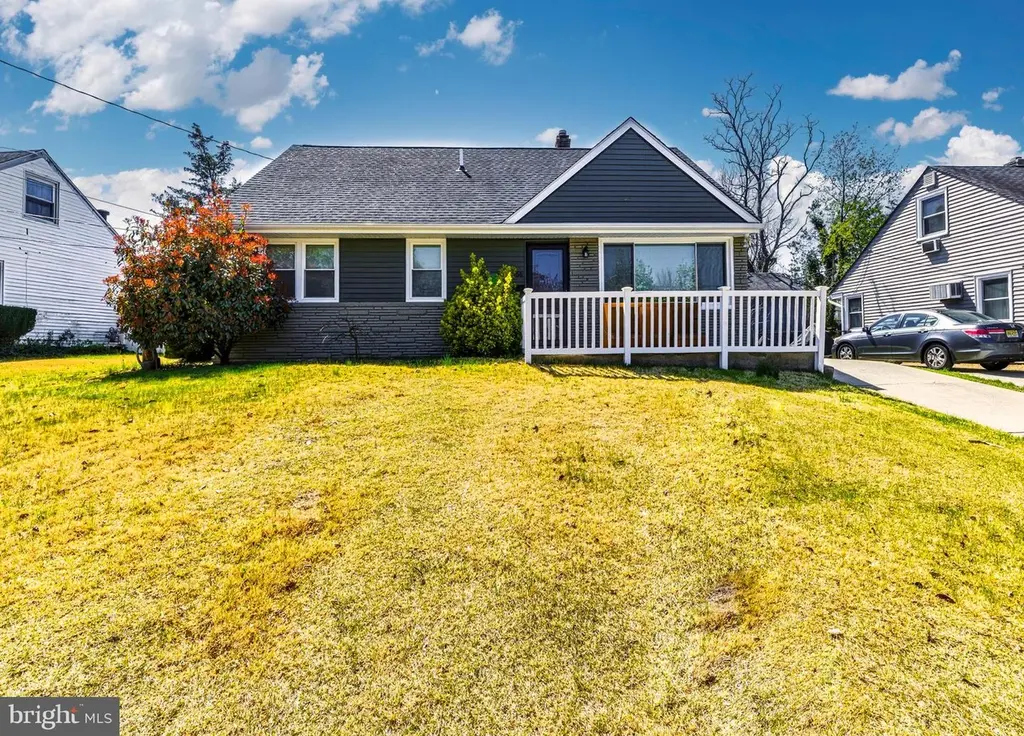
566 Muhlenberg Ave · Oak Valley, NJ
Flood risk 1/10 · Minimal
- FEMA flood zone
- X (unshaded)
- Chance of flooding over 30 yrs
- 0.0%
- Est. flood insurance / yr
- $507 – $1,088
Fire risk 3/10 · Minor
- Est. fire insurance / yr
- $526 – $976
Heat risk 7/10 · Major
- Hot days now (above 104°F)
- 7 days/yr
- Hot days in 30 yrs
- 15 days/yr
Wind risk 6/10 · Moderate
- Chance of severe wind over 30 yrs
- 52.0%
Air-quality risk 3/10 · Minor
- Unhealthy air days now
- 2 days/yr
- Unhealthy air days in 30 yrs
- 5 days/yr
Risk factors via First Street. Map © Google.
Why this score? — see what drove the D+ grade
The composite is a weighted blend of 9 inputs, each scored 0–100. Each bar is that input's sub-score; the figure is the points it added to the 100-point composite (weight × sub-score).
- ARV discount +15.0/15.0
- Cash flow +14.7/30.0
- 1% rule +4.5/10.0
- DSCR +4.5/10.0
- Livability +3.5/5.0
- Schools +2.8/10.0
- Rent growth +2.5/5.0
- Condition / age +2.5/5.0
- Appreciation +0.0/10.0
$325,000
🖨 Deal sheet (PDF) 📄 Offer letter ✓ Due diligence
Listing remarks
Welcome to 566 Muhlenberg Ave, located in the highly desirable Oak Valley neighborhood of Deptford Township. This spacious 4-bedroom, 1-bath ranch-style home offers approximately 1,800 square feet of living space and a layout that provides flexibility for today’s buyer. Step inside to find a generously sized living area filled with natural light, leading into an open dining space and functional kitchen layout—perfect for everyday living or entertaining. With four true bedrooms, this home offers options for a growing household, home office setup, or additional flex space. Major upgrades have already been taken care of for you, including a 5-year-old roof, 2-year-old HVAC system,
Key facts
- Built 1956
- Listed 10 days
Property features AI
Finance
- Other: Pets allowed with no pet restrictions; Finished above-grade area per assessor: 1,800
Exterior
- Parking: Driveway; On-street parking
- Utilities: Public water; Public sewer; 100 amp electric service; Natural gas hot water
- Home design: Detached structure; Good condition; Fee simple ownership; Architectural shingle roof
- Construction: Frame construction; Slab foundation
- Exterior features: Property in a non-federal flood zone; No basement
Interior
- Bedrooms: Two bedrooms on the main level; Two bedrooms on the upper level
- Bathrooms: One full bathroom on the main level
- Heating & cooling: 90% efficient forced air heating (natural gas); Central air conditioning (electric)
- Interior features: Attic; Drywall walls and ceilings
Neighborhood map
What this means for you Summary
Snapshot
- This is a 4-bed/1.0-bath single-family listed at $325k.
Deal economics
- At list price, monthly cash flow is $81 ($976/yr) — positive.
- The deal already cash-flows at list — no discount required.
- To meet the 1% rule (rent ≥ 1% of price), the offer needs to be $310k (4.6% below list).
- Recommended offer: $310k (4.6% below list) — sets the bar for 1% rule.
- Cap rate 6.6% vs local median 4.7% in Oak Valley — top-decile yield for the area; either an underpriced asset or a hidden risk that comps aren't pricing in. Stress-test before assuming the spread holds.
Location & tenants
- Location reads 69/100 on livability (#276 in NJ) — a middle-class / working-renter tenant base. Strengths: employment A+, housing A+, crime B+; Watch: amenities F, commute F.
- Deptford Township Public School District (suburban): math 17% / reading 45% proficiency, ranked #326 of 472 in NJ (top 69%) — families likely to look elsewhere, expect single-tenant / working-renter base with shorter leases.
- Zoned schools: Deptford Township Middle School (math 26% / reading 53%, grade F, #201 of 431 statewide, top 48%, 928 students, 31% FRL); Deptford Township High School (math 14% / reading 46%, grade F, #284 of 399 statewide, top 72%, 1,084 students, 29% FRL) — zoned schools at 30% FRL track the district average.
- Market conditions: 37 active listings in the ZIP; 1 comparable units currently listed for rent nearby; 1,047 units permitted in Gloucester County in 2024 (183 in 5+ unit buildings).
Forward outlook
- Local home prices are declining (-3.0%/yr); year-one equity from $2k of loan paydown is wiped out by about $10k of value loss. Plan a longer hold.
- Gloucester County population projected to shrink 5% by 2050 — rents likely to lag national; underwrite the cash flow, not the appreciation.
Negotiation context
- Only 10 days on market — expect competitive offers; lowballing is unlikely to land.
- 4 sale attempts since 23y ago with the ask held roughly flat each time — persistent listings suggest the price (not the market) is what's stuck; bring a comps-based counter.
- Current owner paid $90k; list at $325k implies a 261% gain — meaningful room to come down on a strong offer.
Risks & watch-outs
- Watch-outs: built in 1956 — expect roof / HVAC / electrical / plumbing capex.
- Climate carrying-cost: major wind risk, 52% chance of damaging wind over 30y; extreme-heat days projected 7→15/yr by 2055 (HVAC capex compounding) — expect insurance premiums to compound above CPI over the hold.
Questions for the listing agent
- Built in 1956 — when were the roof, HVAC, electrical panel, plumbing, and water heater last replaced?
- Is there a deadline driving the sale (1031 exchange, divorce, estate, relocation)? That informs how much negotiation room exists.
- The area grade is low — what's the realistic commute time and amenity access for the typical tenant pool here? Any planned neighborhood developments (good or bad) we should know about?
- What's the average days-on-market for RENTAL listings here right now (not sales)? A rising rental-DOM trend means longer vacancies and softer asking-rent achievability than the comps imply.
- What's the recent tenant-quality profile in this submarket — average credit score on applications, eviction rate, late-payment / NSF rate, and stable-employment percentage? A property-management company in the area should have these aggregated.
- How much new for-sale + rental construction is in the pipeline within 1–3 miles? Heavy new supply typically softens prices + rents 12–24 months out; constrained supply supports both.
Investment metrics
- 1% rule
- 0.95% ✗
- Cap rate
- 6.59%
- Cash-on-cash
- 1.07%
- DSCR
- 1.05
- GRM
- 8.7
CMA / ARV
- ARV (on-the-fly)
- $408,600
- Comps found
- 12
Show comp detail 12 sales within ~0.75 mi
| Address | Dist | Beds/Ba | Sqft | Sold | Price | $/sf | Match |
|---|---|---|---|---|---|---|---|
| 566 Muhlenberg Ave | 0.00mi | 4/1.0 | 1,800 (0%) | 0mo | $335,000 | $186 | 100 |
| 250 Amherst Ave | 0.39mi | 4/2.0 | 1,836 (+2%) | 2mo | $401,000 | $218 | 73 |
| 637 Muhlenberg Ave | 0.26mi | 4/1.0 | 1,560 (-13%) | 1mo | $355,000 | $228 | 65 |
| 515 N Clinton Ave | 0.41mi | 3/1.5 (-1) | 1,711 (-5%) | 1mo | $369,900 | $216 | 65 |
| 428 Temple Ct | 0.61mi | 4/1.5 | 1,915 (+6%) | 0mo | $430,000 | $225 | 59 |
| 500 University Blvd | 0.33mi | 3/1.5 (-1) | 1,571 (-13%) | 1mo | $415,000 | $264 | 56 |
| 711 Howard Ave | 0.45mi | 3/— (-1) | 1,600 (-11%) | 1mo | $489,500 | $306 | 55 |
| 432 Grove Ct | 0.48mi | 3/3.0 (-1) | 1,920 (+7%) | 1mo | $435,000 | $227 | 53 |
| 721 Dartmouth Dr | 0.70mi | 3/1.5 (-1) | 1,680 (-7%) | 1mo | $380,000 | $226 | 48 |
| 452 College Blvd | 0.53mi | 3/1.5 (-1) | 1,582 (-12%) | 2mo | $359,900 | $227 | 47 |
| 418 Westminster Rd | 0.57mi | 5/1.0 (+1) | 1,560 (-13%) | 1mo | $300,000 | $192 | 46 |
| 783 4th St | 0.70mi | 3/1.5 (-1) | 1,534 (-15%) | 2mo | $375,000 | $244 | 34 |
Match score weights: distance 35% · size 25% · config 20% · recency 20%. Top-matched comps best support the ARV.
Projected returns pro-forma
-3.0% appreciation · 3.0% rent growth · sell at horizon
- IRR
- -14.5%
- Equity multiple
- 0.48×
- Total profit
- $-47,364
- Equity at exit
- $48,459
- IRR
- -5.8%
- Equity multiple
- 0.63×
- Total profit
- $-34,081
- Equity at exit
- $28,100
Cash invested: $91,000 (down + closing). Projections, not guarantees.
Landlord ↔ Tenant lean methodology
- Overall (STATE)
- 21 Tenant-Leaning
- State New Jersey
- 21 Tenant-Leaning · D+6
- County
- — inherits STATE
- City
- — inherits STATE
ZIP-level market 08090
- Home prices YoY
- -25.1%
- Active inventory
- 37
- Price-to-rent
- 8.7×
Monthly cashflow live
- Estimated rent
- $3,100 medium interval (Pro) →
- Mortgage (P&I)
- −$1,704
- Tax from tax record
- −$528 /mo · $6,335/yr
- Insurance
- −$135
- HOA
- −$0
- Vacancy / Maint / Mgmt
- −$651
- Net cashflow
- $81
Break-even live
Sensitivity live
| Price | -10% $265 | -5% $173 | +0% $81 | +5% $-11 | +10% $-103 |
|---|---|---|---|---|---|
| Rent | -10% $-164 | -5% $-41 | +0% $81 | +5% $204 | +10% $326 |
| Rate | -1.0pp $245 | -0.5pp $164 | base $81 | +0.5pp $-3 | +1.0pp $-89 |
UW: 25.0% down · 7.5% · 30yr · 1.5% tax · 5.0% vac · 8.0% maint · 8.0% mgmt
Financing live
Cash to close
- Down payment
- $81,250
- Closing costs
- $9,750
- Reserves months
- —
- Total cash needed
- —
Loan-product check · same deal, 3 products live
Conventional
25% down · 7.5% · 30yr
- Down + closing
- —
- Monthly P&I
- —
- Monthly cashflow
- —
- DSCR
- —
- Eligible?
- —
Personal DTI + credit; lowest rate.
DSCR
20% down · 8.5% · 30yr
- Down + closing
- —
- Monthly P&I
- —
- Monthly cashflow
- —
- DSCR
- —
- Eligible?
- —
No personal income docs; deal must DSCR.
Hard money
10% down · 12.0% · 12mo
- Down + closing
- —
- Monthly P&I
- —
- Monthly cashflow
- —
- DSCR
- —
- Eligible?
- —
Short-term bridge; refi at stabilization.
Rent comps 1 comps
| Address | Beds | Baths | Sqft | Rent | $/sqft | DOM | Units | Dist |
|---|---|---|---|---|---|---|---|---|
| 114 Ogden Station Rd Wenonah, NJ | 4.0 | 2.0 | 1617 | $3,100 | $1.92 | 0d | 1 | 0.72mi |
Listing history 15 events
-
2026-06-04status $325,000 Pending 10 DOM
-
2026-04-20historical Active Under Contract
-
2026-04-11$325,000 Active
-
2026-04-01historical $325,000
-
2019-05-17historical
-
2019-04-08$198,900 Active
-
2006-01-29historical
-
2005-10-24$235,000
-
2003-11-20historical
-
2003-08-20$164,700
-
2000-08-01soldstatus $90,000
-
1992-07-29soldstatus $82,500
-
1986-07-30soldstatus $58,000
-
1981-06-01soldstatus $43,500
-
1978-10-01soldstatus $12,000
ⓘ Source: listings_history table (triggers on properties + properties_extension) + one-shot
backfill from property_details.listing_events for pre-trigger history.
Tax reassessment forecast NJ · Partial reset (capped growth)
- Current annual tax
- $6,335 · $528/mo
- Projected year-2 tax
- $7,214 · $601/mo
- Expected delta
- +$879/yr (+$73/mo · 13.9%)
ⓘ Screening estimate from a state-policy table — verify with the county assessor before closing.
Climate risk First Street
- Flood 1/10 Low FEMA zone X (unshaded) · 0% chance over 30 yrs
- Wildfire 3/10 Moderate
- Heat 7/10 Severe 7 d/yr ≥104°F today · 15 d/yr by 30 yrs out
- Wind 6/10 Major 52% chance of damaging wind over 30 yrs
- Air quality 3/10 Moderate 2 unhealthy d/yr today · 5 by 30 yrs out
Nearby sold comps map
Loading sold comps map…
Walkable amenities ~0.75 mi
Loading nearby amenities…
Taxation est. · year 1
- Rental income
- $37,200
- − Mortgage interest
- −$18,205
- − Property taxes
- −$6,335
- − Insurance
- −$1,625
- − Repairs & maintenance
- −$2,976
- − Management
- −$2,976
- − Depreciation
- −$9,455
- Taxable loss
- −$4,372
- Est. tax savings @ 24.0%
- +$1,049
- After-tax cash flow
- $2,025/yr
For passive investors: Depreciation is non-cash, so a rental often shows a tax loss while cash-flowing — sheltering income. Rental losses are passive: they offset passive income freely, and up to $25,000/yr can offset ordinary (W-2) income if you actively participate and your MAGI is under $100k (phasing out to $0 by $150k); unused losses carry forward. On sale, claimed depreciation is recaptured at up to 25%, and gains may owe capital-gains tax (a 1031 exchange can defer both). Figures are a year-1 estimate at your 24.0% rate — not tax advice; consult a CPA.
Schools (NCES district)
- District
- Deptford Township Public School District
- NCES district ID
- 3403900
- Math proficiency
- 17% ▼ -24.00%
- Reading proficiency
- 45% ▼ -5.00%
- Median HH income
- $66,302
- Composite
- 28.48/100
- National rank
- #6741
- State rank
- #326 of 472 in NJ
Livability — Oak Valley
- Score
- 69/100
- State rank
- #276
- US rank
- #8262
Category grades
Schools grade is shown separately in the Schools card above.
Census & demographics
- Census place
- Oak Valley, NJ
- Population (ZIP)
- 9,574
Population outlook (Gloucester County) Hauer SSP2
- Today (2025)
- 298,895 people
- By 2030
- 299,031 · +0.0%
- By 2040
- 294,020 · -1.6%
- By 2050
- 284,188 · -4.9%
- By 2075
- 260,720 · -12.8%
- By 2100
- 229,565 · -23.2%
Race, ethnicity, and origin ACS 2023
- Neighborhood character
- Predominantly White (79%)
- Race & ethnicity
- White 79% Black 13% Two or more races 4% Hispanic / Latino 3% Asian 1% Pacific Islander 1%
- Common ancestry
- Romanian 4% Scottish 1% Slovak 1%
- Foreign-born
- 3% · Canada
- Languages at home
- 95% English-only · Spanish 2% Other Indo-European 1%
Political lean MEDSL · Gloucester
- 2024 margin
- Toss-up / Even · D 47.8% · R 50.6% · Other 1.6%
- 2008→2024 swing
- -15.0pp toward R · 2008: 12.2pp · 2024: -2.8pp
- All cycles
- 2024: R+2.8 2020: D+1.9 2016: R+0.4 2012: D+10.5 2008: D+12.2
Not yet ingested
- Civics
- —
Market trends
- HPI YoY
- ▼ -103.64%
- Current HPI
- 308.8974
- Rent YoY
- —
- Metro
- —
- State GDP YoY
- ▲ 2.05%
- F500 in state
- 34
Industry mix (Fortune 500 HQ in NJ)
| Industry | F500 HQs | Revenue |
|---|---|---|
| Consumer Goods | 3 | $31B |
|
||
| Pharmaceuticals | 2 | $153B |
|
||
| Technology | 2 | $21B |
|
||
| Insurance | 2 | $20B |
|
||
| Healthcare | 2 | $19B |
|
||
| Financial Services | 1 | $70B |
|
||
Price history
+2608.3% since first listed14 events — show timeline
- 2026-04-20 Contingent — BRIGHT MLS
- 2026-04-11 Listed $325,000 BRIGHT MLS
- 2026-04-01 Coming Soon $325,000 BRIGHT MLS
- 2019-05-17 Listing Removed — BRIGHT MLS
- 2019-04-08 Listed $198,900 BRIGHT MLS
- 2006-01-29 Listing Removed — BRIGHT MLS
- 2005-10-24 Listed $235,000 BRIGHT MLS
- 2003-11-20 Listing Removed — BRIGHT MLS
- 2003-08-20 Listed $164,700 BRIGHT MLS
- 2000-08-01 Sold (Public Records) $90,000 Public Records
- 1992-07-29 Sold (Public Records) $82,500 Public Records
- 1986-07-30 Sold (Public Records) $58,000 Public Records
- 1981-06-01 Sold (Public Records) $43,500 Public Records
- 1978-10-01 Sold (Public Records) $12,000 Public Records
Property tax history
+3.1%/yrLatest (2025): $6,335 · +2.1% YoY. Source: county tax records.
Cash-flow waterfall
monthlySold comps — $/sqft
last 12 mo · ≤1 miLoading sold comps…