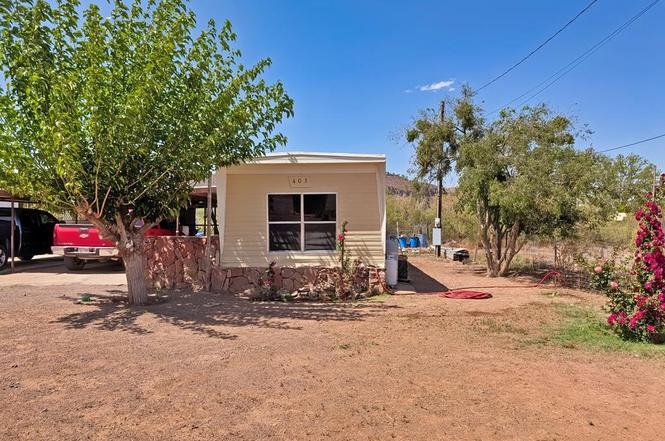
403 Commerce St · Fort Davis, TX
Flood risk 1/10 · Minimal
- FEMA flood zone
- —
- Chance of flooding over 30 yrs
- 0.0%
- Est. flood insurance / yr
- —
Fire risk 10/10 · Severe
- Est. fire insurance / yr
- $1,222 – $2,270
Heat risk 4/10 · Minor
- Hot days now (above 95°F)
- 7 days/yr
- Hot days in 30 yrs
- 20 days/yr
Wind risk 1/10 · Minimal
- Chance of severe wind over 30 yrs
- —
Air-quality risk 2/10 · Minimal
- Unhealthy air days now
- 1 days/yr
- Unhealthy air days in 30 yrs
- 1 days/yr
Risk factors via First Street. Map © Google.
Why this score? — see what drove the B grade
The composite is a weighted blend of 9 inputs, each scored 0–100. Each bar is that input's sub-score; the figure is the points it added to the 100-point composite (weight × sub-score).
- Cash flow +30.0/30.0
- DSCR +10.0/10.0
- 1% rule +7.5/10.0
- ARV discount +7.5/15.0
- Appreciation +6.0/10.0
- Schools +3.1/10.0
- Livability +2.9/5.0
- Rent growth +2.5/5.0
- Condition / age +2.5/5.0
$65,000
🖨 Deal sheet 📄 Offer letter ✓ Due diligence
Listing remarks
Cute single-wide mobile home on lovely fenced lot close to the Fort Davis National Historic Site! Two bedrooms and one bath home with three mini-splits for cooling and heating, range and refrigerator convey. Covered parking for three vehicles. Enjoy unimproved lot privacy from the two lots in back and on one side. Views of Scobee and Sleeping Lion Mountain. Easy access to everything in town!
Key facts
- Mini-splits
- Covered parking
- Fenced lot
Tags
Property features AI
Exterior
- Parking: 3 total parking spaces (3 covered); Carport
- Utilities: Public water; Public sewer; Propane service
- Home design: Single wide mobile home; Residential single family residence
- Construction: Metal roof; Pillar/post/pier foundation; Built as single wide
- Exterior features: Chain link fence; Solar panels
Interior
- Kitchen: Gas range; Refrigerator
- Bathrooms: 1 full bathroom
- Heating & cooling: Zoned electric heating; Zoned electric cooling
- Interior features: Breakfast bar
- Laundry & utility: Washer hookup; Dryer; Tankless water heater
Neighborhood map
What this means for you Summary
Snapshot
- This is a 2-bed/1.0-bath manufactured listed at $65k.
Deal economics
- At list price, monthly cash flow is $248 ($3k/yr) — positive.
- The deal already cash-flows at list — no discount required.
- Meets the 1% rule at list price ($810 rent vs $65k).
- Recommended offer: $57k (12.0% below list) — sets the bar for market timing.
Location & tenants
- Location reads 57/100 on livability (#1,258 in TX) — a working-class tenant base; expect higher turnover. Strengths: cost of living A+, housing A+, crime A; Watch: schools F, amenities F, commute F.
- Ft Davis ISD (rural): math 30% / reading 35% proficiency, ranked #942 of 1,141 in TX (top 83%) — families likely to look elsewhere, expect single-tenant / working-renter base with shorter leases.
- Market conditions: 74 active listings in the ZIP.
Forward outlook
- In year one you build about $2k of equity ($449 loan paydown + $1k appreciation (2.0% local appreciation)).
- Jeff Davis County population projected at -28% by 2050 — secular population decline; favor cash flow + early exit over multi-decade hold.
- At projected returns (2.0% appreciation + 3.0% rent growth), your $18k cash investment doubles in ~4 years — after that, you're playing with house money.
Negotiation context
- It's been on market 123 days — a 12% lower offer ($57k) is reasonable based on typical stale-listing flexibility.
- 2 sale attempts with the ask held roughly flat each time — persistent listings suggest the price (not the market) is what's stuck; bring a comps-based counter.
Risks & watch-outs
- Climate carrying-cost: severe wildfire risk — expect insurance premiums to compound above CPI over the hold.
Questions for the listing agent
- It's been on market 123 days. Have you received any prior offers? Is the seller open to a 12% concession, seller financing, or rate buy-down credit?
- Built in 1975 — when were the roof, HVAC, electrical panel, plumbing, and water heater last replaced?
- Why hasn't it sold? Are there any deal-killer items the seller is aware of (foundation, flood, title, zoning, code violations)?
- Is there a deadline driving the sale (1031 exchange, divorce, estate, relocation)? That informs how much negotiation room exists.
- Schools are F-rated, which usually means shorter tenancies and higher turnover. Who's the typical renter profile here, and what's been the actual vacancy rate?
- What's the average days-on-market for RENTAL listings here right now (not sales)? A rising rental-DOM trend means longer vacancies and softer asking-rent achievability than the comps imply.
- What's the recent tenant-quality profile in this submarket — average credit score on applications, eviction rate, late-payment / NSF rate, and stable-employment percentage? A property-management company in the area should have these aggregated.
- How much new for-sale + rental construction is in the pipeline within 1–3 miles? Heavy new supply typically softens prices + rents 12–24 months out; constrained supply supports both.
Investment metrics
- 1% rule
- 1.25% ✓
- Cap rate
- 10.88%
- Cash-on-cash
- 16.38%
- DSCR
- 1.73
- GRM
- 6.7
CMA / ARV
No comps found within radius.
Projected returns pro-forma
2.0% appreciation · 3.0% rent growth · sell at horizon
- IRR
- 20.6%
- Equity multiple
- 2.11×
- Total profit
- $20,257
- Equity at exit
- $25,643
- IRR
- 22.7%
- Equity multiple
- 3.98×
- Total profit
- $54,290
- Equity at exit
- $36,930
Cash invested: $18,200 (down + closing). Projections, not guarantees.
Landlord ↔ Tenant lean methodology
- Overall (STATE)
- 87 Strongly Landlord-Friendly
- State Texas
- 87 Strongly Landlord-Friendly · R+5
- County
- — inherits STATE
- City
- — inherits STATE
ZIP-level market 79734
- Home prices YoY
- 1.9%
- Active inventory
- 74
- Price-to-rent
- 6.7×
Monthly cashflow live
- Estimated rent
- $810 medium interval (Pro) →
- Mortgage (P&I)
- −$341
- Tax from tax record
- −$23 /mo · $279/yr
- Insurance
- −$27
- HOA
- −$0
- Vacancy / Maint / Mgmt
- −$170
- Net cashflow
- $248
Break-even live
UW: 25.0% down · 7.5% · 30yr · 1.5% tax · 5.0% vac · 8.0% maint · 8.0% mgmt
Financing live
Cash to close
- Down payment
- $16,250
- Closing costs
- $1,950
- Reserves months
- —
- Total cash needed
- —
Loan-product check · same deal, 3 products live
Conventional
25% down · 7.5% · 30yr
- Down + closing
- —
- Monthly P&I
- —
- Monthly cashflow
- —
- DSCR
- —
- Eligible?
- —
Personal DTI + credit; lowest rate.
DSCR
20% down · 8.5% · 30yr
- Down + closing
- —
- Monthly P&I
- —
- Monthly cashflow
- —
- DSCR
- —
- Eligible?
- —
No personal income docs; deal must DSCR.
Hard money
10% down · 12.0% · 12mo
- Down + closing
- —
- Monthly P&I
- —
- Monthly cashflow
- —
- DSCR
- —
- Eligible?
- —
Short-term bridge; refi at stabilization.
Listing history 21 events
-
2026-06-18days on market $65,000 Active 123 DOM
-
2026-06-17days on market $65,000 Active 122 DOM
-
2026-06-16days on market $65,000 Active 121 DOM
-
2026-06-15days on market $65,000 Active 120 DOM
-
2026-06-14days on market $65,000 Active 118 DOM
-
2026-06-10days on market $65,000 Active 115 DOM
-
2026-06-09days on market $65,000 Active 114 DOM
-
2026-06-08days on market $65,000 Active 113 DOM
-
2026-06-07days on market $65,000 Active 112 DOM
-
2026-06-05days on market $65,000 Active 109 DOM
-
2026-06-03days on market $65,000 Active 108 DOM
-
2026-06-02days on market $65,000 Active 107 DOM
-
2026-06-01days on market $65,000 Active 106 DOM
-
2026-05-31days on market $65,000 Active 105 DOM
-
2026-05-31days on market $65,000 Active 104 DOM
-
2026-04-23status Active
-
2026-03-19historical
-
2026-01-11$65,000 Active
-
2025-08-05price $65,000
-
2025-06-16price $75,000
-
1994-07-11soldstatus
ⓘ Source: listings_history table (triggers on properties + properties_extension) + one-shot
backfill from property_details.listing_events for pre-trigger history.
Tax reassessment forecast TX · Resets to sale price
- Current annual tax
- $279 · $23/mo
- Projected year-2 tax
- $1,190 · $99/mo
- Expected delta
- +$911/yr (+$76/mo · 326.6%)
ⓘ Screening estimate from a state-policy table — verify with the county assessor before closing.
Climate risk First Street
- Flood 1/10 Low 0% chance over 30 yrs
- Wildfire 10/10 Extreme
- Heat 4/10 Moderate 7 d/yr ≥95°F today · 20 d/yr by 30 yrs out
- Wind 1/10 Low
- Air quality 2/10 Low 1 unhealthy d/yr today · 1 by 30 yrs out
Nearby sold comps map
Loading sold comps map…
Walkable amenities ~0.75 mi
Loading nearby amenities…
Taxation est. · year 1
- Rental income
- $9,715
- − Mortgage interest
- −$3,641
- − Property taxes
- −$279
- − Insurance
- −$325
- − Repairs & maintenance
- −$777
- − Management
- −$777
- − Depreciation
- −$1,891
- Taxable income
- $2,025
- Est. tax owed @ 24.0%
- −$486
- After-tax cash flow
- $2,495/yr
For passive investors: Depreciation is non-cash, so a rental often shows a tax loss while cash-flowing — sheltering income. Rental losses are passive: they offset passive income freely, and up to $25,000/yr can offset ordinary (W-2) income if you actively participate and your MAGI is under $100k (phasing out to $0 by $150k); unused losses carry forward. On sale, claimed depreciation is recaptured at up to 25%, and gains may owe capital-gains tax (a 1031 exchange can defer both). Figures are a year-1 estimate at your 24.0% rate — not tax advice; consult a CPA.
Schools (NCES district)
- District
- Ft Davis ISD
- NCES district ID
- 4820100
- Math proficiency
- 30% ▬ 0.00%
- Reading proficiency
- 35% ▬ 0.00%
- Median HH income
- $48,341
- Composite
- 30.84/100
- National rank
- #11376
- State rank
- #942 of 1141 in TX
Livability — Fort Davis
- Score
- 57/100
- State rank
- #1258
- US rank
- #21905
Category grades
Schools grade is shown separately in the Schools card above.
Census & demographics
- Census place
- Fort Davis, TX
- Population (ZIP)
- 1,616
Population outlook (Jeff Davis County) Hauer SSP2
- Today (2025)
- 2,052 people
- By 2030
- 1,942 · -5.4%
- By 2040
- 1,710 · -16.7%
- By 2050
- 1,478 · -28.0%
- By 2075
- 957 · -53.4%
- By 2100
- 727 · -64.6%
Race, ethnicity, and origin ACS 2023
- Neighborhood character
- Predominantly White (70%)
- Race & ethnicity
- White 70% Hispanic / Latino 27% Two or more races 24%
- Hispanic origin (detail)
- Mexican 27%
- Common ancestry
- Portuguese 3% Serbian 2% Lithuanian 1%
- Foreign-born
- 14% · Canada
- Languages at home
- 75% English-only · Spanish 22% German/W. Germanic 1% Russian/Polish/Slavic 1%
Political lean MEDSL · Jeff Davis
- 2024 margin
- Strong R (+21.3) · D 38.5% · R 59.8% · Other 1.7%
- 2008→2024 swing
- +1.4pp toward D · 2008: -22.7pp · 2024: -21.3pp
- All cycles
- 2024: R+21.3 2020: R+21.7 2016: R+23.1 2012: R+23.3 2008: R+22.7
Not yet ingested
- Civics
- —
Market trends
- HPI YoY
- ▲ 2.00%
- Current HPI
- 105.8311
- Rent YoY
- —
- Metro
- —
- State GDP YoY
- ▲ 3.95%
- F500 in state
- 110
Industry mix (Fortune 500 HQ in TX)
| Industry | F500 HQs | Revenue |
|---|---|---|
| Energy | 16 | $1,198B |
|
||
| Technology | 5 | $198B |
|
||
| Engineering / Construction | 4 | $72B |
|
||
| Energy Services | 3 | $60B |
|
||
| Utilities | 3 | $41B |
|
||
| Healthcare | 2 | $330B |
|
||
Price history
-13.3% since first listed6 events — show timeline
- 2026-04-23 Relisted — ODMLS
- 2026-03-19 Delisted — ODMLS
- 2026-01-11 Listed $65,000 ODMLS
- 2025-08-05 Price Changed $65,000 ODMLS
- 2025-06-16 Price Changed $75,000 ODMLS
- 1994-07-11 Sold (Public Records) — Public Records
Property tax history
+10.1%/yrLatest (2025): $279 · +9.1% YoY. Source: county tax records.
Cash-flow waterfall
monthlySold comps — $/sqft
last 12 mo · ≤1 miLoading sold comps…