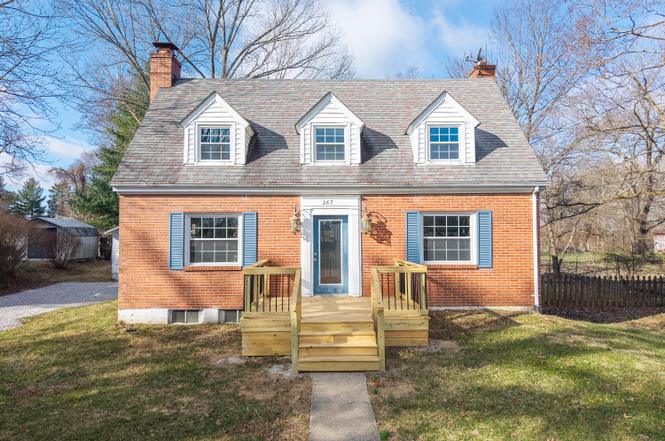
267 Stanford St · Science Hill, KY
Flood risk 1/10 · Minimal
- FEMA flood zone
- X (unshaded)
- Chance of flooding over 30 yrs
- 0.0%
- Est. flood insurance / yr
- $507 – $1,088
Fire risk 4/10 · Minor
- Est. fire insurance / yr
- $839 – $1,559
Heat risk 4/10 · Minor
- Hot days now (above 102°F)
- 7 days/yr
- Hot days in 30 yrs
- 20 days/yr
Wind risk 3/10 · Minor
- Chance of severe wind over 30 yrs
- 6.0%
Air-quality risk 1/10 · Minimal
- Unhealthy air days now
- 0 days/yr
- Unhealthy air days in 30 yrs
- 0 days/yr
Risk factors via First Street. Map © Google.
Why this score? — see what drove the D- grade
The composite is a weighted blend of 9 inputs, each scored 0–100. Each bar is that input's sub-score; the figure is the points it added to the 100-point composite (weight × sub-score).
- Cash flow +9.8/30.0
- Appreciation +7.6/10.0
- ARV discount +5.4/15.0
- Schools +4.2/10.0
- Livability +3.2/5.0
- DSCR +2.8/10.0
- Rent growth +2.5/5.0
- Condition / age +2.5/5.0
- 1% rule +1.7/10.0
$164,900
🖨 Deal sheet (PDF) 📄 Offer letter ✓ Due diligence
Listing remarks
Nestled in the heart of Science Hill, this charming brick home blends timeless character with inviting warmth, all set on a large, scenic lot complete with a detached garage and barn, ideal for storage and/or hobbies. The classic brick exterior immediately captures attention with its symmetrical façade, steeply pitched roofline, and charming dormer windows that add storybook appeal. Crisp trim, traditional shutters, and a welcoming front entry enhance the home's curb appeal, while the spacious yard provides a peaceful rural feel with plenty of room to enjoy the outdoors. The long driveway and generous lot size offer privacy and flexibility rarely found in this location. Inside, the h
Key facts
- Barn for storage
- Brick home
- Large scenic lot
Tags
Neighborhood map
What this means for you Summary
Snapshot
- This is a 3-bed/1.5-bath single-family listed at $165k.
Deal economics
- At list price, monthly cash flow is $-105 ($-1k/yr) — negative.
- To cash-flow at today's rent, offer at most $146k (11.2% below list).
- To meet the 1% rule (rent ≥ 1% of price), the offer needs to be $111k (32.9% below list).
- Recommended offer: $111k (32.9% below list) — sets the bar for 1% rule.
- Cap rate 5.5% vs local median 3.5% in Science Hill — top-decile yield for the area; either an underpriced asset or a hidden risk that comps aren't pricing in. Stress-test before assuming the spread holds.
Location & tenants
- Location reads 64/100 on livability (#300 in KY) — a middle-class / working-renter tenant base. Strengths: crime A+, cost of living A+, housing A; Watch: amenities F, commute F, employment F.
- Science Hill Independent (town): math 44% / reading 55% proficiency, ranked #11 of 165 in KY (top 7%) — families likely to look elsewhere, expect single-tenant / working-renter base with shorter leases.
- Zoned schools: Science Hill Elementary School (math 44% / reading 55%, grade D, #100 of 676 statewide, top 16%, 476 students, 61% FRL) — zoned schools average 61% FRL vs 40% district-wide (20 pts higher); higher-poverty schools than district average — tighter screening recommended.
- Market conditions: 31 active listings in the ZIP; 117 units permitted in Pulaski County in 2024 (50 in 5+ unit buildings).
Forward outlook
- In year one you build about $10k of equity ($1k loan paydown + $9k appreciation (5.2% local appreciation)).
- By year 4, paydown + projected appreciation supports a ~$33k cash-out refi (75% LTV) — recoverable capital for the next deal without selling this one.
Negotiation context
- It's been on market 111 days — a 9% lower offer ($150k) is reasonable based on typical stale-listing flexibility.
- 3 sale attempts since 8y ago; this cycle's ask has dropped $24k (13%) from the opening price — seller is motivated, your offer sets the floor, not the list.
- Current owner paid $99k; list at $165k implies a 67% gain — meaningful room to come down on a strong offer.
Questions for the listing agent
- What do current leases actually rent for vs. the listed asking? Can we see a recent rent roll and the last 12 months of T-12 income?
- It's been on market 111 days. Have you received any prior offers? Is the seller open to a 33% concession, seller financing, or rate buy-down credit?
- Built in 1970 — when were the roof, HVAC, electrical panel, plumbing, and water heater last replaced?
- Why hasn't it sold? Are there any deal-killer items the seller is aware of (foundation, flood, title, zoning, code violations)?
- Is there a deadline driving the sale (1031 exchange, divorce, estate, relocation)? That informs how much negotiation room exists.
- The area grade is low — what's the realistic commute time and amenity access for the typical tenant pool here? Any planned neighborhood developments (good or bad) we should know about?
- What's the average days-on-market for RENTAL listings here right now (not sales)? A rising rental-DOM trend means longer vacancies and softer asking-rent achievability than the comps imply.
- What's the recent tenant-quality profile in this submarket — average credit score on applications, eviction rate, late-payment / NSF rate, and stable-employment percentage? A property-management company in the area should have these aggregated.
- How much new for-sale + rental construction is in the pipeline within 1–3 miles? Heavy new supply typically softens prices + rents 12–24 months out; constrained supply supports both.
Investment metrics
- 1% rule
- 0.67% ✗
- Cap rate
- 5.53%
- Cash-on-cash
- -2.73%
- DSCR
- 0.88
- GRM
- 12.4
CMA / ARV
- ARV (on-the-fly)
- $157,528
- Comps found
- 7
Show comp detail 7 sales within ~0.75 mi
| Address | Dist | Beds/Ba | Sqft | Sold | Price | $/sf | Match |
|---|---|---|---|---|---|---|---|
| 267 Stanford St | 0.00mi | 3/1.0 | 1,416 (+4%) | 1mo | $162,500 | $115 | 90 |
| 80 Cary Ln | 0.36mi | 3/2.0 | 1,410 (+4%) | 13mo | $245,000 | $174 | 64 |
| 202 Stanford St | 0.18mi | 3/2.0 | 1,197 (-12%) | 10mo | $110,000 | $92 | 62 |
| 226 Ebright St | 0.47mi | 3/1.0 | 1,365 (+0%) | 22mo | $137,000 | $100 | 57 |
| 117 Park Ln | 0.37mi | 3/2.0 | 1,450 (+7%) | 16mo | $250,000 | $172 | 56 |
| 7784 N Hwy 1247 | 0.39mi | 3/2.0 | 1,542 (+14%) | 17mo | $269,900 | $175 | 43 |
| 719 Stanford St | 0.42mi | 2/1.0 (-1) | 1,192 (-12%) | 24mo | $138,000 | $116 | 33 |
Match score weights: distance 35% · size 25% · config 20% · recency 20%. Top-matched comps best support the ARV.
Projected returns pro-forma
5.22% appreciation · 3.0% rent growth · sell at horizon
- IRR
- 11.1%
- Equity multiple
- 1.72×
- Total profit
- $33,297
- Equity at exit
- $95,639
- IRR
- 12.3%
- Equity multiple
- 3.28×
- Total profit
- $105,376
- Equity at exit
- $166,901
Cash invested: $46,172 (down + closing). Projections, not guarantees.
Landlord ↔ Tenant lean methodology
- Overall (STATE)
- 83 Strongly Landlord-Friendly
- State Kentucky
- 83 Strongly Landlord-Friendly · R+16
- County
- — inherits STATE
- City
- — inherits STATE
ZIP-level market 42553
- Home prices YoY
- 1.7%
- Active inventory
- 31
- Price-to-rent
- 12.4×
Monthly cashflow live
- Estimated rent
- $1,106 medium interval (Pro) →
- Mortgage (P&I)
- −$865
- Tax from tax record
- −$45 /mo · $542/yr
- Insurance
- −$69
- HOA
- −$0
- Vacancy / Maint / Mgmt
- −$232
- Net cashflow
- $-105
Break-even live
Sensitivity live
| Price | -10% $-12 | -5% $-58 | +0% $-105 | +5% $-152 | +10% $-198 |
|---|---|---|---|---|---|
| Rent | -10% $-192 | -5% $-149 | +0% $-105 | +5% $-61 | +10% $-18 |
| Rate | -1.0pp $-22 | -0.5pp $-63 | base $-105 | +0.5pp $-148 | +1.0pp $-191 |
UW: 25.0% down · 7.5% · 30yr · 1.5% tax · 5.0% vac · 8.0% maint · 8.0% mgmt
Financing live
Cash to close
- Down payment
- $41,225
- Closing costs
- $4,947
- Reserves months
- —
- Total cash needed
- —
Loan-product check · same deal, 3 products live
Conventional
25% down · 7.5% · 30yr
- Down + closing
- —
- Monthly P&I
- —
- Monthly cashflow
- —
- DSCR
- —
- Eligible?
- —
Personal DTI + credit; lowest rate.
DSCR
20% down · 8.5% · 30yr
- Down + closing
- —
- Monthly P&I
- —
- Monthly cashflow
- —
- DSCR
- —
- Eligible?
- —
No personal income docs; deal must DSCR.
Hard money
10% down · 12.0% · 12mo
- Down + closing
- —
- Monthly P&I
- —
- Monthly cashflow
- —
- DSCR
- —
- Eligible?
- —
Short-term bridge; refi at stabilization.
Listing history 12 events
-
2026-04-22status Pending
-
2026-04-13price $164,900
-
2026-04-01price $169,900
-
2026-03-24price $174,900
-
2026-02-27price $179,900
-
2026-01-27price $184,000
-
2025-12-30$189,000 Active
-
2018-09-24historical
-
2018-09-18$95,000
-
2018-03-05historical
-
2018-03-02$95,000
-
2009-06-18soldstatus $99,000
ⓘ Source: listings_history table (triggers on properties + properties_extension) + one-shot
backfill from property_details.listing_events for pre-trigger history.
Tax reassessment forecast KY · Resets to sale price
- Current annual tax
- $542 · $45/mo
- Projected year-2 tax
- $1,418 · $118/mo
- Expected delta
- +$876/yr (+$73/mo · 161.4%)
ⓘ Screening estimate from a state-policy table — verify with the county assessor before closing.
Climate risk First Street
- Flood 1/10 Low FEMA zone X (unshaded) · 0% chance over 30 yrs
- Wildfire 4/10 Moderate
- Heat 4/10 Moderate 7 d/yr ≥102°F today · 20 d/yr by 30 yrs out
- Wind 3/10 Moderate 6% chance of damaging wind over 30 yrs
- Air quality 1/10 Low 0 unhealthy d/yr today · 0 by 30 yrs out
Nearby sold comps map
Loading sold comps map…
Walkable amenities ~0.75 mi
Loading nearby amenities…
Taxation est. · year 1
- Rental income
- $13,271
- − Mortgage interest
- −$9,237
- − Property taxes
- −$542
- − Insurance
- −$824
- − Repairs & maintenance
- −$1,062
- − Management
- −$1,062
- − Depreciation
- −$4,797
- Taxable loss
- −$4,254
- Est. tax savings @ 24.0%
- +$1,021
- After-tax cash flow
- $-239/yr
For passive investors: Depreciation is non-cash, so a rental often shows a tax loss while cash-flowing — sheltering income. Rental losses are passive: they offset passive income freely, and up to $25,000/yr can offset ordinary (W-2) income if you actively participate and your MAGI is under $100k (phasing out to $0 by $150k); unused losses carry forward. On sale, claimed depreciation is recaptured at up to 25%, and gains may owe capital-gains tax (a 1031 exchange can defer both). Figures are a year-1 estimate at your 24.0% rate — not tax advice; consult a CPA.
Schools (NCES district)
- District
- Science Hill Independent
- NCES district ID
- 2105220
- Math proficiency
- 44% ▼ -13.00%
- Reading proficiency
- 55% ▼ -15.00%
- Median HH income
- $41,733
- Composite
- 41.54/100
- National rank
- #3444
- State rank
- #11 of 165 in KY
Livability — Science Hill
- Score
- 64/100
- State rank
- #300
- US rank
- #14380
Category grades
Schools grade is shown separately in the Schools card above.
Census & demographics
- Census place
- Science Hill, KY
- Population (ZIP)
- 5,962
Population outlook (Pulaski County) Hauer SSP2
- Today (2025)
- 65,414 people
- By 2030
- 65,828 · +0.6%
- By 2040
- 65,972 · +0.9%
- By 2050
- 65,108 · -0.5%
- By 2075
- 61,647 · -5.8%
- By 2100
- 53,613 · -18.0%
Race, ethnicity, and origin ACS 2023
- Neighborhood character
- Predominantly White (97%)
- Race & ethnicity
- White 97% Two or more races 2%
- Common ancestry
- Romanian 3% Subsaharan African 3% Slovak 2%
- Foreign-born
- 1% · Canada
- Languages at home
- 99% English-only · Spanish 1%
Political lean MEDSL · Pulaski
- 2024 margin
- Solid R (+65.2) · D 16.9% · R 82.1% · Other 1.0%
- 2008→2024 swing
- -9.9pp toward R · 2008: -55.4pp · 2024: -65.2pp
- All cycles
- 2024: R+65.2 2020: R+62.7 2016: R+66.7 2012: R+60.5 2008: R+55.4
Not yet ingested
- Civics
- —
Market trends
- HPI YoY
- ▲ 5.22%
- Current HPI
- 312.5486
- Rent YoY
- —
- Metro
- —
- State GDP YoY
- ▲ 1.81%
- F500 in state
- 4
Industry mix (Fortune 500 HQ in KY)
| Industry | F500 HQs | Revenue |
|---|---|---|
| Healthcare | 1 | $118B |
|
||
| Food / Beverage | 1 | $7B |
|
||
Price history
+66.6% since first listed12 events — show timeline
- 2026-04-22 Pending — ImagineMLS
- 2026-04-13 Price Changed $164,900 ImagineMLS
- 2026-04-01 Price Changed $169,900 ImagineMLS
- 2026-03-24 Price Changed $174,900 ImagineMLS
- 2026-02-27 Price Changed $179,900 ImagineMLS
- 2026-01-27 Price Changed $184,000 ImagineMLS
- 2025-12-30 Listed $189,000 ImagineMLS
- 2018-09-24 Listing Removed — ImagineMLS
- 2018-09-18 Listed $95,000 ImagineMLS
- 2018-03-05 Listing Removed — ImagineMLS
- 2018-03-02 Listed $95,000 ImagineMLS
- 2009-06-18 Sold (Public Records) $99,000 Public Records
Property tax history
-1.0%/yrLatest (2025): $542 · -7.6% YoY. Source: county tax records.
Cash-flow waterfall
monthlySold comps — $/sqft
last 12 mo · ≤1 miLoading sold comps…