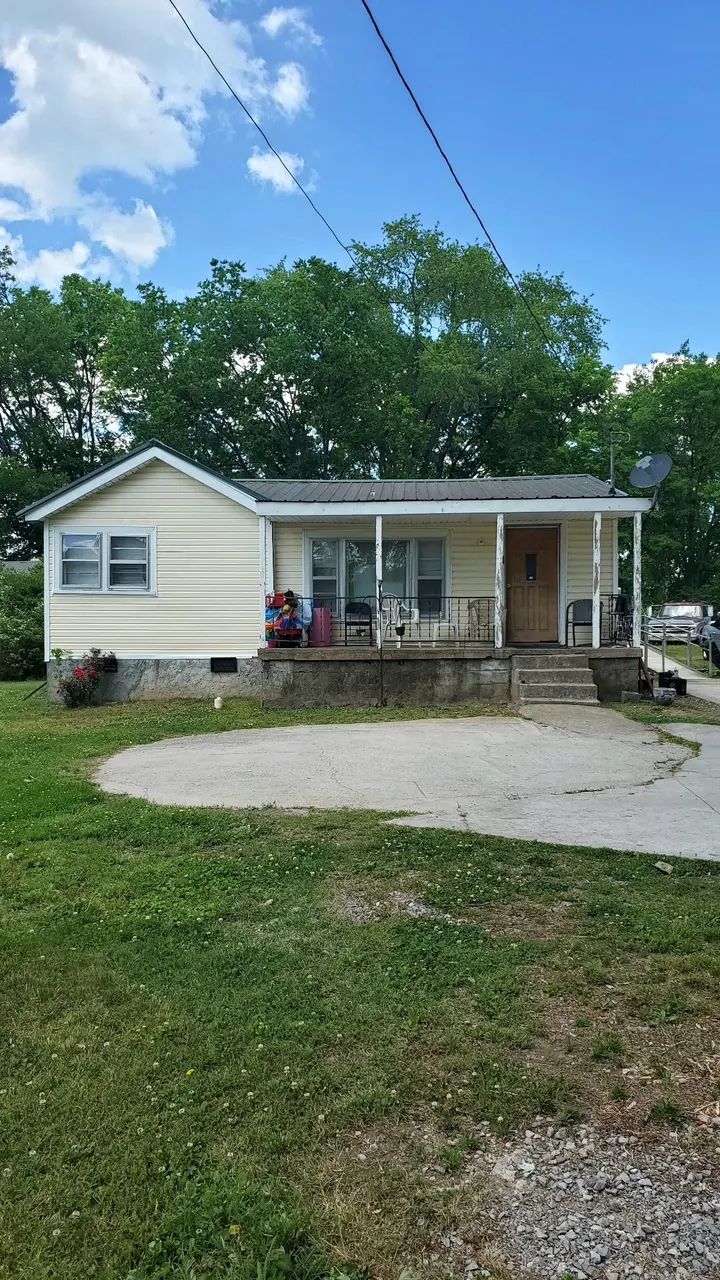
504 Demoss St · Gallatin, TN
Flood risk 1/10 · Minimal
- FEMA flood zone
- X (unshaded)
- Chance of flooding over 30 yrs
- 0.0%
- Est. flood insurance / yr
- $507 – $1,088
Fire risk 4/10 · Minor
- Est. fire insurance / yr
- $949 – $1,763
Heat risk 6/10 · Moderate
- Hot days now (above 106°F)
- 7 days/yr
- Hot days in 30 yrs
- 20 days/yr
Wind risk 4/10 · Minor
- Chance of severe wind over 30 yrs
- 9.0%
Air-quality risk 2/10 · Minimal
- Unhealthy air days now
- 1 days/yr
- Unhealthy air days in 30 yrs
- 3 days/yr
Risk factors via First Street. Map © Google.
Why this score? — see what drove the C- grade
The composite is a weighted blend of 9 inputs, each scored 0–100. Each bar is that input's sub-score; the figure is the points it added to the 100-point composite (weight × sub-score).
- Cash flow +15.7/30.0
- ARV discount +15.0/15.0
- DSCR +4.8/10.0
- Schools +3.6/10.0
- Livability +3.4/5.0
- 1% rule +3.3/10.0
- Rent growth +2.6/5.0
- Condition / age +2.5/5.0
- Appreciation +0.0/10.0
$200,000
🖨 Deal sheet 📄 Offer letter ✓ Due diligence
Listing remarks
Investor special with serious upside potential! This property is being sold strictly as-is and is ideal for cash buyers, rental, flippers, or those looking for their next renovation project. Situated on a generous lot, this home offers a great opportunity to add value with the right vision and improvements. Bones and location make it a worthwhile investment. Surrounded by improving homes and ongoing development, this is your chance to capitalize on area growth. Bring your contractor and your imagination! No repairs will be made by seller.
Key facts
- 0.3 acre lot
- Built 1970
- Listed 33 days
Property features AI
Finance
- Other: Pets allowed
Exterior
- Parking: Parking pad
- Security: Smoke detector(s)
- Utilities: Public water; Public sewer; Natural gas available; Water available; Cable connected
- Home design: Single family residence; One story; Accessible approach with ramp
- Construction: Frame construction; Aluminum roof; Block foundation; Existing (year built recorded)
- Exterior features: Covered porch
Interior
- Kitchen: Eat-in kitchen; Electric oven; Electric range; Refrigerator
- Bedrooms: Three bedrooms, all on the main level; Bedroom sizes: 10x16, 8x16, 9x12
- Flooring: Wood flooring
- Bathrooms: One full bathroom
- Heating & cooling: Natural gas heating; Central air conditioning
- Interior features: Smoke detectors installed; Crawl space basement
- Laundry & utility: Electric dryer hookup; Utility room (6x10)
Neighborhood map
What this means for you Summary
Snapshot
- This is a 3-bed/1.0-bath single-family listed at $200k.
Deal economics
- At list price, monthly cash flow is $89 ($1k/yr) — positive.
- The deal already cash-flows at list — no discount required.
- To meet the 1% rule (rent ≥ 1% of price), the offer needs to be $165k (17.4% below list).
- Recommended offer: $165k (17.4% below list) — sets the bar for 1% rule.
- Cap rate 6.8% vs local median 2.8% in Gallatin — top-decile yield for the area; either an underpriced asset or a hidden risk that comps aren't pricing in. Stress-test before assuming the spread holds.
Location & tenants
- Location reads 67/100 on livability (#108 in TN) — a middle-class / working-renter tenant base. Strengths: housing A+, cost of living A, crime A-; Watch: amenities F, commute F, health & safety F.
- Sumner County (suburban): math 44% / reading 39% proficiency, ranked #12 of 139 in TN (top 9%) — families likely to look elsewhere, expect single-tenant / working-renter base with shorter leases.
- Zoned schools: Benny C. Bills Elementary School (math 15% / reading 20%, grade F, #704 of 952 statewide, top 74%, 713 students, 0% FRL); Gallatin Senior High School (math 15% / reading 28%, grade F, #172 of 332 statewide, top 52%, 1,659 students, 0% FRL) — zoned schools average 0% FRL vs 34% district-wide (34 pts lower); this property's tenant base skews higher-income than the district average.
- Zoned-school proficiency averages 20% at this address vs 42% district-wide (-22 pts) — the specific schools serving this property underperform the Sumner County average; the district grade overstates school quality for this exact location.
- Market conditions: Rents flat; 1006 active listings in the ZIP; 34 comparable units currently listed for rent nearby; rentals at typical pace (median 24d on market — plan ~3-4 weeks tenant-placement turnaround); 41% of comp listings sitting > 30 days — soft ceiling on asking rent; solid renter incomes; 1,748 units permitted in Sumner County in 2024 (124 in 5+ unit buildings).
Forward outlook
- Local home prices are declining (-3.0%/yr); year-one equity from $1k of loan paydown is wiped out by about $6k of value loss. Plan a longer hold.
- Sumner County population projected at +35% by 2050 — long-run rental-demand tailwind backs the buy-and-hold thesis.
Negotiation context
- It's been on market 34 days — a 3% lower offer ($194k) is reasonable based on typical stale-listing flexibility.
- 2 sale attempts with the ask held roughly flat each time — persistent listings suggest the price (not the market) is what's stuck; bring a comps-based counter.
- Current owner paid $12k; list at $200k implies a 1567% gain — meaningful room to come down on a strong offer.
Risks & watch-outs
- Climate carrying-cost: extreme-heat days projected 7→20/yr by 2055 (HVAC capex compounding) — expect insurance premiums to compound above CPI over the hold.
Questions for the listing agent
- It's been on market 34 days. Have you received any prior offers? Is the seller open to a 17% concession, seller financing, or rate buy-down credit?
- Built in 1970 — when were the roof, HVAC, electrical panel, plumbing, and water heater last replaced?
- Is there a deadline driving the sale (1031 exchange, divorce, estate, relocation)? That informs how much negotiation room exists.
- Schools are D-rated, which usually means shorter tenancies and higher turnover. Who's the typical renter profile here, and what's been the actual vacancy rate?
- What's the average days-on-market for RENTAL listings here right now (not sales)? A rising rental-DOM trend means longer vacancies and softer asking-rent achievability than the comps imply.
- What's the recent tenant-quality profile in this submarket — average credit score on applications, eviction rate, late-payment / NSF rate, and stable-employment percentage? A property-management company in the area should have these aggregated.
- How much new for-sale + rental construction is in the pipeline within 1–3 miles? Heavy new supply typically softens prices + rents 12–24 months out; constrained supply supports both.
Investment metrics
- 1% rule
- 0.83% ✗
- Cap rate
- 6.83%
- Cash-on-cash
- 1.91%
- DSCR
- 1.08
- GRM
- 10.1
CMA / ARV
- ARV (median comp)
- $263,367
- List price
- $200,000
- Delta
- -24.06%
- Verdict
- UNDERPRICED
- Comps
- 20 within 1.0 mi
Show comp detail 12 sales within ~0.75 mi
| Address | Dist | Beds/Ba | Sqft | Sold | Price | $/sf | Match |
|---|---|---|---|---|---|---|---|
| 675 Anthony St | 0.11mi | 4/1.0 (+1) | 1,148 (-3%) | 2mo | $108,000 | $94 | 83 |
| 210 Ross Ave #110 | 0.52mi | 3/2.0 | 1,264 (+7%) | 0mo | $299,900 | $237 | 60 |
| 206 Ross Ave #110 | 0.52mi | 3/2.0 | 1,264 (+7%) | 3mo | $299,900 | $237 | 58 |
| 425 Hall St | 0.18mi | 2/1.0 (-1) | 1,023 (-14%) | 9mo | $166,500 | $163 | 57 |
| 214 Ross Ave #110 | 0.50mi | 3/2.0 | 1,264 (+7%) | 6mo | $299,900 | $237 | 56 |
| 375 Austin Park Dr | 0.35mi | 3/2.0 | 1,350 (+14%) | 1mo | $264,999 | $196 | 56 |
| 154 E Woodrow St | 0.64mi | 2/1.5 (-1) | 1,211 (+2%) | 9mo | $278,000 | $230 | 52 |
| 739 W Eastland St | 0.61mi | 2/1.0 (-1) | 1,075 (-9%) | 2mo | $178,000 | $166 | 49 |
| 660 Virginia Ave | 0.72mi | 3/2.0 | 1,112 (-6%) | 6mo | $299,900 | $270 | 47 |
| 206 Ross Ave #120 | 0.52mi | 3/2.0 | 1,357 (+15%) | 2mo | $310,000 | $228 | 45 |
| 214 Ross Ave #120 | 0.50mi | 3/2.0 | 1,357 (+15%) | 7mo | $309,900 | $228 | 42 |
| 667 N Boyers Ave | 0.64mi | 2/1.0 (-1) | 1,030 (-13%) | 6mo | $191,000 | $185 | 38 |
Match score weights: distance 35% · size 25% · config 20% · recency 20%. Top-matched comps best support the ARV.
Projected returns pro-forma
-3.0% appreciation · 0.39% rent growth · sell at horizon
- IRR
- -15.9%
- Equity multiple
- 0.45×
- Total profit
- $-31,041
- Equity at exit
- $29,821
- IRR
- -12.3%
- Equity multiple
- 0.35×
- Total profit
- $-36,509
- Equity at exit
- $17,292
Cash invested: $56,000 (down + closing). Projections, not guarantees.
Landlord ↔ Tenant lean methodology
- Overall (STATE)
- 87 Strongly Landlord-Friendly
- State Tennessee
- 87 Strongly Landlord-Friendly · R+13
- County
- — inherits STATE
- City
- — inherits STATE
ZIP-level market 37066
- Home prices YoY
- -32.9%
- Rents YoY
- 0.4%
- Active inventory
- 1006
- Price-to-rent
- 10.1×
Monthly cashflow live
- Estimated rent
- $1,653 high interval (Pro) →
- Mortgage (P&I)
- −$1,049
- Tax from tax record
- −$84 /mo · $1,013/yr
- Insurance
- −$83
- HOA
- −$0
- Vacancy / Maint / Mgmt
- −$347
- Net cashflow
- $89
Break-even live
UW: 25.0% down · 7.5% · 30yr · 1.5% tax · 5.0% vac · 8.0% maint · 8.0% mgmt
Financing live
Cash to close
- Down payment
- $50,000
- Closing costs
- $6,000
- Reserves months
- —
- Total cash needed
- —
Loan-product check · same deal, 3 products live
Conventional
25% down · 7.5% · 30yr
- Down + closing
- —
- Monthly P&I
- —
- Monthly cashflow
- —
- DSCR
- —
- Eligible?
- —
Personal DTI + credit; lowest rate.
DSCR
20% down · 8.5% · 30yr
- Down + closing
- —
- Monthly P&I
- —
- Monthly cashflow
- —
- DSCR
- —
- Eligible?
- —
No personal income docs; deal must DSCR.
Hard money
10% down · 12.0% · 12mo
- Down + closing
- —
- Monthly P&I
- —
- Monthly cashflow
- —
- DSCR
- —
- Eligible?
- —
Short-term bridge; refi at stabilization.
Rent comps 34 comps
| Address | Beds | Baths | Sqft | Rent | $/sqft | DOM | Units | Dist |
|---|---|---|---|---|---|---|---|---|
| 429 Demoss St Gallatin, TN | 2.0 | 1.0 | 702 | $1,475 | $2.10 | 14d | 1 | 0.08mi |
| 501 Small St Gallatin, TN | 2.0 | 2.0 | 1050 | $1,495 | $1.42 | 23d | 1 | 0.18mi |
| 614 N Water Ave Gallatin, TN | 2.0–3.0 | 1.0–2.0 | 1097 | $1,702 | $1.55 | 1d | 17 | 0.43mi |
| 206 Ross Ave Gallatin, TN | 3.0 | 2.0 | 1264 | $2,200 | $1.74 | 43d | 1 | 0.53mi |
| 206 Ross Ave #110 Gallatin, TN | 3.0 | 2.0 | 1264 | $2,075 | $1.64 | 4d | 1 | 0.53mi |
| 547 N Water Ave Gallatin, TN | 2.0 | 1.0 | 950 | $1,199 | $1.26 | 43d | 1 | 0.53mi |
| 711 W Eastland Ave Unit C Gallatin, TN | 2.0 | 1.0 | 900 | $1,300 | $1.44 | 43d | 1 | 0.56mi |
| 711 W Eastland St Gallatin, TN | 2.0 | 1.0 | 1100 | $1,455 | $1.32 | 23d | 1 | 0.56mi |
| 665-681 W Eastland Ave Unit 681 Gallatin, TN | 2.0 | 1.0 | 1008 | $1,400 | $1.39 | 7d | 1 | 0.56mi |
| 872 W Albert Gallatin Ave Gallatin, TN | 3.0 | 2.0 | 1452 | $1,750 | $1.21 | 4d | 1 | 0.61mi |
| 1720 Elliott Williams Way Gallatin, TN | 3.0 | 3.0 | 1359 | $1,950 | $1.43 | 17d | 1 | 0.66mi |
| 246 E Woodrow St Gallatin, TN | 3.0 | 1.0 | 1488 | $1,950 | $1.31 | 7d | 1 | 0.72mi |
| 500 Virginia Ave Gallatin, TN | 3.0 | 1.0 | 1112 | $1,790 | $1.61 | 43d | 1 | 0.74mi |
| 128 N Water Ave Gallatin, TN | 1.0–2.0 | 1.0–2.0 | 766 | $2,400 | $3.13 | 23d | 2 | 0.82mi |
| 272 Brown Pl Gallatin, TN | 2.0 | 1.0 | 774 | $995 | $1.29 | 21d | 1 | 0.82mi |
| 122 S Ford St Gallatin, TN | 2.0 | 1.0 | 750 | $1,099 | $1.47 | 43d | 1 | 0.82mi |
| 203 N Electra St Gallatin, TN | 2.0 | 1.5 | 1020 | $1,199 | $1.18 | 43d | 1 | 0.90mi |
| 146 N Trigg Ave #130 Gallatin, TN | 3.0 | 2.5 | 1323 | $1,847 | $1.40 | 23d | 1 | 0.91mi |
| 217 Greenleaf Cir Gallatin, TN | 2.0 | 1.0 | 800 | $1,199 | $1.50 | 43d | 1 | 0.94mi |
| 257 W Smith St Gallatin, TN | 2.0 | 1.5 | 1000 | $1,375 | $1.38 | 23d | 1 | 0.94mi |
| 202 Cemetery Ave Gallatin, TN | 2.0 | 1.5 | 1000 | $1,375 | $1.38 | 11d | 1 | 0.94mi |
| 243 W Smith St Gallatin, TN | 2.0 | 1.5 | 1000 | $1,375 | $1.38 | 43d | 1 | 0.94mi |
| 230 N Hume Ave Unit 3 Gallatin, TN | 2.0 | 1.0 | 1000 | $1,100 | $1.10 | 21d | 1 | 0.94mi |
| 209 W Bledsoe St Gallatin, TN | 3.0 | 1.0 | 912 | $1,725 | $1.89 | 43d | 1 | 1.00mi |
| 112 Summerlin Dr Gallatin, TN | 3.0 | 2.0 | 1342 | $1,895 | $1.41 | 12d | 1 | 1.11mi |
| 143 Morrison St Unit 2 Gallatin, TN | 2.0 | 2.0 | 840 | $1,395 | $1.66 | 43d | 1 | 1.22mi |
| 143 Morrison St #1 Gallatin, TN | 2.0 | 1.0 | 840 | $1,295 | $1.54 | 43d | 1 | 1.22mi |
| 550 E Bledsoe St Apt B24 Gallatin, TN | 2.0 | 1.0 | 1000 | $1,195 | $1.20 | 3d | 1 | 1.27mi |
| 550 E Bledsoe St Gallatin, TN | 1.0–2.0 | 1.0 | 820 | $1,195 | $1.46 | 3d | 2 | 1.29mi |
| 735 Trail Dr Gallatin, TN | 2.0 | 1.0 | 820 | $1,295 | $1.58 | 43d | 1 | 1.30mi |
| 302 A Dobbins Pike Gallatin, TN | 3.0 | 1.5 | 1100 | $1,395 | $1.27 | 23d | 1 | 1.32mi |
| 745 Trail Dr Gallatin, TN | 2.0 | 1.0 | 820 | $1,295 | $1.58 | 43d | 1 | 1.33mi |
| 199 Albright Farms Dr Gallatin, TN | 1.0–3.0 | 1.0–2.0 | 1107 | $1,669 | $1.51 | 43d | 1 | 1.34mi |
| 194 W Morningside Dr Gallatin, TN | 2.0 | 1.0 | 875 | $1,250 | $1.43 | 23d | 1 | 1.44mi |
Listing history 17 events
-
2026-06-18days on market $200,000 Active 34 DOM
-
2026-06-17days on market $200,000 Active 33 DOM
-
2026-06-16days on market $200,000 Active 32 DOM
-
2026-06-15days on market $200,000 Active 31 DOM
-
2026-06-13days on market $200,000 Active 29 DOM
-
2026-06-13days on market $200,000 Active 28 DOM
-
2026-06-09days on market $200,000 Active 25 DOM
-
2026-06-08days on market $200,000 Active 24 DOM
-
2026-06-07days on market $200,000 Active 23 DOM
-
2026-06-05days on market $200,000 Active 20 DOM
-
2026-06-03days on market $200,000 Active 19 DOM
-
2026-06-02days on market $200,000 Active 18 DOM
-
2026-06-01days on market $200,000 Active 17 DOM
-
2026-05-31days on market $200,000 Active 16 DOM
-
2026-04-28$200,000 Active
-
2026-04-27historical
-
2001-07-25soldstatus $12,000
ⓘ Source: listings_history table (triggers on properties + properties_extension) + one-shot
backfill from property_details.listing_events for pre-trigger history.
Tax reassessment forecast TN · Resets to sale price
- Current annual tax
- $1,013 · $84/mo
- Projected year-2 tax
- $1,420 · $118/mo
- Expected delta
- +$407/yr (+$34/mo · 40.2%)
ⓘ Screening estimate from a state-policy table — verify with the county assessor before closing.
Climate risk First Street
- Flood 1/10 Low FEMA zone X (unshaded) · 0% chance over 30 yrs
- Wildfire 4/10 Moderate
- Heat 6/10 Major 7 d/yr ≥106°F today · 20 d/yr by 30 yrs out
- Wind 4/10 Moderate 9% chance of damaging wind over 30 yrs
- Air quality 2/10 Low 1 unhealthy d/yr today · 3 by 30 yrs out
Nearby sold comps map
Loading sold comps map…
Walkable amenities ~0.75 mi
Loading nearby amenities…
Taxation est. · year 1
- Rental income
- $19,833
- − Mortgage interest
- −$11,203
- − Property taxes
- −$1,013
- − Insurance
- −$1,000
- − Repairs & maintenance
- −$1,587
- − Management
- −$1,587
- − Depreciation
- −$5,818
- Taxable loss
- −$2,375
- Est. tax savings @ 24.0%
- +$570
- After-tax cash flow
- $1,639/yr
For passive investors: Depreciation is non-cash, so a rental often shows a tax loss while cash-flowing — sheltering income. Rental losses are passive: they offset passive income freely, and up to $25,000/yr can offset ordinary (W-2) income if you actively participate and your MAGI is under $100k (phasing out to $0 by $150k); unused losses carry forward. On sale, claimed depreciation is recaptured at up to 25%, and gains may owe capital-gains tax (a 1031 exchange can defer both). Figures are a year-1 estimate at your 24.0% rate — not tax advice; consult a CPA.
Schools (NCES district)
- District
- Sumner County
- NCES district ID
- 4704020
- Math proficiency
- 44% ▼ -11.00%
- Reading proficiency
- 39% ▼ -5.00%
- Median HH income
- $56,998
- Composite
- 36.44/100
- National rank
- #4667
- State rank
- #12 of 139 in TN
Livability — Gallatin
- Score
- 67/100
- State rank
- #108
- US rank
- #11017
Category grades
Schools grade is shown separately in the Schools card above.
Census & demographics
- Census place
- Gallatin, TN
- County
- Sumner County · 196,654 people
- City population
- 64,650
- Metro
- Nashville-Davidson--Murfreesboro--Franklin, TN
- Population (ZIP)
- 64,650
- Household income
- $81,614
- Rent vs Own
- Severe rent burden
- 2172.0
Population outlook (Sumner County) Hauer SSP2
- Today (2025)
- 208,284 people
- By 2030
- 223,902 · +7.5%
- By 2040
- 253,892 · +21.9%
- By 2050
- 281,199 · +35.0%
- By 2075
- 344,866 · +65.6%
- By 2100
- 384,369 · +84.5%
Race, ethnicity, and origin ACS 2023
- Neighborhood character
- Predominantly White (69%)
- Race & ethnicity
- White 69% Black 14% Hispanic / Latino 11% Two or more races 8% Asian 2%
- Hispanic origin (detail)
- Mexican 6% Puerto Rican 2%
- Common ancestry
- Italian 2% Lithuanian 2% Serbian 2%
- Foreign-born
- 6% · Canada
- Languages at home
- 91% English-only · Spanish 7% Other Indo-European 1%
Political lean MEDSL · Sumner
- 2024 margin
- Solid R (+41.8) · D 28.5% · R 70.3% · Other 1.1%
- 2008→2024 swing
- -6.9pp toward R · 2008: -34.9pp · 2024: -41.8pp
- All cycles
- 2024: R+41.8 2020: R+38.6 2016: R+45.0 2012: R+42.0 2008: R+34.9
Not yet ingested
- Civics
- —
Market trends
- HPI YoY
- ▼ -142.76%
- Current HPI
- 290.8043
- Rent YoY
- ▲ 0.39%
- Metro
- Nashville-Davidson--Murfreesboro--Franklin, TN
- State GDP YoY
- ▲ 2.78%
- F500 in state
- 22
Industry mix (Fortune 500 HQ in TN)
| Industry | F500 HQs | Revenue |
|---|---|---|
| Healthcare | 3 | $91B |
|
||
| Retail | 3 | $72B |
|
||
| Transportation / Logistics | 1 | $88B |
|
||
| Paper / Packaging | 1 | $19B |
|
||
| Insurance | 1 | $13B |
|
||
| Energy | 1 | $12B |
|
||
Price history
+1566.7% since first listed4 events — show timeline
- 2026-05-22 Relisted — REALTRACS as Distributed by MLS Grid
- 2026-04-28 Listed $200,000 REALTRACS as Distributed by MLS Grid
- 2026-04-27 Coming Soon $200,000 REALTRACS as Distributed by MLS Grid
- 2001-07-25 Sold (Public Records) $12,000 Public Records
Property tax history
+6.0%/yrLatest (2025): $1,013 · +0.0% YoY. Source: county tax records.
Cash-flow waterfall
monthlySold comps — $/sqft
last 12 mo · ≤1 miLoading sold comps…