 Triplex
17910 Old Monte Rio Rd · Guerneville, CA
Flood risk 1/10 · Minimal
- FEMA flood zone
- X (unshaded)
- Chance of flooding over 30 yrs
- 0.0%
- Est. flood insurance / yr
- $507 – $1,088
Fire risk 4/10 · Minor
- Est. fire insurance / yr
- $659 – $1,223
Heat risk 2/10 · Minimal
- Hot days now (above 87°F)
- 7 days/yr
- Hot days in 30 yrs
- 19 days/yr
Wind risk 1/10 · Minimal
- Chance of severe wind over 30 yrs
- —
Air-quality risk 9/10 · Severe
- Unhealthy air days now
- 17 days/yr
- Unhealthy air days in 30 yrs
- 19 days/yr
Risk factors via First Street. Map © Google.
Why this score? — see what drove the C grade
The composite is a weighted blend of 9 inputs, each scored 0–100. Each bar is that input's sub-score; the figure is the points it added to the 100-point composite (weight × sub-score).
- Cash flow +23.1/30.0
- DSCR +7.4/10.0
- ARV discount +7.4/15.0
- 1% rule +5.8/10.0
- Schools +4.3/10.0
- Livability +3.0/5.0
- Rent growth +2.5/5.0
- Condition / age +2.5/5.0
- Appreciation +0.0/10.0
$675,000
🖨 Deal sheet 📄 Offer letter ✓ Due diligence
Multi-family units
County records classify this as Multi-Family (2-4 Unit). Listing-text estimate: 3 units. confirmed
Listing remarks MLS
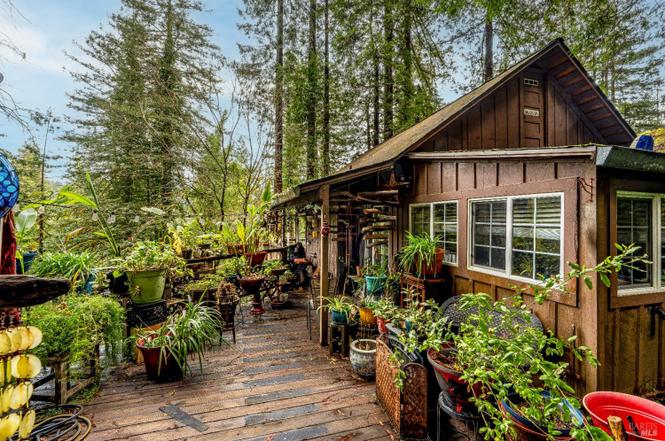
Great Investment Opportunity for this fixer. Duplex plus a detached cottage. Nice patio areas, stone walkways,decks and detached garage.
Key facts
- Private deck
- Updated bathrooms
- Updated kitchens
Tags
Property features AI
Finance
- HOA & community: No association
Exterior
- Parking: Detached garage (1 garage space); Total parking for 3 vehicles
- Security: Carbon monoxide detector
- Utilities: Public sewer
- Home design: Residential income property (triplex); Two levels; Updated/remodeled condition (varies by unit)
- Construction: Composition roof
- Exterior features: Private lot; Balcony/Deck
Interior
- Kitchen: Kitchen details vary by unit
- Bedrooms: Unit 1: 2 bedrooms; Unit 2: studio; Unit 3: 1 bedroom
- Bathrooms: Unit 1: 1 full bathroom; Unit 2: 1 full bathroom; Unit 3: (bathroom count not provided)
- Heating & cooling: Wall furnace heating; No central cooling
- Interior features: In-unit and common-area conditions vary by unit; Carbon monoxide detector
- Laundry & utility: Laundry located in common area
Neighborhood map
What this means for you Summary
Snapshot
- This is a 3 × 3-bed/3.0-bath units multifamily listed at $675k.
Deal economics
- At list price, monthly cash flow is $1k ($14k/yr) — positive. Per door: $402/mo.
- The deal already cash-flows at list — no discount required.
- Meets the 1% rule at list price ($7k rent vs $675k).
- Recommended offer: $614k (9.0% below list) — sets the bar for market timing.
- Cap rate 8.4% vs local median 2.1% in Guerneville — top-decile yield for the area; either an underpriced asset or a hidden risk that comps aren't pricing in. Stress-test before assuming the spread holds.
Location & tenants
- Location reads 59/100 on livability (#666 in CA) — a working-class tenant base; expect higher turnover. Strengths: crime A-, employment B; Watch: health & safety D, amenities F, commute F.
- West Sonoma County Union High (suburban): math 43% / reading 56% proficiency, ranked #143 of 517 in CA (top 28%) — families likely to look elsewhere, expect single-tenant / working-renter base with shorter leases.
- Market conditions: 82 active listings in the ZIP; 1 comparable units currently listed for rent nearby; solid renter incomes; 1,039 units permitted in Sonoma County in 2024 (185 in 5+ unit buildings).
- At $7,295/mo this rent would consume 102% of the median local household income ($86k/yr) (locally 242% of renters already pay >50% of income on rent) — very limited rent-growth headroom before tenants either downsize or default.
Forward outlook
- Local home prices are declining (-3.0%/yr); year-one equity from $5k of loan paydown is wiped out by about $20k of value loss. Plan a longer hold.
- Sonoma County population projected at +8% by 2050 — modest demand growth; plan on rents tracking national, not racing it.
Negotiation context
- It's been on market 108 days — a 9% lower offer ($614k) is reasonable based on typical stale-listing flexibility.
- 3 sale attempts since 13y ago with the ask held roughly flat each time — persistent listings suggest the price (not the market) is what's stuck; bring a comps-based counter.
- Current owner paid $161k; list at $675k implies a 319% gain — meaningful room to come down on a strong offer.
Risks & watch-outs
- Watch-outs: built in 1923 — expect roof / HVAC / electrical / plumbing capex.
Questions for the listing agent
- It's been on market 108 days. Have you received any prior offers? Is the seller open to a 9% concession, seller financing, or rate buy-down credit?
- Can we see the unit-by-unit rent roll, current vacancy, and any below-market leases? What's the average tenancy length?
- What capital expenditures (roof, boiler, parking lot, exteriors) have been made in the last 5 years, and what's planned in the next 2?
- Built in 1923 — when were the roof, HVAC, electrical panel, plumbing, and water heater last replaced?
- Why hasn't it sold? Are there any deal-killer items the seller is aware of (foundation, flood, title, zoning, code violations)?
- Is there a deadline driving the sale (1031 exchange, divorce, estate, relocation)? That informs how much negotiation room exists.
- What's the average days-on-market for RENTAL listings here right now (not sales)? A rising rental-DOM trend means longer vacancies and softer asking-rent achievability than the comps imply.
- What's the recent tenant-quality profile in this submarket — average credit score on applications, eviction rate, late-payment / NSF rate, and stable-employment percentage? A property-management company in the area should have these aggregated.
- How much new apartment / multifamily construction is in the pipeline within 1–3 miles? Heavy new supply (>2% of stock underway) typically softens rents 12–24 months out; light construction supports rent growth.
Investment metrics
- 1% rule
- 1.08% ✓
- Cap rate
- 8.44%
- Cash-on-cash
- 7.65%
- DSCR
- 1.34
- GRM
- 7.7
CMA / ARV
- ARV (on-the-fly)
- $673,380
- Comps found
- 1
Show comp detail 1 sale within ~0.75 mi
| Address | Dist | Beds/Ba | Sqft | Sold | Price | $/sf | Match |
|---|---|---|---|---|---|---|---|
| 17408 River Ln | 0.25mi | 3/3.0 (-1) | 1,900 (+9%) | 21mo | $736,000 | $387 | 50 |
Match score weights: distance 35% · size 25% · config 20% · recency 20%. Top-matched comps best support the ARV.
Projected returns pro-forma
-3.0% appreciation · 3.0% rent growth · sell at horizon
- IRR
- -4.6%
- Equity multiple
- 0.83×
- Total profit
- $-32,582
- Equity at exit
- $100,645
- IRR
- 5.1%
- Equity multiple
- 1.37×
- Total profit
- $70,640
- Equity at exit
- $58,362
Cash invested: $189,000 (down + closing). Projections, not guarantees.
Landlord ↔ Tenant lean methodology
- Overall (STATE)
- 18 Strongly Tenant-Friendly
- State California
- 18 Strongly Tenant-Friendly · D+13
- County
- — inherits STATE
- City
- — inherits STATE
ZIP-level market 95446
- Active inventory
- 82
- Price-to-rent
- 23.1×
Monthly cashflow live
- Estimated rent
- $7,295 medium interval (Pro) →
- Mortgage (P&I)
- −$3,540
- Tax from tax record
- −$737 /mo · $8,843/yr
- Insurance
- −$281
- HOA
- −$0
- Vacancy / Maint / Mgmt
- −$1,532
- Net cashflow
- $1,205
Break-even live
3-unit breakdown (identical units grouped — click to expand)
| Units | Beds | Baths | Est. rent |
|---|---|---|---|
| 3× units | 3 | 3 | $7,296 |
| #1 | 3 | 3 | $2,432 |
| #2 | 3 | 3 | $2,432 |
| #3 | 3 | 3 | $2,432 |
| Total (3 units) | $7,295 | ||
UW: 25.0% down · 7.5% · 30yr · 1.5% tax · 5.0% vac · 8.0% maint · 8.0% mgmt
Financing live
Cash to close
- Down payment
- $168,750
- Closing costs
- $20,250
- Reserves months
- —
- Total cash needed
- —
Loan-product check · same deal, 3 products live
Conventional
25% down · 7.5% · 30yr
- Down + closing
- —
- Monthly P&I
- —
- Monthly cashflow
- —
- DSCR
- —
- Eligible?
- —
Personal DTI + credit; lowest rate.
DSCR
20% down · 8.5% · 30yr
- Down + closing
- —
- Monthly P&I
- —
- Monthly cashflow
- —
- DSCR
- —
- Eligible?
- —
No personal income docs; deal must DSCR.
Hard money
10% down · 12.0% · 12mo
- Down + closing
- —
- Monthly P&I
- —
- Monthly cashflow
- —
- DSCR
- —
- Eligible?
- —
Short-term bridge; refi at stabilization.
Rent comps 1 comps
| Address | Beds | Baths | Sqft | Rent | $/sqft | DOM | Units | Dist |
|---|---|---|---|---|---|---|---|---|
| 16799 Center Way Guerneville, CA | 5.0 | 2.0 | 2040 | $6,900 | $3.38 | 12d | 1 | 0.91mi |
Listing history 29 events
-
2026-06-18days on market $675,000 Active 108 DOM
-
2026-06-17days on market $675,000 Active 107 DOM
-
2026-06-16days on market $675,000 Active 106 DOM
-
2026-06-15days on market $675,000 Active 105 DOM
-
2026-06-14days on market $675,000 Active 103 DOM
-
2026-06-13days on market $675,000 Active 102 DOM
-
2026-06-10days on market $675,000 Active 100 DOM
-
2026-06-09days on market $675,000 Active 99 DOM
-
2026-06-08days on market $675,000 Active 98 DOM
-
2026-06-07days on market $675,000 Active 97 DOM
-
2026-06-05days on market $675,000 Active 94 DOM
-
2026-06-03days on market $675,000 Active 93 DOM
-
2026-06-02days on market $675,000 Active 92 DOM
-
2026-06-01days on market $675,000 Active 91 DOM
-
2026-05-31days on market $675,000 Active 90 DOM
-
2026-05-30days on market $675,000 Active 89 DOM
-
2026-03-02$675,000 Active
-
2016-09-05historical Off-Market
-
2016-03-21$399,000 Active
-
2013-02-28soldstatus $161,000 Sold 136-char remark
Show marketing remark (136 chars)
Great Investment Opportunity for this fixer. Duplex plus a detached cottage. Nice patio areas, stone walkways,decks and detached garage.
-
2013-02-28soldstatus $161,000
Show marketing remark (136 chars)
Great Investment Opportunity for this fixer. Duplex plus a detached cottage. Nice patio areas, stone walkways,decks and detached garage.
-
2013-02-12status Contingent (Show) 136-char remark
Show marketing remark (136 chars)
Great Investment Opportunity for this fixer. Duplex plus a detached cottage. Nice patio areas, stone walkways,decks and detached garage.
-
2013-01-30price $170,100 136-char remark
Show marketing remark (136 chars)
Great Investment Opportunity for this fixer. Duplex plus a detached cottage. Nice patio areas, stone walkways,decks and detached garage.
-
2013-01-23$170,000 Active 136-char remark
Show marketing remark (136 chars)
Great Investment Opportunity for this fixer. Duplex plus a detached cottage. Nice patio areas, stone walkways,decks and detached garage.
-
2006-06-29soldstatus $379,500
-
2001-11-20soldstatus $235,000
-
2000-03-01soldstatus $181,000
-
1997-08-11soldstatus $118,000
-
1988-05-09soldstatus $95,000
ⓘ Source: listings_history table (triggers on properties + properties_extension) + one-shot
backfill from property_details.listing_events for pre-trigger history.
Tax reassessment forecast CA · Resets to sale price
- Current annual tax
- $8,843 · $737/mo
- Projected year-2 tax
- $8,843 · $737/mo
- Expected delta
- $0/yr ($0/mo · 0.0%)
ⓘ Screening estimate from a state-policy table — verify with the county assessor before closing.
Climate risk First Street
- Flood 1/10 Low FEMA zone X (unshaded) · 0% chance over 30 yrs
- Wildfire 4/10 Moderate
- Heat 2/10 Low 7 d/yr ≥87°F today · 19 d/yr by 30 yrs out
- Wind 1/10 Low
- Air quality 9/10 Extreme 17 unhealthy d/yr today · 19 by 30 yrs out
Nearby sold comps map
Loading sold comps map…
Walkable amenities ~0.75 mi
Loading nearby amenities…
Taxation est. · year 1
- Rental income
- $87,540
- − Mortgage interest
- −$37,810
- − Property taxes
- −$8,843
- − Insurance
- −$3,375
- − Repairs & maintenance
- −$7,003
- − Management
- −$7,003
- − Depreciation
- −$19,636
- Taxable income
- $3,868
- Est. tax owed @ 24.0%
- −$928
- After-tax cash flow
- $13,533/yr
For passive investors: Depreciation is non-cash, so a rental often shows a tax loss while cash-flowing — sheltering income. Rental losses are passive: they offset passive income freely, and up to $25,000/yr can offset ordinary (W-2) income if you actively participate and your MAGI is under $100k (phasing out to $0 by $150k); unused losses carry forward. On sale, claimed depreciation is recaptured at up to 25%, and gains may owe capital-gains tax (a 1031 exchange can defer both). Figures are a year-1 estimate at your 24.0% rate — not tax advice; consult a CPA.
Schools (NCES district)
- District
- West Sonoma County Union High
- NCES district ID
- 0602670
- Math proficiency
- 43% ▲ 16.00%
- Reading proficiency
- 56% ▼ -1.00%
- Median HH income
- $61,845
- Composite
- 43.45/100
- National rank
- #3006
- State rank
- #143 of 517 in CA
Livability — Guerneville
- Score
- 59/100
- State rank
- #666
- US rank
- #20615
Category grades
Schools grade is shown separately in the Schools card above.
Census & demographics
- Census place
- Guerneville, CA
- County
- Sonoma County · 449,805 people
- City population
- 4,607
- Metro
- Santa Rosa-Petaluma, CA
- Population (ZIP)
- 4,607
- Household income
- $85,833
- Rent vs Own
- Severe rent burden
- 242.0
Population outlook (Sonoma County) Hauer SSP2
- Today (2025)
- 539,935 people
- By 2030
- 554,870 · +2.8%
- By 2040
- 573,262 · +6.2%
- By 2050
- 580,715 · +7.6%
- By 2075
- 579,229 · +7.3%
- By 2100
- 547,835 · +1.5%
Race, ethnicity, and origin ACS 2023
- Neighborhood character
- Predominantly White (76%)
- Race & ethnicity
- White 76% Hispanic / Latino 15% Two or more races 13% Native American 2%
- Hispanic origin (detail)
- Mexican 12% Cuban 2%
- Common ancestry
- Italian 7% Slovak 5% Lithuanian 4%
- Foreign-born
- 6% · Canada
- Languages at home
- 91% English-only · Spanish 7% Other Indo-European 1% French/Haitian/Cajun 1%
Political lean MEDSL · Sonoma
- 2024 margin
- Solid D (+46.2) · D 71.4% · R 25.2% · Other 3.3%
- 2008→2024 swing
- -3.4pp toward R · 2008: 49.6pp · 2024: 46.2pp
- All cycles
- 2024: D+46.2 2020: D+51.5 2016: D+47.9 2012: D+44.9 2008: D+49.6
Not yet ingested
- Civics
- —
Market trends
- HPI YoY
- ▼ -578.26%
- Current HPI
- 267.138
- Rent YoY
- —
- Metro
- Santa Rosa-Petaluma, CA
- State GDP YoY
- ▲ 3.21%
- F500 in state
- 116
Industry mix (Fortune 500 HQ in CA)
| Industry | F500 HQs | Revenue |
|---|---|---|
| Technology | 27 | $1,492B |
|
||
| Financial Services | 3 | $174B |
|
||
| Retail | 3 | $44B |
|
||
| Insurance | 3 | $26B |
|
||
| Media / Entertainment | 2 | $115B |
|
||
| Pharmaceuticals / Biotech | 2 | $62B |
|
||
Price history
+610.5% since first listed13 events — show timeline
- 2026-03-02 Listed $675,000 BAREIS
- 2016-09-05 Delisted — BAREIS
- 2016-03-21 Listed $399,000 BAREIS
- 2013-02-28 Sold (Public Records) $161,000 Public Records
- 2013-02-28 Sold (MLS) $161,000 BAREIS
- 2013-02-12 Pending — BAREIS
- 2013-01-30 Price Changed $170,100 BAREIS
- 2013-01-23 Listed $170,000 BAREIS
- 2006-06-29 Sold (Public Records) $379,500 Public Records
- 2001-11-20 Sold (Public Records) $235,000 Public Records
- 2000-03-01 Sold (Public Records) $181,000 Public Records
- 1997-08-11 Sold (Public Records) $118,000 Public Records
- 1988-05-09 Sold (Public Records) $95,000 Public Records
Property tax history
+1.4%/yrLatest (2025): $8,843 · +6.1% YoY. Source: county tax records.
Cash-flow waterfall
monthlySold comps — $/sqft
last 12 mo · ≤1 miLoading sold comps…