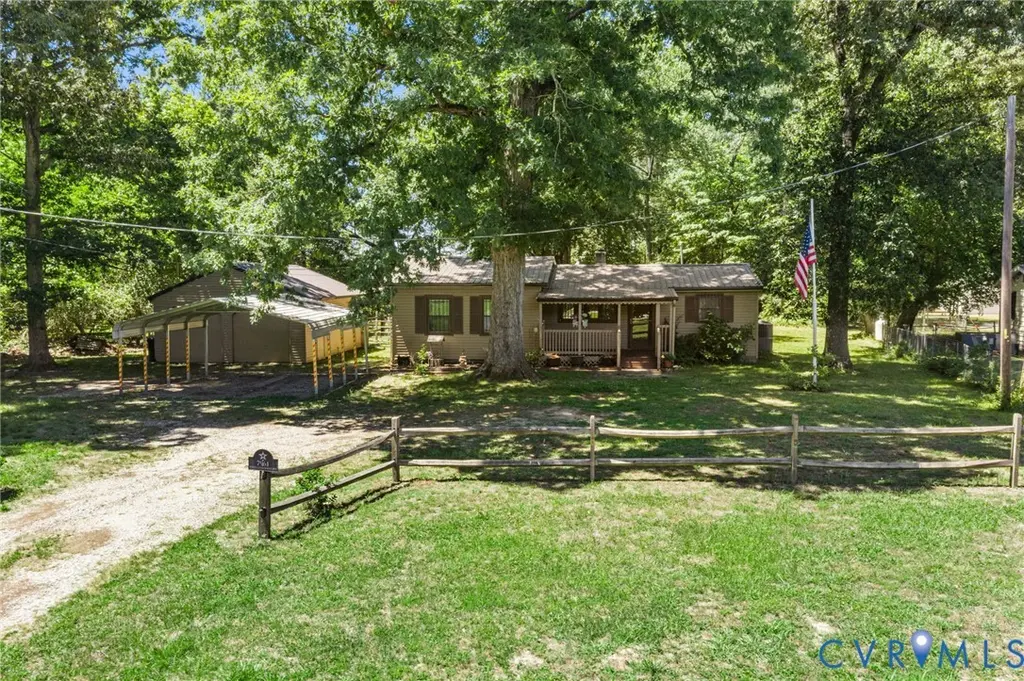
7961 Martin Luther King Hwy · Claremont, VA
Flood risk 1/10 · Minimal
- FEMA flood zone
- X (unshaded)
- Chance of flooding over 30 yrs
- 0.0%
- Est. flood insurance / yr
- $507 – $1,088
Fire risk 5/10 · Moderate
- Est. fire insurance / yr
- $666 – $1,236
Heat risk 8/10 · Major
- Hot days now (above 107°F)
- 7 days/yr
- Hot days in 30 yrs
- 16 days/yr
Wind risk 6/10 · Moderate
- Chance of severe wind over 30 yrs
- 59.0%
Air-quality risk 2/10 · Minimal
- Unhealthy air days now
- 1 days/yr
- Unhealthy air days in 30 yrs
- 1 days/yr
Risk factors via First Street. Map © Google.
Why this score? — see what drove the C- grade
The composite is a weighted blend of 9 inputs, each scored 0–100. Each bar is that input's sub-score; the figure is the points it added to the 100-point composite (weight × sub-score).
- Cash flow +16.5/30.0
- Appreciation +9.3/10.0
- ARV discount +7.5/15.0
- DSCR +5.1/10.0
- Schools +5.0/10.0
- 1% rule +3.3/10.0
- Rent growth +2.5/5.0
- Condition / age +2.5/5.0
- Livability +1.7/5.0
$200,000
🖨 Deal sheet 📄 Offer letter ✓ Due diligence
Listing remarks MLS
Charming rancher in the Spring Grove area of Surry County. This 1,064 sqft rancher on 1.4 acres has been completely renovated on the inside with new paint, flooring, laundry room and bathroom. With well sized living and family rooms, this 2 bed/1 bath home is perfect for a starter home or excellent investment property. Plenty of outdoor spaced and an oversized rear deck highlight the exterior of the property. Conveniently located 11 miles to Waverly, 25 miles to Hopewell, 12 miles to the Jamestown Ferry and less than 20 miles to the Surry Nuclear Power Plant. This home also has a strong rental history the last ten years as an investment property!
Key facts
- Covered deck
- Fenced backyard
- Detached garage
Tags
Property features AI
Exterior
- Parking: Detached garage; Off-street parking; 2-car garage
- Utilities: Well water; Septic tank
- Home design: Single-story home; Resale property
- Construction: Block and vinyl siding construction; Metal roof
- Exterior features: Front porch; Rear porch; Deck; Chain link and mixed privacy fencing (fenced)
Interior
- Kitchen: Oven; Dishwasher; Refrigerator; Exhaust fan
- Bedrooms: At least one bedroom on the first floor
- Bathrooms: 1 full bathroom with tub and shower
- Heating & cooling: Electric heat; Heat pump (heating and cooling); Central air
- Interior features: Bedroom on main level; Ceiling fans; Laminate countertops
- Laundry & utility: Washer hookup; Dryer hookup; Washer; Dryer; Propane water heater
Neighborhood map
What this means for you Summary
Snapshot
- This is a 2-bed/1.0-bath manufactured listed at $200k.
Deal economics
- At list price, monthly cash flow is $119 ($1k/yr) — positive.
- The deal already cash-flows at list — no discount required.
- To meet the 1% rule (rent ≥ 1% of price), the offer needs to be $167k (16.5% below list).
- Recommended offer: $167k (16.5% below list) — sets the bar for 1% rule.
Location & tenants
- Location reads 34/100 on livability (#592 in VA) — a limited-amenity area; tenant pool skews transient or value-seeking. Strengths: crime A, cost of living A; Watch: schools F, amenities F, commute F.
- Surry County Public School District (rural): math 51% / reading 66% proficiency, ranked #63 of 131 in VA (top 48%) — acceptable for families but not a draw, mixed tenant base, ~2y average lease.
- Market conditions: 14 active listings in the ZIP; 36 units permitted in Surry County in 2024 (0 in 5+ unit buildings).
Forward outlook
- In year one you build about $19k of equity ($1k loan paydown + $17k appreciation (8.6% local appreciation)).
- Surry County population projected at -30% by 2050 — secular population decline; favor cash flow + early exit over multi-decade hold.
- At projected returns (8.6% appreciation + 3.0% rent growth), your $56k cash investment doubles in ~3 years — after that, you're playing with house money.
- By year 3, paydown + projected appreciation supports a ~$47k cash-out refi (75% LTV) — recoverable capital for the next deal without selling this one.
Negotiation context
- Only 4 days on market — expect competitive offers; lowballing is unlikely to land.
- 3 sale attempts since 24y ago with the ask held roughly flat each time — persistent listings suggest the price (not the market) is what's stuck; bring a comps-based counter.
- Current owner paid $90k; list at $200k implies a 122% gain — meaningful room to come down on a strong offer.
Risks & watch-outs
- Climate carrying-cost: major wind risk, 59% chance of damaging wind over 30y; moderate wildfire risk; extreme-heat days projected 7→16/yr by 2055 (HVAC capex compounding) — expect insurance premiums to compound above CPI over the hold.
Questions for the listing agent
- Built in 1963 — when were the roof, HVAC, electrical panel, plumbing, and water heater last replaced?
- Is there a deadline driving the sale (1031 exchange, divorce, estate, relocation)? That informs how much negotiation room exists.
- Schools are F-rated, which usually means shorter tenancies and higher turnover. Who's the typical renter profile here, and what's been the actual vacancy rate?
- What's the average days-on-market for RENTAL listings here right now (not sales)? A rising rental-DOM trend means longer vacancies and softer asking-rent achievability than the comps imply.
- What's the recent tenant-quality profile in this submarket — average credit score on applications, eviction rate, late-payment / NSF rate, and stable-employment percentage? A property-management company in the area should have these aggregated.
- How much new for-sale + rental construction is in the pipeline within 1–3 miles? Heavy new supply typically softens prices + rents 12–24 months out; constrained supply supports both.
Investment metrics
- 1% rule
- 0.83% ✗
- Cap rate
- 7.01%
- Cash-on-cash
- 2.55%
- DSCR
- 1.11
- GRM
- 10.0
CMA / ARV
No comps found within radius.
Projected returns pro-forma
8.61% appreciation · 3.0% rent growth · sell at horizon
- IRR
- 23.2%
- Equity multiple
- 2.74×
- Total profit
- $97,694
- Equity at exit
- $160,263
- IRR
- 21.0%
- Equity multiple
- 5.97×
- Total profit
- $278,258
- Equity at exit
- $326,399
Cash invested: $56,000 (down + closing). Projections, not guarantees.
Landlord ↔ Tenant lean methodology
- Overall (STATE)
- 55 Moderately Landlord-Leaning
- State Virginia
- 55 Moderately Landlord-Leaning · D+2
- County
- — inherits STATE
- City
- — inherits STATE
ZIP-level market 23881
- Home prices YoY
- 3.6%
- Active inventory
- 14
- Price-to-rent
- 10.0×
Monthly cashflow live
- Estimated rent
- $1,669 medium interval (Pro) →
- Mortgage (P&I)
- −$1,049
- Tax from tax record
- −$68 /mo · $810/yr
- Insurance
- −$83
- HOA
- −$0
- Vacancy / Maint / Mgmt
- −$351
- Net cashflow
- $119
Break-even live
UW: 25.0% down · 7.5% · 30yr · 1.5% tax · 5.0% vac · 8.0% maint · 8.0% mgmt
Financing live
Cash to close
- Down payment
- $50,000
- Closing costs
- $6,000
- Reserves months
- —
- Total cash needed
- —
Loan-product check · same deal, 3 products live
Conventional
25% down · 7.5% · 30yr
- Down + closing
- —
- Monthly P&I
- —
- Monthly cashflow
- —
- DSCR
- —
- Eligible?
- —
Personal DTI + credit; lowest rate.
DSCR
20% down · 8.5% · 30yr
- Down + closing
- —
- Monthly P&I
- —
- Monthly cashflow
- —
- DSCR
- —
- Eligible?
- —
No personal income docs; deal must DSCR.
Hard money
10% down · 12.0% · 12mo
- Down + closing
- —
- Monthly P&I
- —
- Monthly cashflow
- —
- DSCR
- —
- Eligible?
- —
Short-term bridge; refi at stabilization.
Listing history 4 events
-
2026-06-08statusdays on market $200,000 Pending 4 DOM
-
2026-06-08days on market $200,000 Active 3 DOM
-
2026-06-07remarks 386-char remark
-
2026-06-07$200,000 Active 2 DOM
ⓘ Source: listings_history table (triggers on properties + properties_extension) + one-shot
backfill from property_details.listing_events for pre-trigger history.
Tax reassessment forecast VA · Resets to sale price
- Current annual tax
- $810 · $68/mo
- Projected year-2 tax
- $1,640 · $137/mo
- Expected delta
- +$830/yr (+$69/mo · 102.4%)
ⓘ Screening estimate from a state-policy table — verify with the county assessor before closing.
Climate risk First Street
- Flood 1/10 Low FEMA zone X (unshaded) · 0% chance over 30 yrs
- Wildfire 5/10 Major
- Heat 8/10 Severe 7 d/yr ≥107°F today · 16 d/yr by 30 yrs out
- Wind 6/10 Major 59% chance of damaging wind over 30 yrs
- Air quality 2/10 Low 1 unhealthy d/yr today · 1 by 30 yrs out
Nearby sold comps map
Loading sold comps map…
Walkable amenities ~0.75 mi
Loading nearby amenities…
Taxation est. · year 1
- Rental income
- $20,029
- − Mortgage interest
- −$11,203
- − Property taxes
- −$810
- − Insurance
- −$1,000
- − Repairs & maintenance
- −$1,602
- − Management
- −$1,602
- − Depreciation
- −$5,818
- Taxable loss
- −$2,007
- Est. tax savings @ 24.0%
- +$482
- After-tax cash flow
- $1,909/yr
For passive investors: Depreciation is non-cash, so a rental often shows a tax loss while cash-flowing — sheltering income. Rental losses are passive: they offset passive income freely, and up to $25,000/yr can offset ordinary (W-2) income if you actively participate and your MAGI is under $100k (phasing out to $0 by $150k); unused losses carry forward. On sale, claimed depreciation is recaptured at up to 25%, and gains may owe capital-gains tax (a 1031 exchange can defer both). Figures are a year-1 estimate at your 24.0% rate — not tax advice; consult a CPA.
Schools (NCES district)
- District
- Surry County Public School District
- NCES district ID
- 5103750
- Math proficiency
- 51% ▼ -31.00%
- Reading proficiency
- 66% ▼ -12.00%
- Median HH income
- $52,452
- Composite
- 50.01/100
- National rank
- #1922
- State rank
- #63 of 131 in VA
Livability — Claremont
- Score
- 34/100
- State rank
- #592
- US rank
- #27750
Category grades
Schools grade is shown separately in the Schools card above.
Census & demographics
- City population
- 360
- Population (ZIP)
- 2,330
Population outlook (Surry County) Hauer SSP2
- Today (2025)
- 6,084 people
- By 2030
- 5,726 · -5.9%
- By 2040
- 4,961 · -18.5%
- By 2050
- 4,228 · -30.5%
- By 2075
- 3,298 · -45.8%
- By 2100
- 2,762 · -54.6%
Race, ethnicity, and origin ACS 2023
- Neighborhood character
- Majority White (57%)
- Race & ethnicity
- White 57% Black 41% Hispanic / Latino 2%
- Common ancestry
- Slovak 1%
- Foreign-born
- 1%
- Languages at home
- 97% English-only · Spanish 2% Other Asian/Pacific 1%
Political lean MEDSL · Surry
- 2024 margin
- Toss-up / Even · D 49.1% · R 49.8% · Other 1.1%
- 2008→2024 swing
- -22.9pp toward R · 2008: 22.3pp · 2024: -0.7pp
- All cycles
- 2024: R+0.7 2020: D+8.3 2016: D+7.2 2012: D+21.0 2008: D+22.3
Not yet ingested
- Civics
- —
Market trends
- HPI YoY
- ▲ 8.61%
- Current HPI
- 244.1863
- Rent YoY
- —
- Metro
- —
- State GDP YoY
- ▲ 2.40%
- F500 in state
- 50
Industry mix (Fortune 500 HQ in VA)
| Industry | F500 HQs | Revenue |
|---|---|---|
| Aerospace / Defense | 4 | $236B |
|
||
| Technology / Defense | 3 | $32B |
|
||
| Financial Services | 2 | $176B |
|
||
| Utilities | 2 | $27B |
|
||
| Insurance | 2 | $25B |
|
||
| Technology | 2 | $15B |
|
||
Price history
+1150.0% since first listed6 events — show timeline
- 2026-06-04 Listed $200,000 CVRMLS
- 2017-12-18 Sold (Public Records) $89,900 Public Records
- 2017-12-15 Sold (MLS) $89,900 CVRMLS
- 2017-08-16 Listed $89,900 CVRMLS
- 2002-07-26 Sold (MLS) $4,000 WMLS
- 2002-03-11 Listed $16,000 WMLS
Property tax history
+4.4%/yrLatest (2025): $810 · +23.9% YoY. Source: county tax records.
Cash-flow waterfall
monthlySold comps — $/sqft
last 12 mo · ≤1 miLoading sold comps…