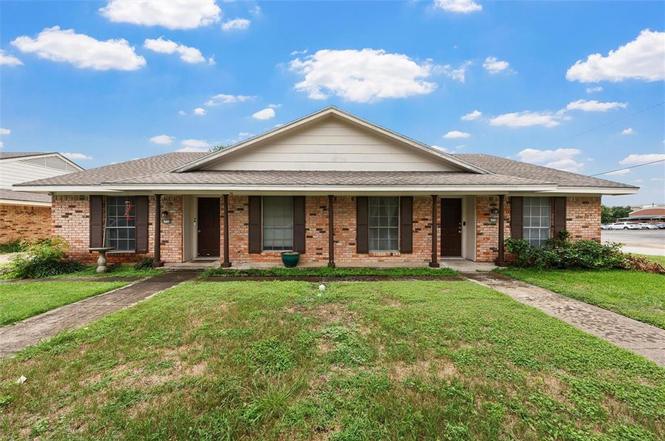
 Duplex
6716 Wiethorn Dr #6718 · Waco, TX
Flood risk 1/10 · Minimal
- FEMA flood zone
- X (unshaded)
- Chance of flooding over 30 yrs
- 0.0%
- Est. flood insurance / yr
- $507 – $1,088
Fire risk 4/10 · Minor
- Est. fire insurance / yr
- $1,222 – $2,270
Heat risk 7/10 · Major
- Hot days now (above 108°F)
- 7 days/yr
- Hot days in 30 yrs
- 25 days/yr
Wind risk 6/10 · Moderate
- Chance of severe wind over 30 yrs
- 56.0%
Air-quality risk 2/10 · Minimal
- Unhealthy air days now
- 0 days/yr
- Unhealthy air days in 30 yrs
- 1 days/yr
Risk factors via First Street. Map © Google.
Why this score? — see what drove the D grade
The composite is a weighted blend of 9 inputs, each scored 0–100. Each bar is that input's sub-score; the figure is the points it added to the 100-point composite (weight × sub-score).
- Cash flow +11.8/30.0
- ARV discount +7.5/15.0
- Schools +5.2/10.0
- 1% rule +4.1/10.0
- Livability +3.7/5.0
- DSCR +3.5/10.0
- Rent growth +3.1/5.0
- Condition / age +2.5/5.0
- Appreciation +0.0/10.0
$300,000
🖨 Deal sheet 📄 Offer letter ✓ Due diligence
Multi-family units
County records classify this as Multi-Family (2-4 Unit). Listing-text estimate: 2 units. confirmed
Listing remarks
Investment Opportunity in the Heart of Waco! This well-maintained duplex at 6716-18 Wiethorn offers two fully leased 2 bed, 2 bath units in the desirable Western Hills neighborhood. Both units feature spacious living areas, in-unit laundry, private backyards, and off-street parking. Enjoy immediate rental income in a prime, convenient location—perfect for expanding your investment portfolio!
Key facts
- In-unit laundry
- Off-street parking
- Private backyards
Tags
Property features AI
Finance
- Financial info: Property offered as residential income with 2 total units; 100% occupancy; Gross annual income reported: $14,700; Net operating income reported: $14,700; Operating expenses may include maintenance and professional management; Cap rate: 4.90%; Acceptable financing: Cash or Conventional
- HOA & community: No association
Exterior
- Parking: 4 parking spaces; Attached carport; Detached carport; Driveway
- Utilities: City water service; City sewer service; Electricity connected
- Home design: Duplex (residential income property); Single-story; Built in 1971
- Construction: Brick and siding exterior; Composition roof; Slab foundation
- Exterior features: Asphalt on property (drive surfaces); City water; City sewer; Electricity connected
Interior
- Kitchen: Dishwasher; Electric range; Refrigerator; Vented exhaust fan
- Bedrooms: 4 bedrooms
- Flooring: Carpet; Tile; Vinyl
- Bathrooms: 4 full bathrooms
- Heating & cooling: Central heating (electric); Central air; Ceiling fans
- Interior features: Eat-in kitchen; One-level layout
Neighborhood map
What this means for you Summary
Snapshot
- This is a 2 × 2-bed/2.0-bath units multifamily listed at $300k.
Deal economics
- At list price, monthly cash flow is $-83 ($-991/yr) — negative. Per door: $-41/mo.
- To cash-flow at today's rent, offer at most $285k (4.9% below list).
- To meet the 1% rule (rent ≥ 1% of price), the offer needs to be $272k (9.5% below list).
- Recommended offer: $272k (9.5% below list) — sets the bar for 1% rule.
- Cap rate 6.0% vs local median 3.9% in Waco — top-decile yield for the area; either an underpriced asset or a hidden risk that comps aren't pricing in. Stress-test before assuming the spread holds.
Location & tenants
- Location reads 74/100 on livability (#166 in TX, #4,378 nationally) — a middle-class / working-renter tenant base. Strengths: cost of living A+, housing A+, health & safety A+; Watch: crime D, commute F, employment D-.
- Midway ISD (other): math 61% / reading 58% proficiency, ranked #56 of 826 in TX (top 7%) — acceptable for families but not a draw, mixed tenant base, ~2y average lease.
- Zoned schools: Chapel Park El (463 students, 40% FRL).
- Market conditions: Rents rising (+2.4%/yr); 186 active listings in the ZIP; 3 comparable units currently listed for rent nearby; rentals lingering (median 44d on market — plan ~5-8 weeks vacancy on turnover, expect pricing pressure); 67% of comp listings sitting > 30 days — soft ceiling on asking rent; 1,014 units permitted in McLennan County in 2024 (200 in 5+ unit buildings).
- At $2,716/mo this rent would consume 56% of the median local household income ($58k/yr) (locally 1202% of renters already pay >50% of income on rent) — very limited rent-growth headroom before tenants either downsize or default.
Forward outlook
- Local home prices are declining (-3.0%/yr); year-one equity from $2k of loan paydown is wiped out by about $9k of value loss. Plan a longer hold.
- McLennan County population projected at +17% by 2050 — long-run rental-demand tailwind backs the buy-and-hold thesis.
Negotiation context
- It's been on market 108 days — a 9% lower offer ($273k) is reasonable based on typical stale-listing flexibility.
- 3 sale attempts with the ask held roughly flat each time — persistent listings suggest the price (not the market) is what's stuck; bring a comps-based counter.
Risks & watch-outs
- Climate carrying-cost: major wind risk, 56% chance of damaging wind over 30y; extreme-heat days projected 7→25/yr by 2055 (HVAC capex compounding) — expect insurance premiums to compound above CPI over the hold.
Questions for the listing agent
- What do current leases actually rent for vs. the listed asking? Can we see a recent rent roll and the last 12 months of T-12 income?
- It's been on market 108 days. Have you received any prior offers? Is the seller open to a 9% concession, seller financing, or rate buy-down credit?
- Can we see the unit-by-unit rent roll, current vacancy, and any below-market leases? What's the average tenancy length?
- What capital expenditures (roof, boiler, parking lot, exteriors) have been made in the last 5 years, and what's planned in the next 2?
- Built in 1971 — when were the roof, HVAC, electrical panel, plumbing, and water heater last replaced?
- Why hasn't it sold? Are there any deal-killer items the seller is aware of (foundation, flood, title, zoning, code violations)?
- Is there a deadline driving the sale (1031 exchange, divorce, estate, relocation)? That informs how much negotiation room exists.
- Schools are D-rated, which usually means shorter tenancies and higher turnover. Who's the typical renter profile here, and what's been the actual vacancy rate?
- Crime grade is D in this area — have there been break-ins, vandalism, or insurance claims at this property in the last 3 years? What carrier currently insures it and at what premium?
- The area grade is low — what's the realistic commute time and amenity access for the typical tenant pool here? Any planned neighborhood developments (good or bad) we should know about?
- What's the average days-on-market for RENTAL listings here right now (not sales)? A rising rental-DOM trend means longer vacancies and softer asking-rent achievability than the comps imply.
- What's the recent tenant-quality profile in this submarket — average credit score on applications, eviction rate, late-payment / NSF rate, and stable-employment percentage? A property-management company in the area should have these aggregated.
- How much new apartment / multifamily construction is in the pipeline within 1–3 miles? Heavy new supply (>2% of stock underway) typically softens rents 12–24 months out; light construction supports rent growth.
Investment metrics
- 1% rule
- 0.91% ✗
- Cap rate
- 5.96%
- Cash-on-cash
- -1.18%
- DSCR
- 0.95
- GRM
- 9.2
CMA / ARV
No comps found within radius.
Projected returns pro-forma
-3.0% appreciation · 2.41% rent growth · sell at horizon
- IRR
- -18.9%
- Equity multiple
- 0.34×
- Total profit
- $-55,337
- Equity at exit
- $44,731
- IRR
- -12.6%
- Equity multiple
- 0.27×
- Total profit
- $-60,903
- Equity at exit
- $25,939
Cash invested: $84,000 (down + closing). Projections, not guarantees.
Landlord ↔ Tenant lean methodology
- Overall (STATE)
- 87 Strongly Landlord-Friendly
- State Texas
- 87 Strongly Landlord-Friendly · R+5
- County
- — inherits STATE
- City
- — inherits STATE
ZIP-level market 76710
- Rents YoY
- 2.4%
- Active inventory
- 186
- Price-to-rent
- 18.4×
Monthly cashflow live
- Estimated rent
- $2,716 high interval (Pro) →
- Mortgage (P&I)
- −$1,573
- Tax from tax record
- −$530 /mo · $6,359/yr
- Insurance
- −$125
- HOA
- −$0
- Vacancy / Maint / Mgmt
- −$570
- Net cashflow
- $-83
Break-even live
2-unit breakdown (identical units grouped — click to expand)
| Units | Beds | Baths | Est. rent |
|---|---|---|---|
| 2× units | 2 | 2 | $2,716 |
| #1 | 2 | 2 | $1,358 |
| #2 | 2 | 2 | $1,358 |
| Total (2 units) | $2,716 | ||
UW: 25.0% down · 7.5% · 30yr · 1.5% tax · 5.0% vac · 8.0% maint · 8.0% mgmt
Financing live
Cash to close
- Down payment
- $75,000
- Closing costs
- $9,000
- Reserves months
- —
- Total cash needed
- —
Loan-product check · same deal, 3 products live
Conventional
25% down · 7.5% · 30yr
- Down + closing
- —
- Monthly P&I
- —
- Monthly cashflow
- —
- DSCR
- —
- Eligible?
- —
Personal DTI + credit; lowest rate.
DSCR
20% down · 8.5% · 30yr
- Down + closing
- —
- Monthly P&I
- —
- Monthly cashflow
- —
- DSCR
- —
- Eligible?
- —
No personal income docs; deal must DSCR.
Hard money
10% down · 12.0% · 12mo
- Down + closing
- —
- Monthly P&I
- —
- Monthly cashflow
- —
- DSCR
- —
- Eligible?
- —
Short-term bridge; refi at stabilization.
Rent comps 3 comps
| Address | Beds | Baths | Sqft | Rent | $/sqft | DOM | Units | Dist |
|---|---|---|---|---|---|---|---|---|
| 6807 Alford Dr Waco, TX | 3.0 | 2.5 | 1800 | $1,495 | $0.83 | 43d | 1 | 0.30mi |
| 701 Topeka Dr Woodway, TX | 3.0 | 2.0 | 1781 | $2,300 | $1.29 | 13d | 1 | 0.72mi |
| 1125 Wedgewood Dr Woodway, TX | 4.0 | 2.0 | 2246 | $2,195 | $0.98 | 43d | 1 | 1.15mi |
Listing history 8 events
-
2026-06-08status $300,000 Pending 108 DOM
-
2026-06-08days on market $300,000 Active Option Contract 108 DOM
-
2026-06-07days on market $300,000 Active Option Contract 107 DOM
-
2026-06-03days on market $300,000 Active Option Contract 104 DOM
-
2026-06-02days on market $300,000 Active Option Contract 103 DOM
-
2026-06-01days on market $300,000 Active Option Contract 102 DOM
-
2026-05-31remarks 394-char remark
-
2026-05-31$300,000 Active Option Contract 101 DOM
ⓘ Source: listings_history table (triggers on properties + properties_extension) + one-shot
backfill from property_details.listing_events for pre-trigger history.
Tax reassessment forecast TX · Resets to sale price
- Current annual tax
- $6,359 · $530/mo
- Projected year-2 tax
- $6,359 · $530/mo
- Expected delta
- $0/yr ($0/mo · 0.0%)
ⓘ Screening estimate from a state-policy table — verify with the county assessor before closing.
Climate risk First Street
- Flood 1/10 Low FEMA zone X (unshaded) · 0% chance over 30 yrs
- Wildfire 4/10 Moderate
- Heat 7/10 Severe 7 d/yr ≥108°F today · 25 d/yr by 30 yrs out
- Wind 6/10 Major 56% chance of damaging wind over 30 yrs
- Air quality 2/10 Low 0 unhealthy d/yr today · 1 by 30 yrs out
Nearby sold comps map
Loading sold comps map…
Walkable amenities ~0.75 mi
Loading nearby amenities…
Taxation est. · year 1
- Rental income
- $32,592
- − Mortgage interest
- −$16,805
- − Property taxes
- −$6,359
- − Insurance
- −$1,500
- − Repairs & maintenance
- −$2,607
- − Management
- −$2,607
- − Depreciation
- −$8,727
- Taxable loss
- −$6,014
- Est. tax savings @ 24.0%
- +$1,443
- After-tax cash flow
- $453/yr
For passive investors: Depreciation is non-cash, so a rental often shows a tax loss while cash-flowing — sheltering income. Rental losses are passive: they offset passive income freely, and up to $25,000/yr can offset ordinary (W-2) income if you actively participate and your MAGI is under $100k (phasing out to $0 by $150k); unused losses carry forward. On sale, claimed depreciation is recaptured at up to 25%, and gains may owe capital-gains tax (a 1031 exchange can defer both). Figures are a year-1 estimate at your 24.0% rate — not tax advice; consult a CPA.
Schools (NCES district)
- District
- Midway ISD
- NCES district ID
- 4830640
- Math proficiency
- 61% ▼ -8.00%
- Reading proficiency
- 58% ▼ -7.00%
- Median HH income
- $67,076
- Composite
- 52.32/100
- National rank
- #1593
- State rank
- #56 of 826 in TX
Livability — Waco
- Score
- 74/100
- State rank
- #166
- US rank
- #4378
Category grades
Schools grade is shown separately in the Schools card above.
Census & demographics
- Census place
- Waco, TX
- County
- McLennan County · 213,088 people
- City population
- 125,319
- Metro
- Waco, TX
- Population (ZIP)
- 23,329
- Household income
- $58,186
- Rent vs Own
- Severe rent burden
- 1202.0
Population outlook (McLennan County) Hauer SSP2
- Today (2025)
- 264,191 people
- By 2030
- 273,578 · +3.6%
- By 2040
- 291,506 · +10.3%
- By 2050
- 308,044 · +16.6%
- By 2075
- 349,648 · +32.3%
- By 2100
- 364,779 · +38.1%
Race, ethnicity, and origin ACS 2023
- Neighborhood character
- Diverse neighborhood (Simpson 0.60)
- Race & ethnicity
- White 55% Hispanic / Latino 26% Two or more races 19% Black 15%
- Hispanic origin (detail)
- Mexican 21% Puerto Rican 2%
- Common ancestry
- Slovak 3% Lithuanian 2% Romanian 2%
- Foreign-born
- 5% · Canada, China
- Languages at home
- 84% English-only · Spanish 14% German/W. Germanic 1%
Political lean MEDSL · McLennan
- 2024 margin
- Solid R (+30.9) · D 34.0% · R 64.9% · Other 1.0%
- 2008→2024 swing
- -7.0pp toward R · 2008: -23.9pp · 2024: -30.9pp
- All cycles
- 2024: R+30.9 2020: R+23.4 2016: R+27.1 2012: R+29.8 2008: R+23.9
Not yet ingested
- Civics
- —
Market trends
- HPI YoY
- ▼ -147.65%
- Current HPI
- 227.2988
- Rent YoY
- ▲ 2.41%
- Metro
- Waco, TX
- State GDP YoY
- ▲ 3.95%
- F500 in state
- 110
Industry mix (Fortune 500 HQ in TX)
| Industry | F500 HQs | Revenue |
|---|---|---|
| Energy | 16 | $1,198B |
|
||
| Technology | 5 | $198B |
|
||
| Engineering / Construction | 4 | $72B |
|
||
| Energy Services | 3 | $60B |
|
||
| Utilities | 3 | $41B |
|
||
| Healthcare | 2 | $330B |
|
||
Price history
+0.0% since first listed6 events — show timeline
- 2026-05-21 Contingent — NTREIS
- 2026-02-19 Listed $300,000 NTREIS
- 2025-12-27 Listing Removed — NTREIS
- 2025-07-28 Relisted — NTREIS
- 2025-07-25 Pending — NTREIS
- 2025-06-26 Listed $300,000 NTREIS
Property tax history
+5.3%/yrLatest (2025): $6,359 · +16.6% YoY. Source: county tax records.
Cash-flow waterfall
monthlySold comps — $/sqft
last 12 mo · ≤1 miLoading sold comps…