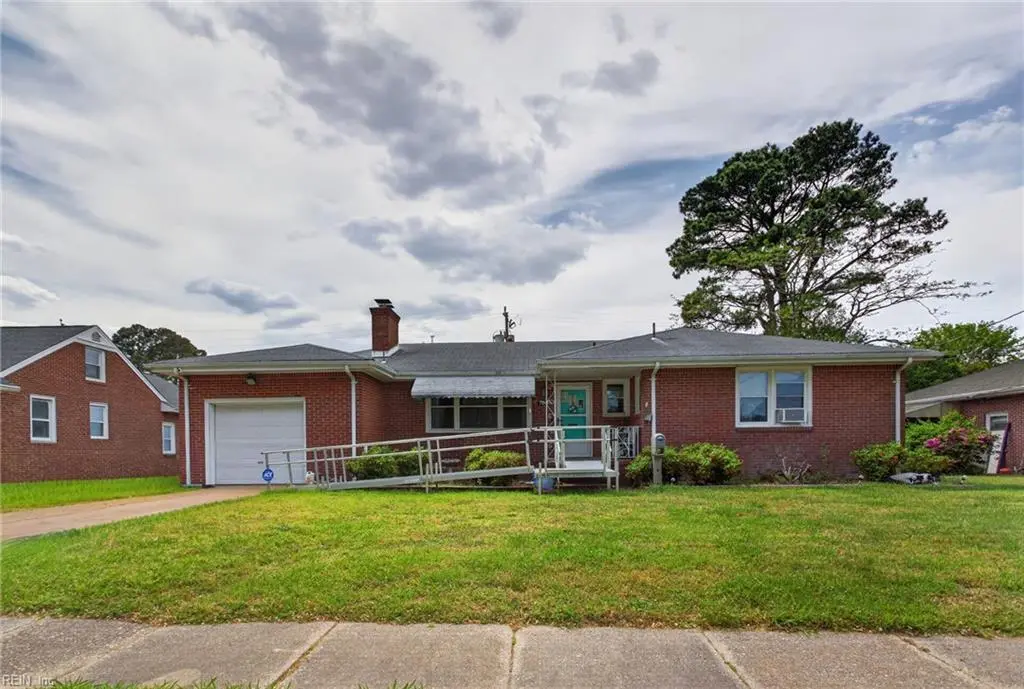
7845 Tarpon Pl · Norfolk, VA
Flood risk 4/10 · Minor
- FEMA flood zone
- X (unshaded)
- Chance of flooding over 30 yrs
- 0.13%
- Est. flood insurance / yr
- $507 – $1,088
Fire risk 1/10 · Minimal
- Est. fire insurance / yr
- $666 – $1,236
Heat risk 9/10 · Severe
- Hot days now (above 104°F)
- 7 days/yr
- Hot days in 30 yrs
- 17 days/yr
Wind risk 8/10 · Major
- Chance of severe wind over 30 yrs
- 80.0%
Air-quality risk 3/10 · Minor
- Unhealthy air days now
- 2 days/yr
- Unhealthy air days in 30 yrs
- 3 days/yr
Risk factors via First Street. Map © Google.
Why this score? — see what drove the D+ grade
The composite is a weighted blend of 9 inputs, each scored 0–100. Each bar is that input's sub-score; the figure is the points it added to the 100-point composite (weight × sub-score).
- Cash flow +13.2/30.0
- ARV discount +11.9/15.0
- Livability +4.2/5.0
- DSCR +4.0/10.0
- Schools +3.5/10.0
- 1% rule +3.3/10.0
- Rent growth +3.3/5.0
- Condition / age +2.5/5.0
- Appreciation +0.0/10.0
$290,000
🖨 Deal sheet 📄 Offer letter ✓ Due diligence
Listing remarks
Come check out this 3 bed ranch with garage in desirable Camelia Acres neigborhood in Norfolk. Great layout with large den and primary bedroom. Located near military bases, restaurants, shopping and bay. Priced to sell. Lowest home listed in the neighborhood. Home in good shape overall. Some instant sweat equity in this one or do a few updates if you'd like or move right in and do them over time. Home sold as is where is. Kitchen was updated more than 5 years ago and electrical system too. Come check it out before it's gone.
Key facts
- 8,712 sq ft lot
- Garage
- Built 1957
Property features AI
Finance
- HOA & community: No HOA fees reported
Exterior
- Parking: Attached 1-car garage; Additional multi-car parking; Off-street parking; Driveway parking
- Utilities: City/County water; City/County sewer; Electric water heater
- Home design: Detached ranch-style home; Single-story
- Construction: Brick siding; Asphalt shingle roof; Slab foundation; Storm doors
- Exterior features: Deck; Back yard with chain-link fence; Storage shed
Interior
- Kitchen: Dishwasher; Electric range; Refrigerator
- Bedrooms: First-floor master bedroom; Bedroom and full bathroom on first floor
- Flooring: Ceramic flooring; Wood flooring
- Bathrooms: 1 full bathroom; 1 half bathroom
- Heating & cooling: Natural gas heating; Central air conditioning
- Interior features: Fireplace (wood-burning); Ceiling fan; Cable hookup; Scuttle access
- Laundry & utility: Electric water heater
Neighborhood map
What this means for you Summary
Snapshot
- This is a 3-bed/1.5-bath single-family listed at $290k.
Deal economics
- At list price, monthly cash flow is $-4 ($-52/yr) — negative.
- To cash-flow at today's rent, offer at most $289k (0.3% below list).
- To meet the 1% rule (rent ≥ 1% of price), the offer needs to be $240k (17.4% below list).
- Recommended offer: $240k (17.4% below list) — sets the bar for 1% rule.
- Cap rate 6.3% vs local median 4.0% in Norfolk — top-decile yield for the area; either an underpriced asset or a hidden risk that comps aren't pricing in. Stress-test before assuming the spread holds.
Location & tenants
- Location reads 83/100 on livability (#43 in VA, #1,026 nationally) — a professional / high-income tenant draw. Strengths: amenities A+, commute A+, health & safety A+; Watch: employment C-, crime F.
- Norfolk City Public School District (urban): math 27% / reading 56% proficiency, ranked #118 of 131 in VA (top 90%) — families likely to look elsewhere, expect single-tenant / working-renter base with shorter leases.
- Zoned schools: Little Creek Elementary (math 20% / reading 49%, grade F, #966 of 1,108 statewide, top 89%, 631 students, 97% FRL); Lake Taylor High (math 38% / reading 72%, grade C, #279 of 319 statewide, top 88%, 1,030 students, 92% FRL) — zoned schools average 95% FRL vs 59% district-wide (36 pts higher); higher-poverty schools than district average — tighter screening recommended.
- Market conditions: Rents rising (+3.1%/yr); 206 active listings in the ZIP; 30 comparable units currently listed for rent nearby; rentals at typical pace (median 21d on market — plan ~3-4 weeks tenant-placement turnaround); 40% of comp listings sitting > 30 days — soft ceiling on asking rent; solid renter incomes; 438 units permitted in Norfolk city in 2024 (273 in 5+ unit buildings).
- This rent runs 37% of the median local income ($78k/yr) — at the standard rent-burdened threshold; future hikes will face affordability resistance.
Forward outlook
- Local home prices are declining (-3.0%/yr); year-one equity from $2k of loan paydown is wiped out by about $9k of value loss. Plan a longer hold.
Negotiation context
- Only 9 days on market — expect competitive offers; lowballing is unlikely to land.
Risks & watch-outs
- Watch-outs: built in 1957 — expect roof / HVAC / electrical / plumbing capex.
- Climate carrying-cost: severe wind risk, 80% chance of damaging wind over 30y; extreme-heat days projected 7→17/yr by 2055 (HVAC capex compounding) — expect insurance premiums to compound above CPI over the hold.
Questions for the listing agent
- What do current leases actually rent for vs. the listed asking? Can we see a recent rent roll and the last 12 months of T-12 income?
- Built in 1957 — when were the roof, HVAC, electrical panel, plumbing, and water heater last replaced?
- Is there a deadline driving the sale (1031 exchange, divorce, estate, relocation)? That informs how much negotiation room exists.
- Schools are A-rated — typically a magnet for longer-tenancy family renters. What's the average tenant stay here, and is there a school-zone premium baked into asking?
- Crime grade is F in this area — have there been break-ins, vandalism, or insurance claims at this property in the last 3 years? What carrier currently insures it and at what premium?
- The area grade is low — what's the realistic commute time and amenity access for the typical tenant pool here? Any planned neighborhood developments (good or bad) we should know about?
- What's the average days-on-market for RENTAL listings here right now (not sales)? A rising rental-DOM trend means longer vacancies and softer asking-rent achievability than the comps imply.
- What's the recent tenant-quality profile in this submarket — average credit score on applications, eviction rate, late-payment / NSF rate, and stable-employment percentage? A property-management company in the area should have these aggregated.
- How much new for-sale + rental construction is in the pipeline within 1–3 miles? Heavy new supply typically softens prices + rents 12–24 months out; constrained supply supports both.
Investment metrics
- 1% rule
- 0.83% ✗
- Cap rate
- 6.27%
- Cash-on-cash
- -0.06%
- DSCR
- 1.00
- GRM
- 10.1
CMA / ARV
- ARV (on-the-fly)
- $321,664
- Comps found
- 12
Show comp detail 12 sales within ~0.75 mi
| Address | Dist | Beds/Ba | Sqft | Sold | Price | $/sf | Match |
|---|---|---|---|---|---|---|---|
| 2430 Tullibee Dr | 0.34mi | 3/1.5 | 1,463 (+2%) | 2mo | $327,000 | $224 | 79 |
| 2538 Heutte Dr | 0.21mi | 4/2.0 (+1) | 1,500 (+4%) | 1mo | $387,500 | $258 | 75 |
| 2904 Dominion Ave | 0.34mi | 3/1.0 | 1,378 (-4%) | 2mo | $342,500 | $249 | 74 |
| 8220 Jolima Ave | 0.49mi | 3/1.0 | 1,472 (+2%) | 4mo | $310,000 | $211 | 68 |
| 7616 Azalea Garden Rd | 0.37mi | 3/1.0 | 1,526 (+6%) | 4mo | $342,000 | $224 | 67 |
| 2324 Calvin Ave | 0.46mi | 4/1.5 (+1) | 1,380 (-4%) | 2mo | $285,000 | $207 | 66 |
| 2934 E Little Creek Rd | 0.32mi | 3/2.0 | 1,577 (+10%) | 2mo | $345,000 | $219 | 66 |
| 8309 Nathan Ave | 0.58mi | 3/1.0 | 1,513 (+5%) | 4mo | $280,000 | $185 | 59 |
| 7822 Camellia Rd | 0.46mi | 3/— | 1,272 (-11%) | 4mo | $130,000 | $102 | 56 |
| 8320 Mona Ave | 0.44mi | 4/2.0 (+1) | 1,582 (+10%) | 1mo | $430,000 | $272 | 55 |
| 7917 Walters Dr | 0.41mi | 3/2.0 | 1,646 (+15%) | 4mo | $384,000 | $233 | 51 |
| 3332 Ridgefield Ct | 0.63mi | 4/2.0 (+1) | 1,566 (+9%) | 0mo | $360,000 | $230 | 48 |
Match score weights: distance 35% · size 25% · config 20% · recency 20%. Top-matched comps best support the ARV.
Projected returns pro-forma
-3.0% appreciation · 3.07% rent growth · sell at horizon
- IRR
- -16.4%
- Equity multiple
- 0.42×
- Total profit
- $-47,131
- Equity at exit
- $43,240
- IRR
- -8.0%
- Equity multiple
- 0.50×
- Total profit
- $-40,825
- Equity at exit
- $25,074
Cash invested: $81,200 (down + closing). Projections, not guarantees.
Landlord ↔ Tenant lean methodology
- Overall (STATE)
- 55 Moderately Landlord-Leaning
- State Virginia
- 55 Moderately Landlord-Leaning · D+2
- County
- — inherits STATE
- City
- — inherits STATE
ZIP-level market 23518
- Home prices YoY
- -16.9%
- Rents YoY
- 3.1%
- Active inventory
- 206
- Price-to-rent
- 10.1×
Monthly cashflow live
- Estimated rent
- $2,395 high interval (Pro) →
- Mortgage (P&I)
- −$1,521
- Tax from tax record
- −$255 /mo · $3,061/yr
- Insurance
- −$121
- HOA
- −$0
- Vacancy / Maint / Mgmt
- −$503
- Net cashflow
- $-4
Break-even live
UW: 25.0% down · 7.5% · 30yr · 1.5% tax · 5.0% vac · 8.0% maint · 8.0% mgmt
Financing live
Cash to close
- Down payment
- $72,500
- Closing costs
- $8,700
- Reserves months
- —
- Total cash needed
- —
Loan-product check · same deal, 3 products live
Conventional
25% down · 7.5% · 30yr
- Down + closing
- —
- Monthly P&I
- —
- Monthly cashflow
- —
- DSCR
- —
- Eligible?
- —
Personal DTI + credit; lowest rate.
DSCR
20% down · 8.5% · 30yr
- Down + closing
- —
- Monthly P&I
- —
- Monthly cashflow
- —
- DSCR
- —
- Eligible?
- —
No personal income docs; deal must DSCR.
Hard money
10% down · 12.0% · 12mo
- Down + closing
- —
- Monthly P&I
- —
- Monthly cashflow
- —
- DSCR
- —
- Eligible?
- —
Short-term bridge; refi at stabilization.
Rent comps 30 comps
| Address | Beds | Baths | Sqft | Rent | $/sqft | DOM | Units | Dist |
|---|---|---|---|---|---|---|---|---|
| 2750 Heutte Dr Norfolk, VA | 3.0 | 2.0 | 1628 | $2,150 | $1.32 | 21d | 1 | 0.26mi |
| 7710 Nancy Dr Norfolk, VA | 3.0 | 1.5 | 1644 | $2,000 | $1.22 | 43d | 1 | 0.29mi |
| 8212 Mona Ave Norfolk, VA | 4.0 | 2.0 | 1600 | $2,895 | $1.81 | 20d | 1 | 0.37mi |
| 1859 Branchwood St Unit 1492775P Norfolk, VA | 3.0 | 2.0 | 1367 | $3,800 | $2.78 | 14d | 1 | 0.77mi |
| 3857 Flowerfield Rd Norfolk, VA | 1.0–3.0 | 1.0–1.5 | 931 | $1,790 | $1.92 | 2d | 17 | 0.77mi |
| 1831 Banning Rd Norfolk, VA | 3.0 | 2.0 | 1853 | $2,500 | $1.35 | 4d | 1 | 0.82mi |
| 2217 Helsley Ave Norfolk, VA | 3.0 | 2.0 | 1039 | $2,200 | $2.12 | 3d | 1 | 0.88mi |
| 8516 Halprin Dr Norfolk, VA | 3.0 | 1.0 | 1086 | $2,395 | $2.21 | 7d | 1 | 0.90mi |
| 4086 Lighthouse Cv Norfolk, VA | 2.0 | 2.5 | 1550 | $2,600 | $1.68 | 43d | 1 | 0.91mi |
| 4090 Lighthouse Cv Norfolk, VA | 3.0 | 2.5 | 1550 | $2,200 | $1.42 | 23d | 1 | 0.92mi |
| 4090 Lighthouse Cv Norfolk, VA | 3.0 | 2.5 | 1550 | $2,250 | $1.45 | 43d | 1 | 0.92mi |
| 2204 Helsley Ave Norfolk, VA | 3.0 | 1.0 | 1039 | $2,000 | $1.92 | 44d | 1 | 0.93mi |
| 4138 Seafarer Ave Norfolk, VA | 2.0 | 2.0 | 1175 | $1,995 | $1.70 | 2d | 1 | 0.96mi |
| 4138 Seafarer Ave Unit 1 Norfolk, VA | 2.0 | 2.0 | 1175 | $1,995 | $1.70 | 3d | 1 | 0.97mi |
| 4319 Pinter Ln Unit 1 Norfolk, VA | 4.0 | 3.5 | 1833 | $2,600 | $1.42 | 43d | 1 | 1.08mi |
| 9512 18th Bay St Unit B Norfolk, VA | 3.0 | 1.0 | 952 | $2,650 | $2.78 | 43d | 1 | 1.12mi |
| 9563 15th Bay St Unit 4 Norfolk, VA | 3.0 | 2.0 | 1100 | $1,695 | $1.54 | 43d | 1 | 1.14mi |
| 7906 Turner Rd Norfolk, VA | 3.0 | 1.5 | 1400 | $1,925 | $1.38 | 43d | 1 | 1.14mi |
| 6419 Grimes Ave Norfolk, VA | 3.0 | 2.0 | 1225 | $2,150 | $1.76 | 43d | 1 | 1.16mi |
| 9617 11th Bay St Unit 2 Norfolk, VA | 2.0 | 2.0 | 1200 | $1,400 | $1.17 | 43d | 1 | 1.19mi |
| 2221 Pretty Lake Ave Norfolk, VA | 3.0 | 2.0 | 1800 | $2,640 | $1.47 | 1d | 2 | 1.29mi |
| 2111 Pretty Lake Ave Norfolk, VA | 2.0 | 2.0 | 950 | $1,730 | $1.82 | 2d | 1 | 1.32mi |
| 9615 21st Bay St Norfolk, VA | 2.0 | 2.5 | 1500 | $2,995 | $2.00 | 7d | 1 | 1.35mi |
| 9631 21st Bay St Norfolk, VA | 2.0 | 2.5 | 1500 | $2,995 | $2.00 | 16d | 1 | 1.37mi |
| 9614 21st Bay St Norfolk, VA | 2.0 | 2.5 | 1566 | $3,100 | $1.98 | 2d | 1 | 1.39mi |
| 9565 23rd Bay St Norfolk, VA | 2.0 | 2.0 | 1420 | $3,300 | $2.32 | 17d | 1 | 1.39mi |
| 4500 Pretty Lake Ave Unit B2 Norfolk, VA | 2.0 | 2.0 | 1360 | $2,550 | $1.88 | 4d | 1 | 1.41mi |
| 6450 Crescent Way Norfolk, VA | 1.0–3.0 | 1.0–2.0 | 1128 | $2,369 | $2.10 | 2d | 23 | 1.45mi |
| 6975 Bonnot Dr Norfolk, VA | 3.0 | 1.5 | 1188 | $1,700 | $1.43 | 43d | 1 | 1.46mi |
| 2100 E Ocean View Ave Norfolk, VA | 3.0 | 3.0 | 1836 | $2,295 | $1.25 | 43d | 1 | 1.46mi |
Listing history 2 events
-
2026-04-29status Under Contract
-
2026-04-20$290,000 Active
ⓘ Source: listings_history table (triggers on properties + properties_extension) + one-shot
backfill from property_details.listing_events for pre-trigger history.
Tax reassessment forecast VA · Resets to sale price
- Current annual tax
- $3,061 · $255/mo
- Projected year-2 tax
- $3,061 · $255/mo
- Expected delta
- $0/yr ($0/mo · 0.0%)
ⓘ Screening estimate from a state-policy table — verify with the county assessor before closing.
Climate risk First Street
- Flood 4/10 Moderate FEMA zone X (unshaded) · 13% chance over 30 yrs
- Wildfire 1/10 Low
- Heat 9/10 Extreme 7 d/yr ≥104°F today · 17 d/yr by 30 yrs out
- Wind 8/10 Severe 80% chance of damaging wind over 30 yrs
- Air quality 3/10 Moderate 2 unhealthy d/yr today · 3 by 30 yrs out
Nearby sold comps map
Loading sold comps map…
Walkable amenities ~0.75 mi
Loading nearby amenities…
Taxation est. · year 1
- Rental income
- $28,745
- − Mortgage interest
- −$16,245
- − Property taxes
- −$3,061
- − Insurance
- −$1,450
- − Repairs & maintenance
- −$2,300
- − Management
- −$2,300
- − Depreciation
- −$8,436
- Taxable loss
- −$5,046
- Est. tax savings @ 24.0%
- +$1,211
- After-tax cash flow
- $1,159/yr
For passive investors: Depreciation is non-cash, so a rental often shows a tax loss while cash-flowing — sheltering income. Rental losses are passive: they offset passive income freely, and up to $25,000/yr can offset ordinary (W-2) income if you actively participate and your MAGI is under $100k (phasing out to $0 by $150k); unused losses carry forward. On sale, claimed depreciation is recaptured at up to 25%, and gains may owe capital-gains tax (a 1031 exchange can defer both). Figures are a year-1 estimate at your 24.0% rate — not tax advice; consult a CPA.
Schools (NCES district)
- District
- Norfolk City Public School District
- NCES district ID
- 5102670
- Math proficiency
- 27% ▼ -44.00%
- Reading proficiency
- 56% ▼ -10.00%
- Median HH income
- $44,358
- Composite
- 35.08/100
- National rank
- #5026
- State rank
- #118 of 131 in VA
Livability — Norfolk
- Score
- 83/100
- State rank
- #43
- US rank
- #1026
Category grades
Schools grade is shown separately in the Schools card above.
Census & demographics
- Census place
- Norfolk, VA
- County
- Norfolk City · 214,042 people
- City population
- 214,042
- Metro
- Virginia Beach-Norfolk-Newport News, VA-NC
- Population (ZIP)
- 29,746
- Household income
- $77,594
- Rent vs Own
- Severe rent burden
- 1143.0
Population outlook (Norfolk County) Hauer SSP2
- Today (2025)
- 249,032 people
- By 2030
- 252,347 · +1.3%
- By 2040
- 253,644 · +1.9%
- By 2050
- 251,913 · +1.2%
- By 2075
- 245,281 · -1.5%
- By 2100
- 219,548 · -11.8%
Race, ethnicity, and origin ACS 2023
- Neighborhood character
- Diverse neighborhood (Simpson 0.59)
- Race & ethnicity
- White 60% Black 21% Hispanic / Latino 9% Two or more races 9% Asian 5%
- Hispanic origin (detail)
- Mexican 3% Puerto Rican 1%
- Common ancestry
- Italian 3% Romanian 3% Slovak 2%
- Foreign-born
- 9% · Canada, South Korea, Vietnam
- Languages at home
- 88% English-only · Spanish 6% Tagalog/Filipino 2% Other Indo-European 1%
Political lean MEDSL · Norfolk
- 2024 margin
- Solid D (+41.5) · D 70.0% · R 28.5% · Other 1.6%
- 2008→2024 swing
- -1.4pp toward R · 2008: 43.0pp · 2024: 41.5pp
- All cycles
- 2024: D+41.5 2020: D+45.6 2016: D+42.0 2012: D+44.0 2008: D+43.0
Not yet ingested
- Civics
- —
Market trends
- HPI YoY
- ▼ -60.26%
- Current HPI
- 296.2161
- Rent YoY
- ▲ 3.07%
- Metro
- Virginia Beach-Norfolk-Newport News, VA-NC
- State GDP YoY
- ▲ 2.40%
- F500 in state
- 50
Industry mix (Fortune 500 HQ in VA)
| Industry | F500 HQs | Revenue |
|---|---|---|
| Aerospace / Defense | 4 | $236B |
|
||
| Technology / Defense | 3 | $32B |
|
||
| Financial Services | 2 | $176B |
|
||
| Utilities | 2 | $27B |
|
||
| Insurance | 2 | $25B |
|
||
| Technology | 2 | $15B |
|
||
Price history
2 events — show timeline
- 2026-04-29 Pending — REINMLS
- 2026-04-20 Listed $290,000 REINMLS
Property tax history
+3.5%/yrLatest (2025): $3,061 · +2.9% YoY. Source: county tax records.
Cash-flow waterfall
monthlySold comps — $/sqft
last 12 mo · ≤1 miLoading sold comps…