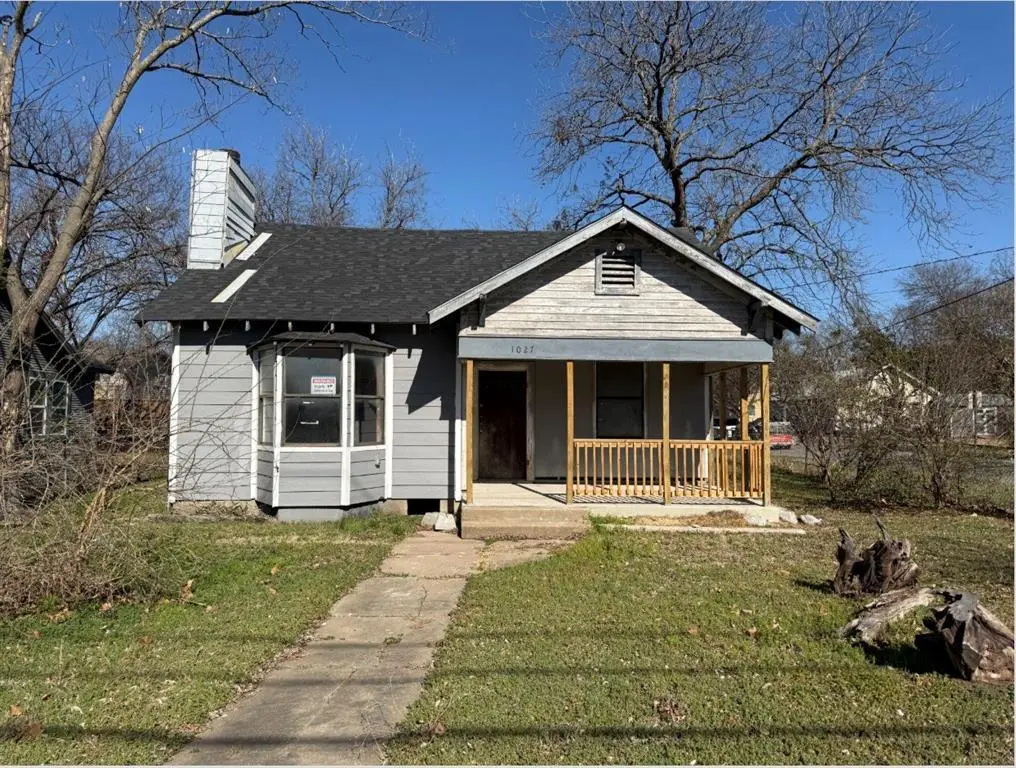
1027 E Lamar St · Sherman, TX
Flood risk 1/10 · Minimal
- FEMA flood zone
- X (unshaded)
- Chance of flooding over 30 yrs
- 0.0%
- Est. flood insurance / yr
- $507 – $1,088
Fire risk 6/10 · Moderate
- Est. fire insurance / yr
- $1,222 – $2,270
Heat risk 6/10 · Moderate
- Hot days now (above 108°F)
- 7 days/yr
- Hot days in 30 yrs
- 22 days/yr
Wind risk 4/10 · Minor
- Chance of severe wind over 30 yrs
- 20.0%
Air-quality risk 3/10 · Minor
- Unhealthy air days now
- 2 days/yr
- Unhealthy air days in 30 yrs
- 3 days/yr
Risk factors via First Street. Map © Google.
Why this score? — see what drove the B grade
The composite is a weighted blend of 9 inputs, each scored 0–100. Each bar is that input's sub-score; the figure is the points it added to the 100-point composite (weight × sub-score).
- Cash flow +30.0/30.0
- ARV discount +15.0/15.0
- DSCR +10.0/10.0
- 1% rule +9.5/10.0
- Livability +3.1/5.0
- Schools +2.9/10.0
- Condition / age +2.5/5.0
- Rent growth +1.8/5.0
- Appreciation +0.0/10.0
$120,000
🖨 Deal sheet 📄 Offer letter ✓ Due diligence
Listing remarks
Investor special AS IS in the heart of Sherman, TX 75090, a rare opportunity to finish out a high potential project where the heavy lifting is already done. This 4 bedroom, 2 bath home with 2,093 sq ft sits on a 6,638 sq ft lot and is ready for your vision. Major upgrades are complete, including a new roof, professionally stabilized foundation, and newly built front porch, eliminating some of the biggest renovation expenses. The home is now in the finish out phase, allowing you to choose flooring, paint, and kitchen, bath finishes to maximize value. Electrical has a new board with partial rewiring, HVAC ductwork is in place with partial upstairs install, and plumbing has begun with drains
Key facts
- Hvac ductwork
- New roof
- Electrical new board
Tags
Property features AI
Finance
- Financial info: Listing accepts Cash, Conventional, FHA, and VA financing
- HOA & community: No homeowners association
Exterior
- Parking: Detached carport; 2 covered/carport spaces
- Utilities: City water; City sewer (sewer available); No municipal utility district
- Home design: Single-family residence; Residential property; Built in 1920; Entry on one level
- Construction: Shingle roof; Other construction materials; Slab foundation
- Exterior features: Covered front porch; Covered porch(es); Grassed yard; Corner lot
Interior
- Kitchen: No appliances listed
- Bedrooms: Primary bedroom on the main level; Total of 4 bedrooms
- Bathrooms: 2 full bathrooms
- Interior features: Open floorplan; One level
- Laundry & utility: Laundry on site
Neighborhood map
What this means for you Summary
Snapshot
- This is a 4-bed/1.0-bath single-family listed at $120k.
Deal economics
- At list price, monthly cash flow is $526 ($6k/yr) — positive.
- The deal already cash-flows at list — no discount required.
- Meets the 1% rule at list price ($2k rent vs $120k).
- Recommended offer: $116k (3.0% below list) — sets the bar for market timing.
- Cap rate 11.6% vs local median 3.7% in Sherman — top-decile yield for the area; either an underpriced asset or a hidden risk that comps aren't pricing in. Stress-test before assuming the spread holds.
Location & tenants
- Location reads 61/100 on livability (#1,027 in TX) — a middle-class / working-renter tenant base. Strengths: cost of living A+, housing A+; Watch: crime C-, employment C-, amenities F.
- Sherman ISD (urban): math 31% / reading 37% proficiency, ranked #546 of 826 in TX (top 66%) — families likely to look elsewhere, expect single-tenant / working-renter base with shorter leases.
- Zoned schools: Dillingham El (837 students, 91% FRL) — zoned schools average 91% FRL vs 60% district-wide (32 pts higher); higher-poverty schools than district average — tighter screening recommended.
- Market conditions: Rents soft (-2.7%/yr); 473 active listings in the ZIP; 40 comparable units currently listed for rent nearby; rentals lingering (median 44d on market — plan ~5-8 weeks vacancy on turnover, expect pricing pressure); 60% of comp listings sitting > 30 days — soft ceiling on asking rent; 2,272 units permitted in Grayson County in 2024 (750 in 5+ unit buildings).
- This rent runs 38% of the median local income ($56k/yr) — at the standard rent-burdened threshold; future hikes will face affordability resistance.
Forward outlook
- Local home prices are declining (-3.0%/yr); year-one equity from $830 of loan paydown is wiped out by about $4k of value loss. Plan a longer hold.
- Grayson County population projected at +12% by 2050 — modest demand growth; plan on rents tracking national, not racing it.
- At projected returns (-3.0% appreciation + 0.0% rent growth), your $34k cash investment doubles in ~9 years — after that, you're playing with house money.
Negotiation context
- It's been on market 52 days — a 3% lower offer ($116k) is reasonable based on typical stale-listing flexibility.
Risks & watch-outs
- Watch-outs: built in 1920 — expect roof / HVAC / electrical / plumbing capex.
- Climate carrying-cost: major wildfire risk; extreme-heat days projected 7→22/yr by 2055 (HVAC capex compounding) — expect insurance premiums to compound above CPI over the hold.
Questions for the listing agent
- It's been on market 52 days. Have you received any prior offers? Is the seller open to a 3% concession, seller financing, or rate buy-down credit?
- Built in 1920 — when were the roof, HVAC, electrical panel, plumbing, and water heater last replaced?
- Is there a deadline driving the sale (1031 exchange, divorce, estate, relocation)? That informs how much negotiation room exists.
- Schools are D-rated, which usually means shorter tenancies and higher turnover. Who's the typical renter profile here, and what's been the actual vacancy rate?
- What's the average days-on-market for RENTAL listings here right now (not sales)? A rising rental-DOM trend means longer vacancies and softer asking-rent achievability than the comps imply.
- What's the recent tenant-quality profile in this submarket — average credit score on applications, eviction rate, late-payment / NSF rate, and stable-employment percentage? A property-management company in the area should have these aggregated.
- How much new for-sale + rental construction is in the pipeline within 1–3 miles? Heavy new supply typically softens prices + rents 12–24 months out; constrained supply supports both.
Investment metrics
- 1% rule
- 1.45% ✓
- Cap rate
- 11.55%
- Cash-on-cash
- 18.78%
- DSCR
- 1.84
- GRM
- 5.8
CMA / ARV
- ARV (median comp)
- $198,765
- List price
- $120,000
- Delta
- -39.63%
- Verdict
- UNDERPRICED
- Comps
- 20 within 1.0 mi
Show comp detail 12 sales within ~0.75 mi
| Address | Dist | Beds/Ba | Sqft | Sold | Price | $/sf | Match |
|---|---|---|---|---|---|---|---|
| 1108 E Jones St | 0.10mi | 3/2.0 (-1) | 1,336 (-7%) | 9mo | $199,900 | $150 | 68 |
| 415 S Charles St | 0.20mi | 3/2.0 (-1) | 1,351 (-6%) | 9mo | $180,000 | $133 | 64 |
| 514 N Lee Ave | 0.41mi | 3/1.0 (-1) | 1,532 (+7%) | 1mo | $67,500 | $44 | 64 |
| 906 S Willow St | 0.54mi | 3/2.0 (-1) | 1,433 (-0%) | 8mo | $197,900 | $138 | 59 |
| 315 N Carr Ave | 0.57mi | 3/2.0 (-1) | 1,377 (-4%) | 6mo | $175,000 | $127 | 53 |
| 527 S Gribble St | 0.32mi | 3/2.0 (-1) | 1,240 (-14%) | 7mo | $180,000 | $145 | 47 |
| 424 S Maxey St | 0.29mi | 3/2.0 (-1) | 1,247 (-13%) | 10mo | $160,000 | $128 | 47 |
| 1313 E Turley St | 0.70mi | 3/1.5 (-1) | 1,494 (+4%) | 10mo | $249,900 | $167 | 45 |
| 703 N Cleveland Ave | 0.60mi | 3/3.0 (-1) | 1,566 (+9%) | 5mo | $180,000 | $115 | 40 |
| 310 E Brockett St | 0.70mi | 3/2.5 (-1) | 1,493 (+4%) | 12mo | $249,000 | $167 | 40 |
| 1000 E Epstein St | 0.58mi | 3/2.0 (-1) | 1,265 (-12%) | 11mo | $235,000 | $186 | 35 |
| 1005 E Epstein St | 0.55mi | 3/2.0 (-1) | 1,238 (-14%) | 12mo | $199,000 | $161 | 32 |
Match score weights: distance 35% · size 25% · config 20% · recency 20%. Top-matched comps best support the ARV.
Projected returns pro-forma
-3.0% appreciation · 0.0% rent growth · sell at horizon
- IRR
- 7.1%
- Equity multiple
- 1.27×
- Total profit
- $8,995
- Equity at exit
- $17,892
- IRR
- 13.6%
- Equity multiple
- 1.94×
- Total profit
- $31,442
- Equity at exit
- $10,375
Cash invested: $33,600 (down + closing). Projections, not guarantees.
Landlord ↔ Tenant lean methodology
- Overall (STATE)
- 87 Strongly Landlord-Friendly
- State Texas
- 87 Strongly Landlord-Friendly · R+5
- County
- — inherits STATE
- City
- — inherits STATE
ZIP-level market 75090
- Home prices YoY
- -20.0%
- Rents YoY
- -2.7%
- Active inventory
- 473
- Price-to-rent
- 5.8×
Monthly cashflow live
- Estimated rent
- $1,736 high interval (Pro) →
- Mortgage (P&I)
- −$629
- Tax from tax record
- −$167 /mo · $1,999/yr
- Insurance
- −$50
- HOA
- −$0
- Vacancy / Maint / Mgmt
- −$365
- Net cashflow
- $526
Break-even live
UW: 25.0% down · 7.5% · 30yr · 1.5% tax · 5.0% vac · 8.0% maint · 8.0% mgmt
Financing live
Cash to close
- Down payment
- $30,000
- Closing costs
- $3,600
- Reserves months
- —
- Total cash needed
- —
Loan-product check · same deal, 3 products live
Conventional
25% down · 7.5% · 30yr
- Down + closing
- —
- Monthly P&I
- —
- Monthly cashflow
- —
- DSCR
- —
- Eligible?
- —
Personal DTI + credit; lowest rate.
DSCR
20% down · 8.5% · 30yr
- Down + closing
- —
- Monthly P&I
- —
- Monthly cashflow
- —
- DSCR
- —
- Eligible?
- —
No personal income docs; deal must DSCR.
Hard money
10% down · 12.0% · 12mo
- Down + closing
- —
- Monthly P&I
- —
- Monthly cashflow
- —
- DSCR
- —
- Eligible?
- —
Short-term bridge; refi at stabilization.
Rent comps 40 comps
| Address | Beds | Baths | Sqft | Rent | $/sqft | DOM | Units | Dist |
|---|---|---|---|---|---|---|---|---|
| 1201 E Lamar St Sherman, TX | 3.0 | 2.0 | 1726 | $1,995 | $1.16 | 43d | 1 | 0.09mi |
| 902 E Cherry St Sherman, TX | 3.0 | 1.0 | 1530 | $1,400 | $0.92 | 43d | 1 | 0.17mi |
| 1014 E Pecan St Sherman, TX | 3.0 | 2.0 | 1340 | $1,900 | $1.42 | 43d | 1 | 0.19mi |
| 108 N Cleveland Ave Sherman, TX | 3.0 | 1.5 | 1060 | $1,200 | $1.13 | 43d | 1 | 0.35mi |
| 815 S Willow St Sherman, TX | 4.0 | 2.0 | 1670 | $1,495 | $0.90 | 43d | 1 | 0.46mi |
| 1429 E Odneal St Sherman, TX | 3.0 | 2.0 | 1218 | $1,700 | $1.40 | 43d | 1 | 0.49mi |
| 822 S Throckmorton St Sherman, TX | 3.0 | 2.0 | 1288 | $1,350 | $1.05 | 43d | 1 | 0.53mi |
| 615 N Cleveland Ave #617 Sherman, TX | 3.0 | 2.0 | 1316 | $1,600 | $1.22 | 43d | 1 | 0.59mi |
| 514 E Brockett St Unit 514 Sherman, TX | 4.0 | 4.5 | 1800 | $1,800 | $1.00 | 43d | 1 | 0.61mi |
| 609 E Carter St Sherman, TX | 3.0 | 2.0 | 1230 | $1,450 | $1.18 | 21d | 1 | 0.62mi |
| 607 E Carter St Unit 609 Sherman, TX | 3.0 | 2.0 | 1230 | $1,450 | $1.18 | 21d | 1 | 0.64mi |
| 217 N Burdette Ave Sherman, TX | 3.0 | 1.0 | 1288 | $1,400 | $1.09 | 43d | 1 | 0.64mi |
| 608 E College St Unit 608 Sherman, TX | 3.0 | 2.0 | 1230 | $1,325 | $1.08 | 21d | 1 | 0.66mi |
| 706 N Harrison Ave Ste 100 Sherman, TX | 3.0 | 2.5 | 1350 | $1,395 | $1.03 | 21d | 1 | 0.66mi |
| 614 E College St Sherman, TX | 3.0 | 2.0 | 1238 | $1,400 | $1.13 | 21d | 1 | 0.68mi |
| 1124 S Hazelwood St Sherman, TX | 3.0 | 2.0 | 1347 | $1,650 | $1.22 | 43d | 1 | 0.69mi |
| 916 N Throckmorton St Sherman, TX | 3.0 | 2.0 | 1259 | $1,400 | $1.11 | 21d | 1 | 0.71mi |
| 1338 McCall St Sherman, TX | 3.0 | 2.0 | 1248 | $1,525 | $1.22 | 43d | 1 | 0.74mi |
| 301 E Brockett St Unit 100 Sherman, TX | 4.0 | 4.0 | 1169 | $1,400 | $1.20 | 43d | 1 | 0.76mi |
| 823 N Branch St Sherman, TX | 3.0 | 2.0 | 1357 | $1,650 | $1.22 | 21d | 1 | 0.76mi |
| 422 N Elliott St Sherman, TX | 3.0 | 2.5 | 1500 | $1,650 | $1.10 | 21d | 1 | 0.87mi |
| 913 N Brents Ave Sherman, TX | 3.0 | 2.5 | 1419 | $1,500 | $1.06 | 43d | 1 | 0.90mi |
| 815 N Travis St Sherman, TX | 3.0 | 2.0 | 1536 | $1,550 | $1.01 | 21d | 1 | 0.90mi |
| 1014 N Brents Ave #1012 Sherman, TX | 3.0 | 2.0 | 1208 | $1,350 | $1.12 | 43d | 1 | 0.93mi |
| 1110 N Ross Ave Sherman, TX | 3.0 | 2.0 | 1377 | $1,750 | $1.27 | 21d | 1 | 0.93mi |
| 1121 Patricia Dr Sherman, TX | 3.0 | 2.0 | 1472 | $1,450 | $0.99 | 21d | 1 | 0.97mi |
| 1402 S Montgomery St Sherman, TX | 3.0 | 2.0 | 1160 | $1,399 | $1.21 | 43d | 1 | 1.10mi |
| 609 E McGee St Unit 609 Sherman, TX | 4.0 | 2.5 | 1600 | $1,800 | $1.12 | 43d | 1 | 1.14mi |
| 1509 Fairway Dr Sherman, TX | 3.0 | 2.0 | 1510 | $1,664 | $1.10 | 21d | 1 | 1.16mi |
| 1610 Linda Dr Sherman, TX | 3.0 | 2.0 | 1500 | $1,714 | $1.14 | 21d | 1 | 1.16mi |
| 1312 N Travis St Sherman, TX | 3.0 | 1.5 | 1086 | $1,325 | $1.22 | 43d | 1 | 1.19mi |
| 524-526 N Woods St Sherman, TX | 3.0 | 2.0 | 1454 | $1,445 | $0.99 | 43d | 1 | 1.24mi |
| 817 W Lamar St Sherman, TX | 3.0 | 2.0 | 1074 | $1,495 | $1.39 | 43d | 1 | 1.27mi |
| 417 W Dulin St Unit 417 Sherman, TX | 3.0 | 2.0 | 1386 | $1,850 | $1.33 | 43d | 1 | 1.30mi |
| 419 W Dulin St Unit 419 Sherman, TX | 3.0 | 2.0 | 1386 | $1,850 | $1.33 | 43d | 1 | 1.30mi |
| 822 W Fischer St Sherman, TX | 3.0 | 1.0 | 1256 | $1,350 | $1.07 | 21d | 1 | 1.34mi |
| 214 N Ricketts St Sherman, TX | 3.0 | 2.0 | 1211 | $1,550 | $1.28 | 43d | 1 | 1.34mi |
| 208 E Lake Ave Sherman, TX | 3.0 | 2.5 | 1238 | $1,445 | $1.17 | 43d | 1 | 1.36mi |
| 930 W Freeman St Sherman, TX | 3.0 | 2.0 | 1222 | $1,499 | $1.23 | 21d | 1 | 1.36mi |
| 1415 S Austin St Sherman, TX | 3.0 | 1.0 | 1027 | $1,180 | $1.15 | 21d | 1 | 1.39mi |
Listing history 18 events
-
2026-06-19days on market $120,000 Active 52 DOM
-
2026-06-18days on market $120,000 Active 51 DOM
-
2026-06-17days on market $120,000 Active 50 DOM
-
2026-06-16days on market $120,000 Active 49 DOM
-
2026-06-15days on market $120,000 Active 48 DOM
-
2026-06-14days on market $120,000 Active 46 DOM
-
2026-06-13days on market $120,000 Active 45 DOM
-
2026-06-10days on market $120,000 Active 43 DOM
-
2026-06-09days on market $120,000 Active 42 DOM
-
2026-06-08days on market $120,000 Active 41 DOM
-
2026-06-07days on market $120,000 Active 40 DOM
-
2026-06-03days on market $120,000 Active 36 DOM
-
2026-06-02days on market $120,000 Active 35 DOM
-
2026-06-01days on market $120,000 Active 34 DOM
-
2026-05-31days on market $120,000 Active 33 DOM
-
2026-05-30days on market $120,000 Active 32 DOM
-
2026-04-28$120,000 Active 1350-char remark
-
2024-01-11soldstatus
ⓘ Source: listings_history table (triggers on properties + properties_extension) + one-shot
backfill from property_details.listing_events for pre-trigger history.
Tax reassessment forecast TX · Resets to sale price
- Current annual tax
- $1,999 · $167/mo
- Projected year-2 tax
- $2,196 · $183/mo
- Expected delta
- +$197/yr (+$16/mo · 9.8%)
ⓘ Screening estimate from a state-policy table — verify with the county assessor before closing.
Climate risk First Street
- Flood 1/10 Low FEMA zone X (unshaded) · 0% chance over 30 yrs
- Wildfire 6/10 Major
- Heat 6/10 Major 7 d/yr ≥108°F today · 22 d/yr by 30 yrs out
- Wind 4/10 Moderate 20% chance of damaging wind over 30 yrs
- Air quality 3/10 Moderate 2 unhealthy d/yr today · 3 by 30 yrs out
Nearby sold comps map
Loading sold comps map…
Walkable amenities ~0.75 mi
Loading nearby amenities…
Taxation est. · year 1
- Rental income
- $20,837
- − Mortgage interest
- −$6,722
- − Property taxes
- −$1,999
- − Insurance
- −$600
- − Repairs & maintenance
- −$1,667
- − Management
- −$1,667
- − Depreciation
- −$3,491
- Taxable income
- $4,691
- Est. tax owed @ 24.0%
- −$1,126
- After-tax cash flow
- $5,185/yr
For passive investors: Depreciation is non-cash, so a rental often shows a tax loss while cash-flowing — sheltering income. Rental losses are passive: they offset passive income freely, and up to $25,000/yr can offset ordinary (W-2) income if you actively participate and your MAGI is under $100k (phasing out to $0 by $150k); unused losses carry forward. On sale, claimed depreciation is recaptured at up to 25%, and gains may owe capital-gains tax (a 1031 exchange can defer both). Figures are a year-1 estimate at your 24.0% rate — not tax advice; consult a CPA.
Schools (NCES district)
- District
- Sherman ISD
- NCES district ID
- 4840080
- Math proficiency
- 31% ▼ -9.00%
- Reading proficiency
- 37% ▼ -2.00%
- Median HH income
- $42,587
- Composite
- 28.79/100
- National rank
- #6665
- State rank
- #546 of 826 in TX
Livability — Sherman
- Score
- 61/100
- State rank
- #1027
- US rank
- #18243
Category grades
Schools grade is shown separately in the Schools card above.
Census & demographics
- Census place
- Sherman, TX
- County
- Grayson County · 108,053 people
- City population
- 54,936
- Metro
- Sherman-Denison, TX
- Population (ZIP)
- 26,594
- Household income
- $55,543
- Rent vs Own
- Severe rent burden
- 840.0
Population outlook (Grayson County) Hauer SSP2
- Today (2025)
- 134,540 people
- By 2030
- 138,653 · +3.1%
- By 2040
- 145,958 · +8.5%
- By 2050
- 151,218 · +12.4%
- By 2075
- 161,802 · +20.3%
- By 2100
- 159,036 · +18.2%
Race, ethnicity, and origin ACS 2023
- Neighborhood character
- Diverse neighborhood (Simpson 0.64)
- Race & ethnicity
- White 49% Hispanic / Latino 32% Two or more races 17% Black 11%
- Hispanic origin (detail)
- Mexican 26%
- Common ancestry
- Slovak 2% Romanian 2% Lithuanian 1%
- Foreign-born
- 15% · Canada
- Languages at home
- 73% English-only · Spanish 24% German/W. Germanic 1% Other Indo-European 1%
Political lean MEDSL · Grayson
- 2024 margin
- Solid R (+54.3) · D 22.5% · R 76.7%
- 2008→2024 swing
- -16.4pp toward R · 2008: -37.9pp · 2024: -54.3pp
- All cycles
- 2024: R+54.3 2020: R+49.9 2016: R+53.1 2012: R+48.0 2008: R+37.9
Not yet ingested
- Civics
- —
Market trends
- HPI YoY
- ▼ -69.00%
- Current HPI
- 276.5739
- Rent YoY
- ▼ -2.70%
- Metro
- Sherman-Denison, TX
- State GDP YoY
- ▲ 3.95%
- F500 in state
- 110
Industry mix (Fortune 500 HQ in TX)
| Industry | F500 HQs | Revenue |
|---|---|---|
| Energy | 16 | $1,198B |
|
||
| Technology | 5 | $198B |
|
||
| Engineering / Construction | 4 | $72B |
|
||
| Energy Services | 3 | $60B |
|
||
| Utilities | 3 | $41B |
|
||
| Healthcare | 2 | $330B |
|
||
Price history
2 events — show timeline
- 2026-04-28 Listed $120,000 NTREIS
- 2024-01-11 Sold (Public Records) — Public Records
Property tax history
+5.4%/yrLatest (2025): $1,999 · -2.4% YoY. Source: county tax records.
Cash-flow waterfall
monthlySold comps — $/sqft
last 12 mo · ≤1 miLoading sold comps…