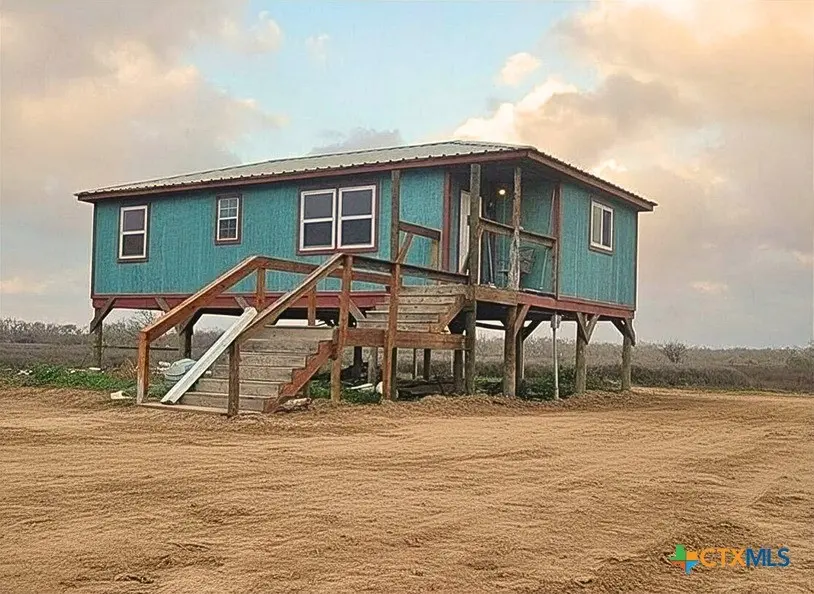
410 Guadalupe River Dr · Tivoli, TX
Flood risk 9/10 · Severe
- FEMA flood zone
- AE
- Chance of flooding over 30 yrs
- 0.99%
- Est. flood insurance / yr
- $1,737 – $8,500
Fire risk 5/10 · Moderate
- Est. fire insurance / yr
- $1,222 – $2,270
Heat risk 10/10 · Severe
- Hot days now (above 108°F)
- 7 days/yr
- Hot days in 30 yrs
- 25 days/yr
Wind risk 9/10 · Severe
- Chance of severe wind over 30 yrs
- 99.0%
Air-quality risk 1/10 · Minimal
- Unhealthy air days now
- 0 days/yr
- Unhealthy air days in 30 yrs
- 0 days/yr
Risk factors via First Street. Map © Google.
Why this score? — see what drove the C+ grade
The composite is a weighted blend of 9 inputs, each scored 0–100. Each bar is that input's sub-score; the figure is the points it added to the 100-point composite (weight × sub-score).
- Cash flow +19.0/30.0
- ARV discount +15.0/15.0
- DSCR +6.0/10.0
- 1% rule +4.6/10.0
- Appreciation +4.6/10.0
- Schools +3.7/10.0
- Livability +3.0/5.0
- Rent growth +2.5/5.0
- Condition / age +2.5/5.0
$118,000
🖨 Deal sheet (PDF) 📄 Offer letter ✓ Due diligence
Listing remarks MLS
Perfect place to take it easy and get away from all the hustle and bustle of the everyday. Whether you make this your always home or a nice fishing retreat, this is the property for you. Sit on the back porch and watch the stunning sun rises over the bayou. There are two private community boat ramps and an abundance of wildlife! This half an acre lot offers a new, never lived in, Amish built home on stilts. There are still a few things needing a finishing touch, so it is a great place to complete and personalize to be your own.
Key facts
- Half an acre lot
- 0.52 acre lot
- Built 2021
Tags
Neighborhood map
What this means for you Summary
Snapshot
- This is a 2-bed/1.0-bath single-family listed at $118k.
Deal economics
- At list price, monthly cash flow is $-303 ($-4k/yr) — negative.
- To cash-flow at today's rent, offer at most $65k (45.3% below list).
- To meet the 1% rule (rent ≥ 1% of price), the offer needs to be $114k (3.5% below list).
- Recommended offer: $65k (45.3% below list) — sets the bar for cash-flow.
Location & tenants
- Location reads 60/100 on livability (#1,043 in TX) — a middle-class / working-renter tenant base. Strengths: cost of living A+, health & safety A+; Watch: crime F, amenities F, commute F.
- Calhoun County ISD (town): math 44% / reading 43% proficiency, ranked #293 of 826 in TX (top 36%) — families likely to look elsewhere, expect single-tenant / working-renter base with shorter leases.
- Zoned schools: Jackson/Roosevelt El (math 51% / reading 49%, grade D+, #849 of 4,322 statewide, top 20%, 852 students, 68% FRL); Travis Middle (math 26% / reading 34%, grade F, #1,056 of 1,662 statewide, top 65%, 702 students, 74% FRL); Calhoun H S (math 53% / reading 38%, grade D-, #634 of 1,632 statewide, top 39%, 987 students, 51% FRL).
- Market conditions: 21 active listings in the ZIP; 95 units permitted in Calhoun County in 2024 (0 in 5+ unit buildings).
Forward outlook
- Local home prices are declining (-0.8%/yr); year-one equity from $816 of loan paydown is wiped out by about $892 of value loss. Plan a longer hold.
- Calhoun County population projected at +12% by 2050 — modest demand growth; plan on rents tracking national, not racing it.
Negotiation context
- It's been on market 264 days — a 12% lower offer ($104k) is reasonable based on typical stale-listing flexibility.
- 5 sale attempts since 6y ago; this cycle's ask has dropped $27k (19%) from the opening price — seller is motivated, your offer sets the floor, not the list.
Risks & watch-outs
- Watch-outs: flood insurance adds $427/mo.
- Climate carrying-cost: in FEMA flood zone AE (mandatory federal flood insurance); severe wind risk, 99% chance of damaging wind over 30y; moderate wildfire risk; extreme-heat days projected 7→25/yr by 2055 (HVAC capex compounding) — expect insurance premiums to compound above CPI over the hold.
Questions for the listing agent
- What do current leases actually rent for vs. the listed asking? Can we see a recent rent roll and the last 12 months of T-12 income?
- It's been on market 264 days. Have you received any prior offers? Is the seller open to a 45% concession, seller financing, or rate buy-down credit?
- What's the actual annual flood-insurance premium (NFIP or private), and is the property in a SFHA with mandatory coverage?
- Why hasn't it sold? Are there any deal-killer items the seller is aware of (foundation, flood, title, zoning, code violations)?
- Is there a deadline driving the sale (1031 exchange, divorce, estate, relocation)? That informs how much negotiation room exists.
- Schools are D-rated, which usually means shorter tenancies and higher turnover. Who's the typical renter profile here, and what's been the actual vacancy rate?
- Crime grade is F in this area — have there been break-ins, vandalism, or insurance claims at this property in the last 3 years? What carrier currently insures it and at what premium?
- What's the average days-on-market for RENTAL listings here right now (not sales)? A rising rental-DOM trend means longer vacancies and softer asking-rent achievability than the comps imply.
- What's the recent tenant-quality profile in this submarket — average credit score on applications, eviction rate, late-payment / NSF rate, and stable-employment percentage? A property-management company in the area should have these aggregated.
- How much new for-sale + rental construction is in the pipeline within 1–3 miles? Heavy new supply typically softens prices + rents 12–24 months out; constrained supply supports both.
Investment metrics
- 1% rule
- 0.96% ✗
- Cap rate
- 7.55%
- Cash-on-cash
- 4.50%
- DSCR
- 1.20
- GRM
- 8.6
CMA / ARV
- ARV (median comp)
- $148,722
- List price
- $118,000
- Delta
- -20.66%
- Verdict
- UNDERPRICED
- Comps
- 2 within 1.0 mi
Projected returns pro-forma
-0.76% appreciation · 3.0% rent growth · sell at horizon
- IRR
- -18.6%
- Equity multiple
- 0.19×
- Total profit
- $-26,607
- Equity at exit
- $29,868
- IRR
- -11.7%
- Equity multiple
- -0.09×
- Total profit
- $-35,989
- Equity at exit
- $32,560
Cash invested: $33,040 (down + closing). Projections, not guarantees.
Landlord ↔ Tenant lean methodology
- Overall (STATE)
- 87 Strongly Landlord-Friendly
- State Texas
- 87 Strongly Landlord-Friendly · R+5
- County
- — inherits STATE
- City
- — inherits STATE
ZIP-level market 77990
- Home prices YoY
- -0.9%
- Active inventory
- 21
- Price-to-rent
- 8.6×
Monthly cashflow live
- Estimated rent
- $1,138 medium interval (Pro) →
- Mortgage (P&I)
- −$619
- Tax from tax record
- −$107 /mo · $1,290/yr
- Insurance
- −$49
- Flood insurance flood zone
- −$427 /mo · $5,118/yr
- HOA
- −$0
- Vacancy / Maint / Mgmt
- −$239
- Net cashflow
- $-303
Break-even live
Sensitivity live
| Price | -10% $-236 | -5% $-269 | +0% $-303 | +5% $-336 | +10% $-369 |
|---|---|---|---|---|---|
| Rent | -10% $-393 | -5% $-348 | +0% $-303 | +5% $-258 | +10% $-213 |
| Rate | -1.0pp $-243 | -0.5pp $-273 | base $-303 | +0.5pp $-333 | +1.0pp $-364 |
UW: 25.0% down · 7.5% · 30yr · 1.5% tax · 5.0% vac · 8.0% maint · 8.0% mgmt
Financing live
Cash to close
- Down payment
- $29,500
- Closing costs
- $3,540
- Reserves months
- —
- Total cash needed
- —
Loan-product check · same deal, 3 products live
Conventional
25% down · 7.5% · 30yr
- Down + closing
- —
- Monthly P&I
- —
- Monthly cashflow
- —
- DSCR
- —
- Eligible?
- —
Personal DTI + credit; lowest rate.
DSCR
20% down · 8.5% · 30yr
- Down + closing
- —
- Monthly P&I
- —
- Monthly cashflow
- —
- DSCR
- —
- Eligible?
- —
No personal income docs; deal must DSCR.
Hard money
10% down · 12.0% · 12mo
- Down + closing
- —
- Monthly P&I
- —
- Monthly cashflow
- —
- DSCR
- —
- Eligible?
- —
Short-term bridge; refi at stabilization.
Listing history 25 events
-
2026-06-21days on market $118,000 Active 264 DOM
-
2026-06-21days on market $118,000 Active 263 DOM
-
2026-06-18days on market $118,000 Active 261 DOM
-
2026-06-17days on market $118,000 Active 260 DOM
-
2026-06-16days on market $118,000 Active 259 DOM
-
2026-06-15days on market $118,000 Active 258 DOM
-
2026-06-13days on market $118,000 Active 256 DOM
-
2026-06-12days on market $118,000 Active 255 DOM
-
2026-06-09days on market $118,000 Active 252 DOM
-
2026-06-08days on market $118,000 Active 251 DOM
-
2026-06-08days on market $118,000 Active 250 DOM
-
2026-06-07days on market $118,000 Active 249 DOM
-
2026-06-03days on market $118,000 Active 246 DOM
-
2026-06-02days on market $118,000 Active 245 DOM
-
2026-06-01days on market $118,000 Active 244 DOM
-
2026-05-31days on market $118,000 Active 243 DOM
-
2026-04-18price $118,000 534-char remark
Show marketing remark (534 chars)
Perfect place to take it easy and get away from all the hustle and bustle of the everyday. Whether you make this your always home or a nice fishing retreat, this is the property for you. Sit on the back porch and watch the stunning sun rises over the bayou. There are two private community boat ramps and an abundance of wildlife! This half an acre lot offers a new, never lived in, Amish built home on stilts. There are still a few things needing a finishing touch, so it is a great place to complete and personalize to be your own.
-
2025-09-26$145,000 Active 534-char remark
Show marketing remark (534 chars)
Perfect place to take it easy and get away from all the hustle and bustle of the everyday. Whether you make this your always home or a nice fishing retreat, this is the property for you. Sit on the back porch and watch the stunning sun rises over the bayou. There are two private community boat ramps and an abundance of wildlife! This half an acre lot offers a new, never lived in, Amish built home on stilts. There are still a few things needing a finishing touch, so it is a great place to complete and personalize to be your own.
-
2022-09-19soldstatus
-
2022-04-09historical
-
2022-04-06status Active
-
2022-03-10$83,000 Active
-
2022-02-28historical
-
2021-09-13$82,000 Active
-
2020-11-12$92,000
ⓘ Source: listings_history table (triggers on properties + properties_extension) + one-shot
backfill from property_details.listing_events for pre-trigger history.
Tax reassessment forecast TX · Resets to sale price
- Current annual tax
- $1,290 · $107/mo
- Projected year-2 tax
- $2,159 · $180/mo
- Expected delta
- +$870/yr (+$72/mo · 67.4%)
ⓘ Screening estimate from a state-policy table — verify with the county assessor before closing.
Climate risk First Street
- Flood 9/10 Extreme FEMA zone AE · 99% chance over 30 yrs
- Wildfire 5/10 Major
- Heat 10/10 Extreme 7 d/yr ≥108°F today · 25 d/yr by 30 yrs out
- Wind 9/10 Extreme 99% chance of damaging wind over 30 yrs
- Air quality 1/10 Low 0 unhealthy d/yr today · 0 by 30 yrs out
Nearby sold comps map
Loading sold comps map…
Walkable amenities ~0.75 mi
Loading nearby amenities…
Taxation est. · year 1
- Rental income
- $13,660
- − Mortgage interest
- −$6,610
- − Property taxes
- −$1,290
- − Insurance
- −$5,708
- − Repairs & maintenance
- −$1,093
- − Management
- −$1,093
- − Depreciation
- −$3,433
- Taxable loss
- −$5,566
- Est. tax savings @ 24.0%
- +$1,336
- After-tax cash flow
- $-2,296/yr
For passive investors: Depreciation is non-cash, so a rental often shows a tax loss while cash-flowing — sheltering income. Rental losses are passive: they offset passive income freely, and up to $25,000/yr can offset ordinary (W-2) income if you actively participate and your MAGI is under $100k (phasing out to $0 by $150k); unused losses carry forward. On sale, claimed depreciation is recaptured at up to 25%, and gains may owe capital-gains tax (a 1031 exchange can defer both). Figures are a year-1 estimate at your 24.0% rate — not tax advice; consult a CPA.
Schools (NCES district)
- District
- Calhoun County ISD
- NCES district ID
- 4812480
- Math proficiency
- 44% ▼ -10.00%
- Reading proficiency
- 43% ▼ -2.00%
- Median HH income
- $48,588
- Composite
- 37.27/100
- National rank
- #4453
- State rank
- #293 of 826 in TX
Livability — Tivoli
- Score
- 60/100
- State rank
- #1043
- US rank
- #18552
Category grades
Schools grade is shown separately in the Schools card above.
Census & demographics
- Population (ZIP)
- 783
Population outlook (Calhoun County) Hauer SSP2
- Today (2025)
- 23,512 people
- By 2030
- 24,183 · +2.9%
- By 2040
- 25,370 · +7.9%
- By 2050
- 26,388 · +12.2%
- By 2075
- 28,014 · +19.1%
- By 2100
- 26,314 · +11.9%
Race, ethnicity, and origin ACS 2023
- Neighborhood character
- Majority Hispanic (54%)
- Race & ethnicity
- Hispanic / Latino 54% White 44% Two or more races 22%
- Hispanic origin (detail)
- Mexican 51%
- Common ancestry
- Serbian 1%
- Foreign-born
- 8% · Canada, Guatemala
- Languages at home
- 60% English-only · Spanish 40%
Political lean MEDSL · Calhoun
- 2024 margin
- Solid R (+52.2) · D 23.7% · R 75.8%
- 2008→2024 swing
- -32.2pp toward R · 2008: -20.0pp · 2024: -52.2pp
- All cycles
- 2024: R+52.2 2020: R+44.5 2016: R+36.2 2012: R+24.2 2008: R+20.0
Not yet ingested
- Civics
- —
Market trends
- HPI YoY
- ▼ -0.76%
- Current HPI
- 81.0773
- Rent YoY
- —
- Metro
- —
- State GDP YoY
- ▲ 3.95%
- F500 in state
- 110
Industry mix (Fortune 500 HQ in TX)
| Industry | F500 HQs | Revenue |
|---|---|---|
| Energy | 16 | $1,198B |
|
||
| Technology | 5 | $198B |
|
||
| Engineering / Construction | 4 | $72B |
|
||
| Energy Services | 3 | $60B |
|
||
| Utilities | 3 | $41B |
|
||
| Healthcare | 2 | $330B |
|
||
Price history
+28.3% since first listed9 events — show timeline
- 2026-04-18 Price Changed $118,000 CTXMLS
- 2025-09-26 Listed $145,000 CTXMLS
- 2022-09-19 Sold (Public Records) — Public Records
- 2022-04-09 Listing Removed — CTXMLS
- 2022-04-06 Relisted — CTXMLS
- 2022-03-10 Listed $83,000 CTXMLS
- 2022-02-28 Listing Removed — CTXMLS
- 2021-09-13 Listed $82,000 CTXMLS
- 2020-11-12 Listed $92,000 CBMLS
Property tax history
+53.0%/yrLatest (2025): $1,290 · +7.5% YoY. Source: county tax records.
Cash-flow waterfall
monthlySold comps — $/sqft
last 12 mo · ≤1 miLoading sold comps…