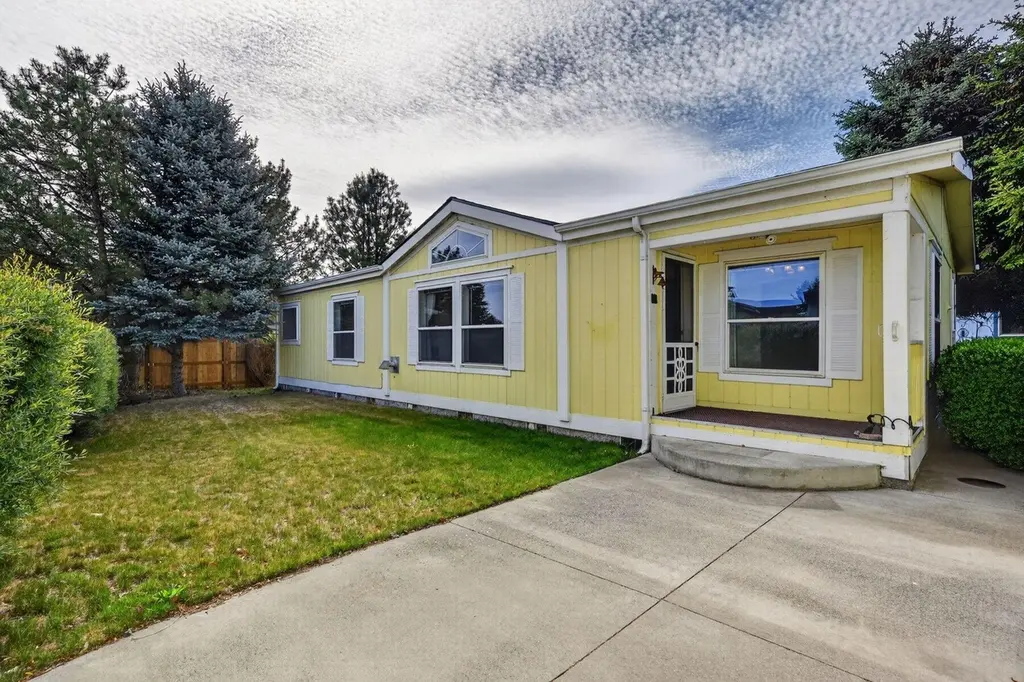
826 NE Shoshone Dr · Redmond, OR
Flood risk 1/10 · Minimal
- FEMA flood zone
- X (unshaded)
- Chance of flooding over 30 yrs
- 0.0%
- Est. flood insurance / yr
- $507 – $1,088
Fire risk 6/10 · Moderate
- Est. fire insurance / yr
- $498 – $926
Heat risk 3/10 · Minor
- Hot days now (above 92°F)
- 7 days/yr
- Hot days in 30 yrs
- 16 days/yr
Wind risk 1/10 · Minimal
- Chance of severe wind over 30 yrs
- —
Air-quality risk 10/10 · Severe
- Unhealthy air days now
- 22 days/yr
- Unhealthy air days in 30 yrs
- 25 days/yr
Risk factors via First Street. Map © Google.
Why this score? — see what drove the D grade
The composite is a weighted blend of 9 inputs, each scored 0–100. Each bar is that input's sub-score; the figure is the points it added to the 100-point composite (weight × sub-score).
- ARV discount +15.0/15.0
- Cash flow +11.2/30.0
- Livability +3.9/5.0
- DSCR +3.3/10.0
- Rent growth +3.3/5.0
- Schools +2.9/10.0
- 1% rule +2.7/10.0
- Condition / age +2.5/5.0
- Appreciation +0.0/10.0
$299,900
🖨 Deal sheet (PDF) 📄 Offer letter ✓ Due diligence
Listing remarks
Property qualifies for VA financing. Tucked into the desirable Desert Meadows community in NE Redmond, this well maintained 3 bedroom, 2 bathroom manufactured home offers comfort, space, and functionality all in one! Vaulted ceilings and abundant natural light create an airy feel throughout. The primary retreat features an oversized ensuite bath with large vanity, soaking tub, and separate shower. Bright kitchen offers ample cabinetry, great storage, and opens seamlessly to the dining and living spaces. Pride of ownership shines throughout. Outside, enjoy mature landscaping, a welcoming front porch, yard space, and an impressive oversized detached garage with room for vehicles, hobbies, sto
Key facts
- Mature landscaping
- 6,098 sq ft lot
- 2 garage spots
Tags
Property features AI
Finance
- Financial info: Not currently rented
- HOA & community: Homeowners association with monthly fee; Monthly association fee: $132.60; Association amenities include clubhouse, snow removal, and water; CC&Rs in place
Exterior
- Parking: Detached 2-car garage; Concrete parking; Garage door opener
- Security: Carbon monoxide detector(s); Smoke detector(s)
- Utilities: Public water; Private sewer (septic tank); Public utilities available
- Home design: Manufactured home on land (double wide); One level; Residential property; Frame construction; Block foundation; No common walls; Zoned R4; Audio surveillance on premises
- Construction: Built in 1995
- Exterior features: Composition roof; Double pane windows with vinyl frames; Shed(s); Landscaped, level lot; Paved road access; Flood not applicable
Interior
- Kitchen: Dishwasher; Microwave; Oven; Range; Range hood; Refrigerator
- Bedrooms: 3 bedrooms (primary on main level)
- Flooring: Carpet; Vinyl
- Bathrooms: 2 full bathrooms
- Heating & cooling: Central air; Electric heating; Forced air; Pellet stove
- Interior features: Ceiling fan(s); Fiberglass stall shower; Laminate counters; Pantry; Primary bedroom on main level; Shower/tub combo; Soaking tub; Vaulted ceilings
- Laundry & utility: Laundry room; Water heater
Neighborhood map
What this means for you Summary
Snapshot
- This is a 3-bed/2.0-bath manufactured listed at $300k.
Deal economics
- At list price, monthly cash flow is $-115 ($-1k/yr) — negative.
- To cash-flow at today's rent, offer at most $280k (6.8% below list).
- To meet the 1% rule (rent ≥ 1% of price), the offer needs to be $232k (22.6% below list).
- Recommended offer: $232k (22.6% below list) — sets the bar for 1% rule.
- Cap rate 5.8% vs local median 2.8% in Redmond — top-decile yield for the area; either an underpriced asset or a hidden risk that comps aren't pricing in. Stress-test before assuming the spread holds.
Location & tenants
- Location reads 78/100 on livability (#68 in OR, #2,715 nationally) — a middle-class / working-renter tenant base. Strengths: housing A+, health & safety A+, amenities A-; Watch: commute F.
- Redmond SD 2J (town): math 24% / reading 42% proficiency, ranked #28 of 58 in OR (top 48%) — families likely to look elsewhere, expect single-tenant / working-renter base with shorter leases.
- Zoned schools: Tom Mccall Elementary School (math 27% / reading 42%, grade F, #218 of 412 statewide, top 58%, 478 students, 38% FRL); Elton Gregory Middle School (math 18% / reading 39%, grade F, #94 of 128 statewide, top 73%, 709 students, 40% FRL); Redmond High School (936 students, 38% FRL).
- Market conditions: Rents rising (+3.4%/yr); 737 active listings in the ZIP; 8 comparable units currently listed for rent nearby; rentals at typical pace (median 23d on market — plan ~3-4 weeks tenant-placement turnaround); solid renter incomes; 1,624 units permitted in Deschutes County in 2024 (391 in 5+ unit buildings).
- This rent runs 32% of the median local income ($87k/yr) — at the standard rent-burdened threshold; future hikes will face affordability resistance.
Forward outlook
- Local home prices are declining (-3.0%/yr); year-one equity from $2k of loan paydown is wiped out by about $9k of value loss. Plan a longer hold.
- Deschutes County population projected at +38% by 2050 — long-run rental-demand tailwind backs the buy-and-hold thesis.
Negotiation context
- It's been on market 33 days — a 3% lower offer ($291k) is reasonable based on typical stale-listing flexibility.
- 2 sale attempts since 23y ago; this cycle's ask has dropped $30k (9%) from the opening price — seller is motivated, your offer sets the floor, not the list.
- Current owner paid $43k; list at $300k implies a 599% gain — meaningful room to come down on a strong offer.
Risks & watch-outs
- Climate carrying-cost: major wildfire risk — expect insurance premiums to compound above CPI over the hold.
Questions for the listing agent
- What do current leases actually rent for vs. the listed asking? Can we see a recent rent roll and the last 12 months of T-12 income?
- It's been on market 33 days. Have you received any prior offers? Is the seller open to a 23% concession, seller financing, or rate buy-down credit?
- What does the HOA fee cover, when was the last increase, and are there any pending special assessments or reserve-fund shortfalls?
- Is there a deadline driving the sale (1031 exchange, divorce, estate, relocation)? That informs how much negotiation room exists.
- The area grade is low — what's the realistic commute time and amenity access for the typical tenant pool here? Any planned neighborhood developments (good or bad) we should know about?
- What's the average days-on-market for RENTAL listings here right now (not sales)? A rising rental-DOM trend means longer vacancies and softer asking-rent achievability than the comps imply.
- What's the recent tenant-quality profile in this submarket — average credit score on applications, eviction rate, late-payment / NSF rate, and stable-employment percentage? A property-management company in the area should have these aggregated.
- How much new for-sale + rental construction is in the pipeline within 1–3 miles? Heavy new supply typically softens prices + rents 12–24 months out; constrained supply supports both.
Investment metrics
- 1% rule
- 0.77% ✗
- Cap rate
- 5.83%
- Cash-on-cash
- -1.65%
- DSCR
- 0.93
- GRM
- 10.8
CMA / ARV
- ARV (median comp)
- $366,982
- List price
- $299,900
- Delta
- -18.28%
- Verdict
- UNDERPRICED
- Comps
- 4 within 1.0 mi
Show comp detail 9 sales within ~0.75 mi
| Address | Dist | Beds/Ba | Sqft | Sold | Price | $/sf | Match |
|---|---|---|---|---|---|---|---|
| 1745 NE 6th St | 0.34mi | 3/2.0 | 1,296 (0%) | 1mo | $379,900 | $293 | 84 |
| 2051 NE Uintah Ct | 0.14mi | 3/2.0 | 1,415 (+9%) | 1mo | $380,000 | $269 | 77 |
| 841 NE Shoshone Dr | 0.07mi | 3/2.0 | 1,188 (-8%) | 9mo | $359,000 | $302 | 75 |
| 754 NE Navaho Ct NE | 0.05mi | 3/2.0 | 1,188 (-8%) | 12mo | $345,000 | $290 | 74 |
| 1825 NE 6th St | 0.31mi | 3/2.0 | 1,296 (0%) | 15mo | $346,000 | $267 | 73 |
| 854 NE Cheyenne Dr | 0.05mi | 3/2.0 | 1,188 (-8%) | 18mo | $370,000 | $311 | 68 |
| 833 NE Shoshone Dr | 0.04mi | 3/2.0 | 1,166 (-10%) | 16mo | $355,000 | $304 | 68 |
| 1620 NE 6th St | 0.38mi | 2/3.0 (-1) | 1,340 (+3%) | 2mo | $297,000 | $222 | 66 |
| 708 NE Ute Ct | 0.10mi | 3/2.0 | 1,381 (+7%) | 22mo | $380,000 | $275 | 66 |
Match score weights: distance 35% · size 25% · config 20% · recency 20%. Top-matched comps best support the ARV.
Projected returns pro-forma
-3.0% appreciation · 3.39% rent growth · sell at horizon
- IRR
- -18.6%
- Equity multiple
- 0.34×
- Total profit
- $-55,059
- Equity at exit
- $44,716
- IRR
- -10.4%
- Equity multiple
- 0.36×
- Total profit
- $-53,774
- Equity at exit
- $25,930
Cash invested: $83,972 (down + closing). Projections, not guarantees.
Landlord ↔ Tenant lean methodology
- Overall (STATE)
- 28 Tenant-Leaning
- State Oregon
- 28 Tenant-Leaning · D+6
- County
- — inherits STATE
- City
- — inherits STATE
ZIP-level market 97756
- Rents YoY
- 3.4%
- Active inventory
- 737
- Price-to-rent
- 10.8×
Monthly cashflow live
- Estimated rent
- $2,322 high interval (Pro) →
- Mortgage (P&I)
- −$1,573
- Tax from tax record
- −$120 /mo · $1,436/yr
- Insurance
- −$125
- HOA
- −$132
- Vacancy / Maint / Mgmt
- −$488
- Net cashflow
- $-115
Break-even live
Sensitivity live
| Price | -10% $55 | -5% $-30 | +0% $-115 | +5% $-200 | +10% $-285 |
|---|---|---|---|---|---|
| Rent | -10% $-299 | -5% $-207 | +0% $-115 | +5% $-23 | +10% $68 |
| Rate | -1.0pp $36 | -0.5pp $-39 | base $-115 | +0.5pp $-193 | +1.0pp $-272 |
UW: 25.0% down · 7.5% · 30yr · 1.5% tax · 5.0% vac · 8.0% maint · 8.0% mgmt
Financing live
Cash to close
- Down payment
- $74,975
- Closing costs
- $8,997
- Reserves months
- —
- Total cash needed
- —
Loan-product check · same deal, 3 products live
Conventional
25% down · 7.5% · 30yr
- Down + closing
- —
- Monthly P&I
- —
- Monthly cashflow
- —
- DSCR
- —
- Eligible?
- —
Personal DTI + credit; lowest rate.
DSCR
20% down · 8.5% · 30yr
- Down + closing
- —
- Monthly P&I
- —
- Monthly cashflow
- —
- DSCR
- —
- Eligible?
- —
No personal income docs; deal must DSCR.
Hard money
10% down · 12.0% · 12mo
- Down + closing
- —
- Monthly P&I
- —
- Monthly cashflow
- —
- DSCR
- —
- Eligible?
- —
Short-term bridge; refi at stabilization.
Rent comps 8 comps
| Address | Beds | Baths | Sqft | Rent | $/sqft | DOM | Units | Dist |
|---|---|---|---|---|---|---|---|---|
| 625 NE Redwood Ave Redmond, OR | 3.0 | 2.0 | 1536 | $2,500 | $1.63 | 22d | 1 | 0.34mi |
| 2452 NW 8th St Redmond, OR | 3.0 | 2.5 | 1461 | $2,225 | $1.52 | 45d | 1 | 0.87mi |
| 2708 NW 8th St Unit 2708 Redmond, OR | 3.0 | 2.0 | 1140 | $1,995 | $1.75 | 22d | 1 | 0.91mi |
| 3025 NW 7th St Redmond, OR | 1.0–3.0 | 1.0–2.0 | 850 | $2,050 | $2.41 | 15d | 17 | 0.96mi |
| 940 NW Oak Ln Redmond, OR | 3.0 | 2.0 | 1552 | $2,495 | $1.61 | 22d | 1 | 0.96mi |
| 341 NW Hemlock Ct Unit 341 Redmond, OR | 3.0 | 2.0 | 1008 | $1,950 | $1.93 | 22d | 1 | 1.06mi |
| 123 W Antler Ave Unit 1 094 Redmond, OR | 2.0 | 1.5 | 1015 | $1,495 | $1.47 | 45d | 1 | 1.42mi |
| 506 SE Black Butte Redmond, OR | 3.0 | 2.0 | 1800 | $1,895 | $1.05 | 22d | 1 | 1.44mi |
HOA detail
- Monthly dues
- $132 · $1,584/yr
- Likely covers
- landscaping
Listing history 18 events
-
2026-06-17status $299,900 Pending 33 DOM
-
2026-06-17days on market $299,900 Active 33 DOM
-
2026-06-16days on market $299,900 Active 32 DOM
-
2026-06-15days on market $299,900 Active 31 DOM
-
2026-06-14days on market $299,900 Active 29 DOM
-
2026-06-13pricedays on market $299,900 Active 28 DOM
-
2026-06-10days on market $314,900 Active 26 DOM
-
2026-06-09days on market $314,900 Active 25 DOM
-
2026-06-08days on market $314,900 Active 24 DOM
-
2026-06-07days on market $314,900 Active 23 DOM
-
2026-06-02days on market $314,900 Active 18 DOM
-
2026-06-01days on market $314,900 Active 17 DOM
-
2026-05-31days on market $314,900 Active 16 DOM
-
2026-05-30days on market $314,900 Active 15 DOM
-
2026-05-15$329,900 Active 807-char remark
-
2006-02-28soldstatus $42,900
-
2006-01-16historical
-
2003-10-06$45,900
ⓘ Source: listings_history table (triggers on properties + properties_extension) + one-shot
backfill from property_details.listing_events for pre-trigger history.
Tax reassessment forecast OR · Resets to sale price
- Current annual tax
- $1,436 · $120/mo
- Projected year-2 tax
- $2,909 · $242/mo
- Expected delta
- +$1,473/yr (+$123/mo · 102.5%)
ⓘ Screening estimate from a state-policy table — verify with the county assessor before closing.
Climate risk First Street
- Flood 1/10 Low FEMA zone X (unshaded) · 0% chance over 30 yrs
- Wildfire 6/10 Major
- Heat 3/10 Moderate 7 d/yr ≥92°F today · 16 d/yr by 30 yrs out
- Wind 1/10 Low
- Air quality 10/10 Extreme 22 unhealthy d/yr today · 25 by 30 yrs out
Nearby sold comps map
Loading sold comps map…
Walkable amenities ~0.75 mi
Loading nearby amenities…
Taxation est. · year 1
- Rental income
- $27,861
- − Mortgage interest
- −$16,799
- − Property taxes
- −$1,436
- − Insurance
- −$1,500
- − Repairs & maintenance
- −$2,229
- − Management
- −$2,229
- − HOA
- −$1,584
- − Depreciation
- −$8,724
- Taxable loss
- −$6,640
- Est. tax savings @ 24.0%
- +$1,594
- After-tax cash flow
- $211/yr
For passive investors: Depreciation is non-cash, so a rental often shows a tax loss while cash-flowing — sheltering income. Rental losses are passive: they offset passive income freely, and up to $25,000/yr can offset ordinary (W-2) income if you actively participate and your MAGI is under $100k (phasing out to $0 by $150k); unused losses carry forward. On sale, claimed depreciation is recaptured at up to 25%, and gains may owe capital-gains tax (a 1031 exchange can defer both). Figures are a year-1 estimate at your 24.0% rate — not tax advice; consult a CPA.
Schools (NCES district)
- District
- Redmond SD 2J
- NCES district ID
- 4110350
- Math proficiency
- 24% ▼ -19.00%
- Reading proficiency
- 42% ▼ -11.00%
- Median HH income
- $51,027
- Composite
- 28.72/100
- National rank
- #6682
- State rank
- #28 of 58 in OR
Livability — Redmond
- Score
- 78/100
- State rank
- #68
- US rank
- #2715
Category grades
Schools grade is shown separately in the Schools card above.
Census & demographics
- Census place
- Redmond, OR
- County
- Deschutes County · 197,892 people
- City population
- 44,914
- Metro
- Bend, OR
- Population (ZIP)
- 44,914
- Household income
- $87,278
- Rent vs Own
- Severe rent burden
- 1205.0
Population outlook (Deschutes County) Hauer SSP2
- Today (2025)
- 213,908 people
- By 2030
- 232,387 · +8.6%
- By 2040
- 265,858 · +24.3%
- By 2050
- 295,286 · +38.0%
- By 2075
- 353,553 · +65.3%
- By 2100
- 380,293 · +77.8%
Race, ethnicity, and origin ACS 2023
- Neighborhood character
- Predominantly White (82%)
- Race & ethnicity
- White 82% Hispanic / Latino 13% Two or more races 4% Native American 2%
- Hispanic origin (detail)
- Mexican 10%
- Common ancestry
- Italian 5% Portuguese 4% Slovak 4%
- Foreign-born
- 6% · Canada, South Korea
- Languages at home
- 90% English-only · Spanish 8% Russian/Polish/Slavic 1%
Political lean MEDSL · Deschutes
- 2024 margin
- D (+10.1) · D 53.6% · R 43.5% · Other 2.8%
- 2008→2024 swing
- +10.4pp toward D · 2008: -0.3pp · 2024: 10.1pp
- All cycles
- 2024: D+10.1 2020: D+8.2 2016: R+3.8 2012: R+7.3 2008: R+0.3
Not yet ingested
- Civics
- —
Market trends
- HPI YoY
- ▼ -292.28%
- Current HPI
- 385.3027
- Rent YoY
- ▲ 3.39%
- Metro
- Bend, OR
- State GDP YoY
- ▲ 2.05%
- F500 in state
- 2
Industry mix (Fortune 500 HQ in OR)
| Industry | F500 HQs | Revenue |
|---|---|---|
| Consumer Goods | 1 | $51B |
|
||
Price history
+553.4% since first listed7 events — show timeline
- 2026-06-17 Pending — MLSCO
- 2026-06-11 Price Changed $299,900 MLSCO
- 2026-05-29 Price Changed $314,900 MLSCO
- 2026-05-15 Listed $329,900 MLSCO
- 2006-02-28 Sold (MLS) $42,900 MLSCO
- 2006-01-16 Listing Removed — MLSCO
- 2003-10-06 Listed $45,900 MLSCO
Property tax history
+4.7%/yrLatest (2025): $1,436 · +7.4% YoY. Source: county tax records.
Cash-flow waterfall
monthlySold comps — $/sqft
last 12 mo · ≤1 miLoading sold comps…