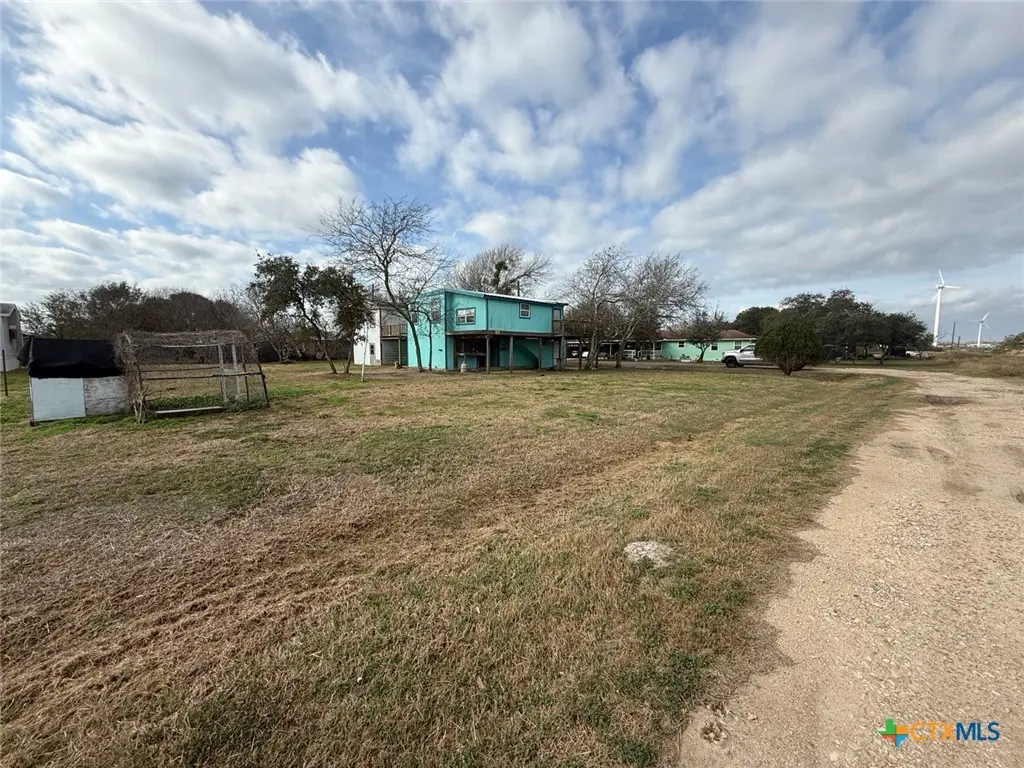
301 E Fern · Seadrift, TX
Flood risk 8/10 · Major
- FEMA flood zone
- X (shaded)
- Chance of flooding over 30 yrs
- 0.97%
- Est. flood insurance / yr
- $507 – $1,088
Fire risk 6/10 · Moderate
- Est. fire insurance / yr
- $1,222 – $2,270
Heat risk 10/10 · Severe
- Hot days now (above 109°F)
- 7 days/yr
- Hot days in 30 yrs
- 26 days/yr
Wind risk 9/10 · Severe
- Chance of severe wind over 30 yrs
- 99.0%
Air-quality risk 1/10 · Minimal
- Unhealthy air days now
- 0 days/yr
- Unhealthy air days in 30 yrs
- 0 days/yr
Risk factors via First Street. Map © Google.
Why this score? — see what drove the D+ grade
The composite is a weighted blend of 9 inputs, each scored 0–100. Each bar is that input's sub-score; the figure is the points it added to the 100-point composite (weight × sub-score).
- ARV discount +13.3/15.0
- Cash flow +8.3/30.0
- Appreciation +6.6/10.0
- Schools +3.7/10.0
- Livability +3.6/5.0
- 1% rule +2.5/10.0
- Rent growth +2.5/5.0
- Condition / age +2.5/5.0
- DSCR +2.3/10.0
$107,000
🖨 Deal sheet (PDF) 📄 Offer letter ✓ Due diligence
Listing remarks MLS
Owner financing Available, Opportunity awaits with this 3-bedroom, 2-bath home situated on approximately 1.5 lots in the heart of Seadrift, Texas. This handyman special is perfect for investors, flippers, or buyers looking to put their personal touch on a coastal property. The home features central air and heat and a durable metal roof already in place. With plenty of outdoor space, the oversized lot offers room for boat parking, expansion, or future improvements. Located just minutes from the bay, you’ll enjoy easy access to fishing, boating, and all the coastal charm Seadrift has to offer. If you’re looking for a project with potential near the water, this is it! Bring your vision and make it your own.
Key facts
- Durable metal roof
- Boat parking
- Central air and heat
Tags
Neighborhood map
What this means for you Summary
Snapshot
- This is a 1-bed/1.0-bath single-family listed at $107k.
Deal economics
- At list price, monthly cash flow is $-164 ($-2k/yr) — negative.
- To cash-flow at today's rent, offer at most $78k (27.0% below list).
- To meet the 1% rule (rent ≥ 1% of price), the offer needs to be $80k (25.3% below list).
- Recommended offer: $78k (27.0% below list) — sets the bar for cash-flow.
- Cap rate 5.2% vs local median 2.1% in Seadrift — top-decile yield for the area; either an underpriced asset or a hidden risk that comps aren't pricing in. Stress-test before assuming the spread holds.
Location & tenants
- Location reads 71/100 on livability (#333 in TX) — a middle-class / working-renter tenant base. Strengths: crime A+, cost of living A+, health & safety A+; Watch: amenities F, commute F, employment F.
- Calhoun County ISD (town): math 44% / reading 43% proficiency, ranked #293 of 826 in TX (top 36%) — families likely to look elsewhere, expect single-tenant / working-renter base with shorter leases.
- Zoned schools: Seadrift School (math 47% / reading 42%, grade F, #1,155 of 4,322 statewide, top 29%, 237 students, 63% FRL); Travis Middle (math 26% / reading 34%, grade F, #1,056 of 1,662 statewide, top 65%, 702 students, 74% FRL); Calhoun H S (math 53% / reading 38%, grade D-, #634 of 1,632 statewide, top 39%, 987 students, 51% FRL).
- Market conditions: 117 active listings in the ZIP; 1 comparable units currently listed for rent nearby; 95 units permitted in Calhoun County in 2024 (0 in 5+ unit buildings).
Forward outlook
- In year one you build about $4k of equity ($740 loan paydown + $3k appreciation (3.2% local appreciation)).
- Calhoun County population projected at +12% by 2050 — modest demand growth; plan on rents tracking national, not racing it.
- By year 8, paydown + projected appreciation supports a ~$31k cash-out refi (75% LTV) — recoverable capital for the next deal without selling this one.
Negotiation context
- It's been on market 121 days — a 12% lower offer ($94k) is reasonable based on typical stale-listing flexibility.
Risks & watch-outs
- Watch-outs: flood insurance adds $66/mo.
- Climate carrying-cost: severe flood risk; severe wind risk, 99% chance of damaging wind over 30y; major wildfire risk; extreme-heat days projected 7→26/yr by 2055 (HVAC capex compounding) — expect insurance premiums to compound above CPI over the hold.
Questions for the listing agent
- What do current leases actually rent for vs. the listed asking? Can we see a recent rent roll and the last 12 months of T-12 income?
- It's been on market 121 days. Have you received any prior offers? Is the seller open to a 27% concession, seller financing, or rate buy-down credit?
- What's the actual annual flood-insurance premium (NFIP or private), and is the property in a SFHA with mandatory coverage?
- Why hasn't it sold? Are there any deal-killer items the seller is aware of (foundation, flood, title, zoning, code violations)?
- Is there a deadline driving the sale (1031 exchange, divorce, estate, relocation)? That informs how much negotiation room exists.
- Schools are F-rated, which usually means shorter tenancies and higher turnover. Who's the typical renter profile here, and what's been the actual vacancy rate?
- The area grade is low — what's the realistic commute time and amenity access for the typical tenant pool here? Any planned neighborhood developments (good or bad) we should know about?
- What's the average days-on-market for RENTAL listings here right now (not sales)? A rising rental-DOM trend means longer vacancies and softer asking-rent achievability than the comps imply.
- What's the recent tenant-quality profile in this submarket — average credit score on applications, eviction rate, late-payment / NSF rate, and stable-employment percentage? A property-management company in the area should have these aggregated.
- How much new for-sale + rental construction is in the pipeline within 1–3 miles? Heavy new supply typically softens prices + rents 12–24 months out; constrained supply supports both.
Investment metrics
- 1% rule
- 0.75% ✗
- Cap rate
- 5.20%
- Cash-on-cash
- -3.90%
- DSCR
- 0.83
- GRM
- 11.2
CMA / ARV
- ARV (median comp)
- $122,734
- List price
- $107,000
- Delta
- -12.82%
- Verdict
- UNDERPRICED
- Comps
- 3 within 1.0 mi
Projected returns pro-forma
3.2% appreciation · 3.0% rent growth · sell at horizon
- IRR
- 2.1%
- Equity multiple
- 1.12×
- Total profit
- $3,624
- Equity at exit
- $49,302
- IRR
- 5.6%
- Equity multiple
- 1.88×
- Total profit
- $26,222
- Equity at exit
- $76,919
Cash invested: $29,960 (down + closing). Projections, not guarantees.
Landlord ↔ Tenant lean methodology
- Overall (STATE)
- 87 Strongly Landlord-Friendly
- State Texas
- 87 Strongly Landlord-Friendly · R+5
- County
- — inherits STATE
- City
- — inherits STATE
ZIP-level market 77983
- Home prices YoY
- 2.0%
- Active inventory
- 117
- Price-to-rent
- 11.2×
Monthly cashflow live
- Estimated rent
- $799 medium interval (Pro) →
- Mortgage (P&I)
- −$561
- Tax from tax record
- −$123 /mo · $1,474/yr
- Insurance
- −$45
- Flood insurance flood zone
- −$66 /mo · $798/yr
- HOA
- −$0
- Vacancy / Maint / Mgmt
- −$168
- Net cashflow
- $-164
Break-even live
Sensitivity live
| Price | -10% $-103 | -5% $-133 | +0% $-164 | +5% $-194 | +10% $-224 |
|---|---|---|---|---|---|
| Rent | -10% $-227 | -5% $-195 | +0% $-164 | +5% $-132 | +10% $-101 |
| Rate | -1.0pp $-110 | -0.5pp $-137 | base $-164 | +0.5pp $-192 | +1.0pp $-220 |
UW: 25.0% down · 7.5% · 30yr · 1.5% tax · 5.0% vac · 8.0% maint · 8.0% mgmt
Financing live
Cash to close
- Down payment
- $26,750
- Closing costs
- $3,210
- Reserves months
- —
- Total cash needed
- —
Loan-product check · same deal, 3 products live
Conventional
25% down · 7.5% · 30yr
- Down + closing
- —
- Monthly P&I
- —
- Monthly cashflow
- —
- DSCR
- —
- Eligible?
- —
Personal DTI + credit; lowest rate.
DSCR
20% down · 8.5% · 30yr
- Down + closing
- —
- Monthly P&I
- —
- Monthly cashflow
- —
- DSCR
- —
- Eligible?
- —
No personal income docs; deal must DSCR.
Hard money
10% down · 12.0% · 12mo
- Down + closing
- —
- Monthly P&I
- —
- Monthly cashflow
- —
- DSCR
- —
- Eligible?
- —
Short-term bridge; refi at stabilization.
Rent comps 1 comps
| Address | Beds | Baths | Sqft | Rent | $/sqft | DOM | Units | Dist |
|---|---|---|---|---|---|---|---|---|
| 1310 Broadway Ave Seadrift, TX | 2.0 | 1.0 | 672 | $799 | $1.19 | 45d | 1 | 1.35mi |
Listing history 16 events
-
2026-06-18status $107,000 Pending 121 DOM
-
2026-06-18days on market $107,000 Active 121 DOM
-
2026-06-17days on market $107,000 Active 120 DOM
-
2026-06-16days on market $107,000 Active 119 DOM
-
2026-06-15days on market $107,000 Active 118 DOM
-
2026-06-13days on market $107,000 Active 116 DOM
-
2026-06-12days on market $107,000 Active 115 DOM
-
2026-06-09days on market $107,000 Active 112 DOM
-
2026-06-08days on market $107,000 Active 111 DOM
-
2026-06-08days on market $107,000 Active 110 DOM
-
2026-06-07days on market $107,000 Active 109 DOM
-
2026-06-03days on market $107,000 Active 106 DOM
-
2026-06-02days on market $107,000 Active 105 DOM
-
2026-06-01days on market $107,000 Active 104 DOM
-
2026-05-31days on market $107,000 Active 103 DOM
-
2026-02-17$107,000 Active 725-char remark
Show marketing remark (725 chars)
Owner financing Available, Opportunity awaits with this 3-bedroom, 2-bath home situated on approximately 1.5 lots in the heart of Seadrift, Texas. This handyman special is perfect for investors, flippers, or buyers looking to put their personal touch on a coastal property. The home features central air and heat and a durable metal roof already in place. With plenty of outdoor space, the oversized lot offers room for boat parking, expansion, or future improvements. Located just minutes from the bay, you’ll enjoy easy access to fishing, boating, and all the coastal charm Seadrift has to offer. If you’re looking for a project with potential near the water, this is it! Bring your vision and make it your own.
ⓘ Source: listings_history table (triggers on properties + properties_extension) + one-shot
backfill from property_details.listing_events for pre-trigger history.
Tax reassessment forecast TX · Resets to sale price
- Current annual tax
- $1,474 · $123/mo
- Projected year-2 tax
- $1,958 · $163/mo
- Expected delta
- +$484/yr (+$40/mo · 32.8%)
ⓘ Screening estimate from a state-policy table — verify with the county assessor before closing.
Climate risk First Street
- Flood 8/10 Severe FEMA zone X (shaded) · 97% chance over 30 yrs
- Wildfire 6/10 Major
- Heat 10/10 Extreme 7 d/yr ≥109°F today · 26 d/yr by 30 yrs out
- Wind 9/10 Extreme 99% chance of damaging wind over 30 yrs
- Air quality 1/10 Low 0 unhealthy d/yr today · 0 by 30 yrs out
Nearby sold comps map
Loading sold comps map…
Walkable amenities ~0.75 mi
Loading nearby amenities…
Taxation est. · year 1
- Rental income
- $9,588
- − Mortgage interest
- −$5,994
- − Property taxes
- −$1,474
- − Insurance
- −$1,332
- − Repairs & maintenance
- −$767
- − Management
- −$767
- − Depreciation
- −$3,113
- Taxable loss
- −$3,859
- Est. tax savings @ 24.0%
- +$926
- After-tax cash flow
- $-1,039/yr
For passive investors: Depreciation is non-cash, so a rental often shows a tax loss while cash-flowing — sheltering income. Rental losses are passive: they offset passive income freely, and up to $25,000/yr can offset ordinary (W-2) income if you actively participate and your MAGI is under $100k (phasing out to $0 by $150k); unused losses carry forward. On sale, claimed depreciation is recaptured at up to 25%, and gains may owe capital-gains tax (a 1031 exchange can defer both). Figures are a year-1 estimate at your 24.0% rate — not tax advice; consult a CPA.
Schools (NCES district)
- District
- Calhoun County ISD
- NCES district ID
- 4812480
- Math proficiency
- 44% ▼ -10.00%
- Reading proficiency
- 43% ▼ -2.00%
- Median HH income
- $48,588
- Composite
- 37.27/100
- National rank
- #4453
- State rank
- #293 of 826 in TX
Livability — Seadrift
- Score
- 71/100
- State rank
- #333
- US rank
- #7319
Category grades
Schools grade is shown separately in the Schools card above.
Census & demographics
- Census place
- Seadrift, TX
- Population (ZIP)
- 2,707
Population outlook (Calhoun County) Hauer SSP2
- Today (2025)
- 23,512 people
- By 2030
- 24,183 · +2.9%
- By 2040
- 25,370 · +7.9%
- By 2050
- 26,388 · +12.2%
- By 2075
- 28,014 · +19.1%
- By 2100
- 26,314 · +11.9%
Race, ethnicity, and origin ACS 2023
- Neighborhood character
- Majority White (59%)
- Race & ethnicity
- White 59% Hispanic / Latino 37% Two or more races 20%
- Hispanic origin (detail)
- Mexican 34%
- Common ancestry
- Romanian 2% Slovak 2% Russian 1%
- Foreign-born
- 9% · Canada
- Languages at home
- 82% English-only · Spanish 18%
Political lean MEDSL · Calhoun
- 2024 margin
- Solid R (+52.2) · D 23.7% · R 75.8%
- 2008→2024 swing
- -32.2pp toward R · 2008: -20.0pp · 2024: -52.2pp
- All cycles
- 2024: R+52.2 2020: R+44.5 2016: R+36.2 2012: R+24.2 2008: R+20.0
Not yet ingested
- Civics
- —
Market trends
- HPI YoY
- ▲ 3.20%
- Current HPI
- 159.3392
- Rent YoY
- —
- Metro
- —
- State GDP YoY
- ▲ 3.95%
- F500 in state
- 110
Industry mix (Fortune 500 HQ in TX)
| Industry | F500 HQs | Revenue |
|---|---|---|
| Energy | 16 | $1,198B |
|
||
| Technology | 5 | $198B |
|
||
| Engineering / Construction | 4 | $72B |
|
||
| Energy Services | 3 | $60B |
|
||
| Utilities | 3 | $41B |
|
||
| Healthcare | 2 | $330B |
|
||
Price history
1 event — show timeline
- 2026-02-17 Listed $107,000 CTXMLS
Property tax history
+2.7%/yrLatest (2025): $1,474 · +27.0% YoY. Source: county tax records.
Cash-flow waterfall
monthlySold comps — $/sqft
last 12 mo · ≤1 miLoading sold comps…