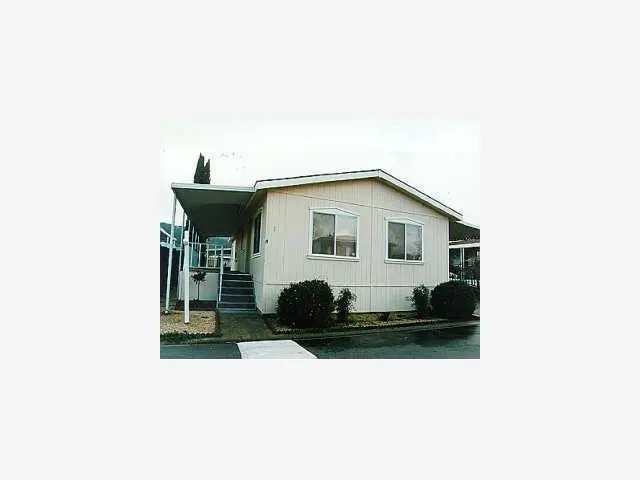
500 W Tenth St #29 · Gilroy, CA
Flood risk 7/10 · Major
- FEMA flood zone
- X
- Chance of flooding over 30 yrs
- 0.75%
- Est. flood insurance / yr
- $507 – $1,088
Fire risk 5/10 · Moderate
- Est. fire insurance / yr
- $659 – $1,223
Heat risk 3/10 · Minor
- Hot days now (above 98°F)
- 7 days/yr
- Hot days in 30 yrs
- 14 days/yr
Wind risk 1/10 · Minimal
- Chance of severe wind over 30 yrs
- —
Air-quality risk 8/10 · Major
- Unhealthy air days now
- 16 days/yr
- Unhealthy air days in 30 yrs
- 16 days/yr
Risk factors via First Street. Map © Google.
Why this score? — see what drove the C- grade
The composite is a weighted blend of 9 inputs, each scored 0–100. Each bar is that input's sub-score; the figure is the points it added to the 100-point composite (weight × sub-score).
- Cash flow +22.9/30.0
- DSCR +7.4/10.0
- 1% rule +6.0/10.0
- Schools +4.4/10.0
- Rent growth +3.7/5.0
- Livability +3.6/5.0
- ARV discount +2.6/15.0
- Condition / age +2.5/5.0
- Appreciation +0.0/10.0
$280,000
🖨 Deal sheet (PDF) 📄 Offer letter ✓ Due diligence
Listing remarks MLS
AFFORDABLE living opportunity in the desirable Pacific Mobile Estates community! This spacious double-wide manufactured home offers approximately 1,344 square feet of living space with 2 bedrooms and 2 full bathrooms, including a large primary suite with walk-in closet and private bath. The functional floor plan features a bright living area, dining space, and a well-sized kitchen with ample cabinetry and indoor laundry hookups.This home offers great potential and is ready for your personal touches and TLC to make it shine again. Additional features include central heating and air conditioning, covered carport parking, and extra storage space. Located in the all-ages Pacific Mobile Estates community, residents enjoy access to amenities including a clubhouse, swimming pool, and recreational facilities, all conveniently close to shopping, dining, and major commuter routes. This is also a pet friendly community. A fantastic opportunity for affordable living in Gilroy!
Key facts
- Well-sized kitchen
- Bright living area
- Ample cabinetry
Tags
Property features AI
Finance
- Other: No age restrictions; family park; pets allowed
- HOA & community: Clubhouse; Community pool
Exterior
- Parking: Carport (space #29, rented separately)
- Utilities: Public water; Public sewer
- Home design: Single-story; Leased land (park home site)
- Exterior features: Composition roof; Public utilities
Interior
- Kitchen: Dishwasher; Gas range/oven; Refrigerator
- Bedrooms: 2 bedrooms
- Flooring: Laminate flooring; Tile flooring
- Bathrooms: 2 full bathrooms; Tile finishes; Stall shower
- Heating & cooling: Central forced air heating; Central forced air cooling; Ceiling fan
- Interior features: Walk-in closet; Laundry hookups only; Storage
- Laundry & utility: Laundry hookups only
Neighborhood map
What this means for you Summary
Snapshot
- This is a 2-bed/2.0-bath manufactured listed at $280k.
Deal economics
- At list price, monthly cash flow is $426 ($5k/yr) — positive.
- The deal already cash-flows at list — no discount required.
- Meets the 1% rule at list price ($3k rent vs $280k).
- Recommended offer: $276k (1.5% below list) — sets the bar for market timing.
- Cap rate 8.4% vs local median 1.8% in Gilroy — top-decile yield for the area; either an underpriced asset or a hidden risk that comps aren't pricing in. Stress-test before assuming the spread holds.
Location & tenants
- Location reads 71/100 on livability (#206 in CA) — a middle-class / working-renter tenant base. Strengths: amenities A+, employment A+, health & safety A+; Watch: crime D-, cost of living F.
- Gilroy Unified (suburban): math 41% / reading 48% proficiency, ranked #477 of 1,400 in CA (top 34%) — families likely to look elsewhere, expect single-tenant / working-renter base with shorter leases.
- Zoned schools: Glen View Elementary (487 students, 76% FRL); Gilroy High (1,739 students, 49% FRL).
- Market conditions: Rents rising fast (+4.8%/yr); 164 active listings in the ZIP; 11 comparable units currently listed for rent nearby; rentals at typical pace (median 25d on market — plan ~3-4 weeks tenant-placement turnaround); 45% of comp listings sitting > 30 days — soft ceiling on asking rent; high-income renter base; 3,838 units permitted in Santa Clara County in 2024 (1,886 in 5+ unit buildings).
Forward outlook
- Local home prices are declining (-3.0%/yr); year-one equity from $2k of loan paydown is wiped out by about $8k of value loss. Plan a longer hold.
- Santa Clara County population projected at +24% by 2050 — long-run rental-demand tailwind backs the buy-and-hold thesis.
Negotiation context
- It's been on market 17 days — a 2% lower offer ($276k) is reasonable based on typical stale-listing flexibility.
- 8 sale attempts since 28y ago with the ask held roughly flat each time — persistent listings suggest the price (not the market) is what's stuck; bring a comps-based counter.
- Current owner paid $89k; list at $280k implies a 215% gain — meaningful room to come down on a strong offer.
Risks & watch-outs
- Watch-outs: flood insurance adds $66/mo.
- Climate carrying-cost: major flood risk; moderate wildfire risk — expect insurance premiums to compound above CPI over the hold.
Questions for the listing agent
- What's the actual annual flood-insurance premium (NFIP or private), and is the property in a SFHA with mandatory coverage?
- Is there a deadline driving the sale (1031 exchange, divorce, estate, relocation)? That informs how much negotiation room exists.
- Crime grade is D in this area — have there been break-ins, vandalism, or insurance claims at this property in the last 3 years? What carrier currently insures it and at what premium?
- What's the average days-on-market for RENTAL listings here right now (not sales)? A rising rental-DOM trend means longer vacancies and softer asking-rent achievability than the comps imply.
- What's the recent tenant-quality profile in this submarket — average credit score on applications, eviction rate, late-payment / NSF rate, and stable-employment percentage? A property-management company in the area should have these aggregated.
- How much new for-sale + rental construction is in the pipeline within 1–3 miles? Heavy new supply typically softens prices + rents 12–24 months out; constrained supply supports both.
Investment metrics
- 1% rule
- 1.10% ✓
- Cap rate
- 8.41%
- Cash-on-cash
- 7.54%
- DSCR
- 1.34
- GRM
- 7.6
CMA / ARV
- ARV (on-the-fly)
- $252,672
- Comps found
- 5
Show comp detail 5 sales within ~0.75 mi
| Address | Dist | Beds/Ba | Sqft | Sold | Price | $/sf | Match |
|---|---|---|---|---|---|---|---|
| 500 W 10th St, Spc#177 #177 | 0.00mi | 2/2.0 | 1,440 (+7%) | 3mo | $250,000 | $174 | 86 |
| 500 W 10th St #79 | 0.00mi | 3/2.0 (+1) | 1,414 (+5%) | 1mo | $397,000 | $281 | 85 |
| 500 W 10th St #10 | 0.00mi | 2/2.0 | 1,440 (+7%) | 6mo | $270,000 | $188 | 83 |
| 500 W 10th St #73 | 0.05mi | 3/2.0 (+1) | 1,440 (+7%) | 7mo | $225,000 | $156 | 75 |
| 500 West 10th St #112 | 0.07mi | 3/2.0 (+1) | 1,485 (+10%) | 2mo | $475,000 | $320 | 73 |
Match score weights: distance 35% · size 25% · config 20% · recency 20%. Top-matched comps best support the ARV.
Projected returns pro-forma
-3.0% appreciation · 4.77% rent growth · sell at horizon
- IRR
- -4.2%
- Equity multiple
- 0.84×
- Total profit
- $-12,557
- Equity at exit
- $41,749
- IRR
- 7.5%
- Equity multiple
- 1.61×
- Total profit
- $48,088
- Equity at exit
- $24,209
Cash invested: $78,400 (down + closing). Projections, not guarantees.
Landlord ↔ Tenant lean methodology
- Overall (STATE)
- 18 Strongly Tenant-Friendly
- State California
- 18 Strongly Tenant-Friendly · D+13
- County
- — inherits STATE
- City
- — inherits STATE
ZIP-level market 95020
- Rents YoY
- 4.8%
- Active inventory
- 164
- Price-to-rent
- 7.6×
Monthly cashflow live
- Estimated rent
- $3,073 high interval (Pro) →
- Mortgage (P&I)
- −$1,468
- Tax est. 1.5%
- −$350 /mo · $4,200/yr
- Insurance
- −$117
- Flood insurance flood zone
- −$66 /mo · $798/yr
- HOA
- −$0
- Vacancy / Maint / Mgmt
- −$645
- Net cashflow
- $426
Break-even live
Sensitivity live
| Price | -10% $620 | -5% $523 | +0% $426 | +5% $330 | +10% $233 |
|---|---|---|---|---|---|
| Rent | -10% $184 | -5% $305 | +0% $426 | +5% $548 | +10% $669 |
| Rate | -1.0pp $567 | -0.5pp $498 | base $426 | +0.5pp $354 | +1.0pp $280 |
UW: 25.0% down · 7.5% · 30yr · 1.5% tax · 5.0% vac · 8.0% maint · 8.0% mgmt
Financing live
Cash to close
- Down payment
- $70,000
- Closing costs
- $8,400
- Reserves months
- —
- Total cash needed
- —
Loan-product check · same deal, 3 products live
Conventional
25% down · 7.5% · 30yr
- Down + closing
- —
- Monthly P&I
- —
- Monthly cashflow
- —
- DSCR
- —
- Eligible?
- —
Personal DTI + credit; lowest rate.
DSCR
20% down · 8.5% · 30yr
- Down + closing
- —
- Monthly P&I
- —
- Monthly cashflow
- —
- DSCR
- —
- Eligible?
- —
No personal income docs; deal must DSCR.
Hard money
10% down · 12.0% · 12mo
- Down + closing
- —
- Monthly P&I
- —
- Monthly cashflow
- —
- DSCR
- —
- Eligible?
- —
Short-term bridge; refi at stabilization.
Rent comps 11 comps
| Address | Beds | Baths | Sqft | Rent | $/sqft | DOM | Units | Dist |
|---|---|---|---|---|---|---|---|---|
| 635 Glenview Ct Gilroy, CA | 3.0 | 2.0 | 1212 | $3,800 | $3.14 | 5d | 1 | 0.16mi |
| 7050 Princevalle St Unit D Gilroy, CA | 2.0 | 1.0 | 900 | $2,350 | $2.61 | 45d | 1 | 0.27mi |
| 7060 Princevalle St Unit D Gilroy, CA | 2.0 | 1.0 | 900 | $2,400 | $2.67 | 45d | 1 | 0.29mi |
| 7060 Princevalle St Unit A Gilroy, CA | 2.0 | 1.0 | 900 | $2,550 | $2.83 | 45d | 1 | 0.29mi |
| 7600 Monterey St #201 Gilroy, CA | 2.0 | 2.0 | 1076 | $2,495 | $2.32 | 45d | 1 | 0.89mi |
| 975 Perrelli St Gilroy, CA | 3.0 | 2.0 | 1424 | $3,699 | $2.60 | 9d | 1 | 1.03mi |
| 5485 Mesa Rd Gilroy, CA | 3.0 | 2.0 | 1696 | $4,000 | $2.36 | 25d | 1 | 1.28mi |
| 766 1st St Gilroy, CA | 2.0 | 1.5 | 940 | $2,910 | $3.10 | 0d | 3 | 1.29mi |
| 508 La Sierra Way Gilroy, CA | 2.0 | 1.0 | 1040 | $3,495 | $3.36 | 4d | 1 | 1.37mi |
| 1088 Montebello Dr Gilroy, CA | 3.0 | 2.0 | 1200 | $3,300 | $2.75 | 45d | 1 | 1.46mi |
| 7640 Santa Barbara Dr Gilroy, CA | 3.0 | 2.0 | 1748 | $4,100 | $2.35 | 16d | 1 | 1.46mi |
Listing history 22 events
-
2026-06-21days on market $280,000 Active 17 DOM
-
2026-06-18days on market $280,000 Active 14 DOM
-
2026-06-17days on market $280,000 Active 13 DOM
-
2026-06-16days on market $280,000 Active 12 DOM
-
2026-06-15days on market $280,000 Active 11 DOM
-
2026-06-13days on market $280,000 Active 9 DOM
-
2026-06-13days on market $280,000 Active 8 DOM
-
2026-06-09days on market $280,000 Active 5 DOM
-
2026-06-08days on market $280,000 Active 4 DOM
-
2026-06-07statusdays on market $280,000 Active 3 DOM
-
2025-11-22historical
-
2025-10-03price
-
2025-09-10price
-
2025-08-10Active
-
1999-06-28soldstatus $89,000 193-char remark
-
1999-06-28historical 193-char remark
-
1999-05-28soldstatus $89,000 193-char remark
-
1999-05-10$89,000 193-char remark
-
1999-05-10$89,000 193-char remark
-
1998-06-09historical
-
1998-05-07soldstatus $81,000
-
1998-02-14$81,000
ⓘ Source: listings_history table (triggers on properties + properties_extension) + one-shot
backfill from property_details.listing_events for pre-trigger history.
Climate risk First Street
- Flood 7/10 Severe FEMA zone X · 75% chance over 30 yrs
- Wildfire 5/10 Major
- Heat 3/10 Moderate 7 d/yr ≥98°F today · 14 d/yr by 30 yrs out
- Wind 1/10 Low
- Air quality 8/10 Severe 16 unhealthy d/yr today · 16 by 30 yrs out
Nearby sold comps map
Loading sold comps map…
Walkable amenities ~0.75 mi
Loading nearby amenities…
Taxation est. · year 1
- Rental income
- $36,879
- − Mortgage interest
- −$15,684
- − Property taxes
- −$4,200
- − Insurance
- −$2,198
- − Repairs & maintenance
- −$2,950
- − Management
- −$2,950
- − Depreciation
- −$8,145
- Taxable income
- $751
- Est. tax owed @ 24.0%
- −$180
- After-tax cash flow
- $4,937/yr
For passive investors: Depreciation is non-cash, so a rental often shows a tax loss while cash-flowing — sheltering income. Rental losses are passive: they offset passive income freely, and up to $25,000/yr can offset ordinary (W-2) income if you actively participate and your MAGI is under $100k (phasing out to $0 by $150k); unused losses carry forward. On sale, claimed depreciation is recaptured at up to 25%, and gains may owe capital-gains tax (a 1031 exchange can defer both). Figures are a year-1 estimate at your 24.0% rate — not tax advice; consult a CPA.
Schools (NCES district)
- District
- Gilroy Unified
- NCES district ID
- 0615180
- Math proficiency
- 41% ▲ 1.00%
- Reading proficiency
- 48% ▲ 1.00%
- Median HH income
- $82,439
- Composite
- 43.55/100
- National rank
- #6439
- State rank
- #477 of 1400 in CA
Livability — Gilroy
- Score
- 71/100
- State rank
- #206
- US rank
- #6596
Category grades
Schools grade is shown separately in the Schools card above.
Census & demographics
- Census place
- Gilroy, CA
- County
- Santa Clara County · 1,806,974 people
- City population
- 67,181
- Metro
- San Jose-Sunnyvale-Santa Clara, CA
- Population (ZIP)
- 67,181
- Household income
- $137,117
- Rent vs Own
- Severe rent burden
- 1512.0
Population outlook (Santa Clara County) Hauer SSP2
- Today (2025)
- 2,179,074 people
- By 2030
- 2,301,297 · +5.6%
- By 2040
- 2,528,195 · +16.0%
- By 2050
- 2,712,135 · +24.5%
- By 2075
- 2,998,701 · +37.6%
- By 2100
- 2,931,429 · +34.5%
Race, ethnicity, and origin ACS 2023
- Neighborhood character
- Diverse neighborhood (Simpson 0.60)
- Race & ethnicity
- Hispanic / Latino 57% Two or more races 34% White 26% Asian 9% Black 3% Native American 1%
- Hispanic origin (detail)
- Mexican 49% Puerto Rican 1%
- Common ancestry
- Russian 2% Lithuanian 2% Portuguese 1%
- Foreign-born
- 23% · Canada, Vietnam, China
- Languages at home
- 57% English-only · Spanish 34% Other Indo-European 3% Tagalog/Filipino 2%
Political lean MEDSL · Santa Clara
- 2024 margin
- Solid D (+40.0) · D 68.1% · R 28.1% · Other 3.8%
- 2008→2024 swing
- -0.9pp no change · 2008: 40.9pp · 2024: 40.0pp
- All cycles
- 2024: D+40.0 2020: D+47.4 2016: D+52.5 2012: D+42.1 2008: D+40.9
Not yet ingested
- Civics
- —
Market trends
- HPI YoY
- ▼ -896.34%
- Current HPI
- 272.1867
- Rent YoY
- ▲ 4.77%
- Metro
- San Jose-Sunnyvale-Santa Clara, CA
- State GDP YoY
- ▲ 3.21%
- F500 in state
- 116
Industry mix (Fortune 500 HQ in CA)
| Industry | F500 HQs | Revenue |
|---|---|---|
| Technology | 27 | $1,492B |
|
||
| Financial Services | 3 | $174B |
|
||
| Retail | 3 | $44B |
|
||
| Insurance | 3 | $26B |
|
||
| Media / Entertainment | 2 | $115B |
|
||
| Pharmaceuticals / Biotech | 2 | $62B |
|
||
Price history
+245.7% since first listed18 events — show timeline
- 2026-06-06 Relisted — bridgeMLS, Bay East AOR, or Contra Costa AOR
- 2026-06-06 Relisted — MLSListings
- 2026-05-21 Listing Removed — bridgeMLS, Bay East AOR, or Contra Costa AOR
- 2026-05-21 Listing Removed — MLSListings
- 2026-05-20 Listed $280,000 MLSListings
- 2026-05-20 Listed $280,000 bridgeMLS, Bay East AOR, or Contra Costa AOR
- 2025-11-22 Listing Removed — bridgeMLS, Bay East AOR, or Contra Costa AOR
- 2025-10-03 Price Changed — bridgeMLS, Bay East AOR, or Contra Costa AOR
- 2025-09-10 Price Changed — bridgeMLS, Bay East AOR, or Contra Costa AOR
- 2025-08-10 Listed — bridgeMLS, Bay East AOR, or Contra Costa AOR
- 1999-06-28 Sold (MLS) $89,000 bridgeMLS, Bay East AOR, or Contra Costa AOR
- 1999-06-28 Listing Removed — MLSListings
- 1999-05-28 Sold (MLS) $89,000 MLSListings
- 1999-05-10 Listed $89,000 bridgeMLS, Bay East AOR, or Contra Costa AOR
- 1999-05-10 Listed $89,000 MLSListings
- 1998-06-09 Listing Removed — MLSListings
- 1998-05-07 Sold (MLS) $81,000 MLSListings
- 1998-02-14 Listed $81,000 MLSListings
Cash-flow waterfall
monthlySold comps — $/sqft
last 12 mo · ≤1 miLoading sold comps…