 Multi-family
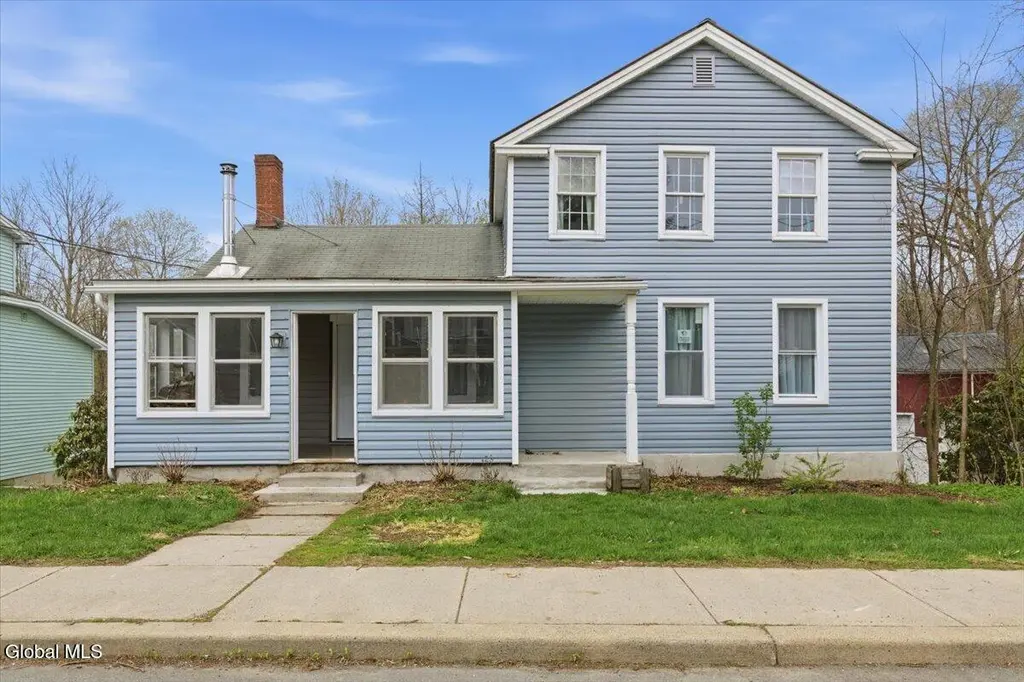
43 Elm St · Nassau, NY
Flood risk 4/10 · Minor
- FEMA flood zone
- X
- Chance of flooding over 30 yrs
- 0.24%
- Est. flood insurance / yr
- $473 – $860
Fire risk 5/10 · Moderate
- Est. fire insurance / yr
- $691 – $1,283
Heat risk 3/10 · Minor
- Hot days now (above 95°F)
- 7 days/yr
- Hot days in 30 yrs
- 17 days/yr
Wind risk 3/10 · Minor
- Chance of severe wind over 30 yrs
- 6.0%
Air-quality risk 2/10 · Minimal
- Unhealthy air days now
- 1 days/yr
- Unhealthy air days in 30 yrs
- 1 days/yr
Risk factors via First Street. Map © Google.
Why this score? — see what drove the C grade
The composite is a weighted blend of 9 inputs, each scored 0–100. Each bar is that input's sub-score; the figure is the points it added to the 100-point composite (weight × sub-score).
- ARV discount +15.0/15.0
- Cash flow +10.2/30.0
- Appreciation +10.0/10.0
- 1% rule +6.3/10.0
- Schools +6.1/10.0
- Livability +3.4/5.0
- DSCR +2.9/10.0
- Rent growth +2.5/5.0
- Condition / age +2.5/5.0
$239,900
🖨 Deal sheet (PDF) 📄 Offer letter ✓ Due diligence
Multi-family units
County records classify this as Multi-Family (2-4 Unit). Listing-text estimate: 1 unit. estimate disagrees with records
Listing remarks
* Lucky You'' Come in and you'll see classic charm here in this 1860 Village Colonial, offering the perfect combination of historic character and modern versatility. This spacious home features four bedrooms and a multifaceted floor plan designed to accommodate your lifestyle needs. A standout feature is the ground-level in-law apartment with its own private entrance--ideal for extended family, guests, or potential rental income. Whether you're looking for multi-generational living or added investment opportunity, this space provides both comfort and independence. (The towns info site states it is a two family- another egress may be needed) With a half-acre lot, the property offers a genero
Key facts
- Bike trails
- Private entrance
- Supersized barn
Tags
Neighborhood map
What this means for you Summary
Snapshot
- This is a 4-bed/2.0-bath multifamily listed at $240k.
Deal economics
- At list price, monthly cash flow is $-136 ($-2k/yr) — negative.
- To cash-flow at today's rent, offer at most $222k (7.3% below list).
- Meets the 1% rule at list price ($3k rent vs $240k).
- Recommended offer: $222k (7.3% below list) — sets the bar for cash-flow.
Location & tenants
- Location reads 67/100 on livability (#570 in NY) — a middle-class / working-renter tenant base. Strengths: housing A+, crime A, employment A-; Watch: amenities F, commute F, health & safety D-.
- East Greenbush Central School District (suburban): math 68% / reading 71% proficiency, ranked #132 of 590 in NY (top 22%) — acceptable for families but not a draw, mixed tenant base, ~2y average lease; only 15% free/reduced lunch — higher-income household profile.
- Zoned schools: Donald P Sutherland School (math 47% / reading 72%, grade B-, #745 of 2,108 statewide, top 39%, 232 students, 33% FRL); Columbia High School (math 97% / reading 87%, grade A+, #171 of 1,100 statewide, top 18%, 1,252 students, 27% FRL) — zoned schools average 30% FRL vs 15% district-wide (15 pts higher); higher-poverty schools than district average — tighter screening recommended.
- Market conditions: 25 active listings in the ZIP; 405 units permitted in Rensselaer County in 2024 (224 in 5+ unit buildings).
Forward outlook
- In year one you build about $26k of equity ($2k loan paydown + $24k appreciation (10.0% local appreciation)).
- Rensselaer County population projected to shrink 6% by 2050 — rents likely to lag national; underwrite the cash flow, not the appreciation.
- By year 2, paydown + projected appreciation supports a ~$41k cash-out refi (75% LTV) — recoverable capital for the next deal without selling this one.
Negotiation context
- Only 5 days on market — expect competitive offers; lowballing is unlikely to land.
- 4 sale attempts since 15y ago with the ask held roughly flat each time — persistent listings suggest the price (not the market) is what's stuck; bring a comps-based counter.
- Current owner paid $111k; list at $240k implies a 116% gain — meaningful room to come down on a strong offer.
Risks & watch-outs
- Watch-outs: property tax is 4.6% of price; built in 1860 — expect roof / HVAC / electrical / plumbing capex.
- Climate carrying-cost: moderate wildfire risk — expect insurance premiums to compound above CPI over the hold.
Questions for the listing agent
- What do current leases actually rent for vs. the listed asking? Can we see a recent rent roll and the last 12 months of T-12 income?
- Built in 1860 — when were the roof, HVAC, electrical panel, plumbing, and water heater last replaced?
- Property tax is high relative to price — has the assessment been appealed recently, and will the sale trigger a re-assessment?
- Is there a deadline driving the sale (1031 exchange, divorce, estate, relocation)? That informs how much negotiation room exists.
- Schools are B-rated — typically a magnet for longer-tenancy family renters. What's the average tenant stay here, and is there a school-zone premium baked into asking?
- What's the average days-on-market for RENTAL listings here right now (not sales)? A rising rental-DOM trend means longer vacancies and softer asking-rent achievability than the comps imply.
- What's the recent tenant-quality profile in this submarket — average credit score on applications, eviction rate, late-payment / NSF rate, and stable-employment percentage? A property-management company in the area should have these aggregated.
- How much new apartment / multifamily construction is in the pipeline within 1–3 miles? Heavy new supply (>2% of stock underway) typically softens rents 12–24 months out; light construction supports rent growth.
Investment metrics
- 1% rule
- 1.13% ✓
- Cap rate
- 5.61%
- Cash-on-cash
- -2.43%
- DSCR
- 0.89
- GRM
- 7.3
CMA / ARV
- ARV (on-the-fly)
- $322,088
- Comps found
- 2
Show comp detail 2 sales within ~0.75 mi
| Address | Dist | Beds/Ba | Sqft | Sold | Price | $/sf | Match |
|---|---|---|---|---|---|---|---|
| 38-40 Elm St | 0.05mi | 5/2.0 (+1) | 2,208 (+12%) | 4mo | $360,000 | $163 | 70 |
| 38 Elm St | 0.05mi | 5/2.0 (+1) | 2,208 (+12%) | 4mo | $360,000 | $163 | 70 |
Match score weights: distance 35% · size 25% · config 20% · recency 20%. Top-matched comps best support the ARV.
Projected returns pro-forma
10.0% appreciation · 3.0% rent growth · sell at horizon
- IRR
- 22.6%
- Equity multiple
- 2.82×
- Total profit
- $122,431
- Equity at exit
- $216,121
- IRR
- 20.3%
- Equity multiple
- 6.48×
- Total profit
- $368,189
- Equity at exit
- $466,073
Cash invested: $67,172 (down + closing). Projections, not guarantees.
Landlord ↔ Tenant lean methodology
- Overall (STATE)
- 15 Strongly Tenant-Friendly
- State New York
- 15 Strongly Tenant-Friendly · D+10
- County
- — inherits STATE
- City
- — inherits STATE
ZIP-level market 12123
- Home prices YoY
- 8.8%
- Active inventory
- 25
- Price-to-rent
- 14.7×
Monthly cashflow live
- Estimated rent
- $2,720 medium interval (Pro) →
- Mortgage (P&I)
- −$1,258
- Tax from tax record
- −$927 /mo · $11,119/yr
- Insurance
- −$100
- HOA
- −$0
- Vacancy / Maint / Mgmt
- −$571
- Net cashflow
- $-136
Break-even live
Sensitivity live
| Price | -10% $657 | -5% $-68 | +0% $-136 | +5% $-204 | +10% $-272 |
|---|---|---|---|---|---|
| Rent | -10% $-351 | -5% $-243 | +0% $-136 | +5% $-28 | +10% $79 |
| Rate | -1.0pp $-15 | -0.5pp $-75 | base $-136 | +0.5pp $-198 | +1.0pp $-261 |
2-unit breakdown (identical units grouped — click to expand)
| Units | Beds | Baths | Est. rent |
|---|---|---|---|
| 2× units | 2 | 1 | $2,720 |
| #1 | 2 | 1 | $1,360 |
| #2 | 2 | 1 | $1,360 |
| Total (2 units) | $2,720 | ||
UW: 25.0% down · 7.5% · 30yr · 1.5% tax · 5.0% vac · 8.0% maint · 8.0% mgmt
Financing live
Cash to close
- Down payment
- $59,975
- Closing costs
- $7,197
- Reserves months
- —
- Total cash needed
- —
Loan-product check · same deal, 3 products live
Conventional
25% down · 7.5% · 30yr
- Down + closing
- —
- Monthly P&I
- —
- Monthly cashflow
- —
- DSCR
- —
- Eligible?
- —
Personal DTI + credit; lowest rate.
DSCR
20% down · 8.5% · 30yr
- Down + closing
- —
- Monthly P&I
- —
- Monthly cashflow
- —
- DSCR
- —
- Eligible?
- —
No personal income docs; deal must DSCR.
Hard money
10% down · 12.0% · 12mo
- Down + closing
- —
- Monthly P&I
- —
- Monthly cashflow
- —
- DSCR
- —
- Eligible?
- —
Short-term bridge; refi at stabilization.
Listing history 18 events
-
2026-04-27status Pending
-
2026-04-22$239,900 Active
-
2025-12-20historical
-
2025-11-29price $245,000
-
2025-11-29price $245,000
-
2025-11-11price $275,000
-
2025-11-11price $275,000
-
2025-10-14price $284,000
-
2025-10-14price $284,000
-
2025-09-11price $289,000
-
2025-09-11price $289,000
-
2025-08-09$295,000 Active
-
2025-08-08historical
-
2025-08-08$295,000 Active
-
2011-12-12soldstatus $111,300
-
2011-12-08soldstatus $111,300
-
2011-10-14historical
-
2011-06-28$119,900
ⓘ Source: listings_history table (triggers on properties + properties_extension) + one-shot
backfill from property_details.listing_events for pre-trigger history.
Tax reassessment forecast NY · Partial reset (capped growth)
- Current annual tax
- $11,119 · $927/mo
- Projected year-2 tax
- $11,119 · $927/mo
- Expected delta
- $0/yr ($0/mo · 0.0%)
ⓘ Screening estimate from a state-policy table — verify with the county assessor before closing.
Climate risk First Street
- Flood 4/10 Moderate FEMA zone X · 24% chance over 30 yrs
- Wildfire 5/10 Major
- Heat 3/10 Moderate 7 d/yr ≥95°F today · 17 d/yr by 30 yrs out
- Wind 3/10 Moderate 6% chance of damaging wind over 30 yrs
- Air quality 2/10 Low 1 unhealthy d/yr today · 1 by 30 yrs out
Nearby sold comps map
Loading sold comps map…
Walkable amenities ~0.75 mi
Loading nearby amenities…
Taxation est. · year 1
- Rental income
- $32,640
- − Mortgage interest
- −$13,438
- − Property taxes
- −$11,119
- − Insurance
- −$1,200
- − Repairs & maintenance
- −$2,611
- − Management
- −$2,611
- − Depreciation
- −$6,979
- Taxable loss
- −$5,318
- Est. tax savings @ 24.0%
- +$1,276
- After-tax cash flow
- $-354/yr
For passive investors: Depreciation is non-cash, so a rental often shows a tax loss while cash-flowing — sheltering income. Rental losses are passive: they offset passive income freely, and up to $25,000/yr can offset ordinary (W-2) income if you actively participate and your MAGI is under $100k (phasing out to $0 by $150k); unused losses carry forward. On sale, claimed depreciation is recaptured at up to 25%, and gains may owe capital-gains tax (a 1031 exchange can defer both). Figures are a year-1 estimate at your 24.0% rate — not tax advice; consult a CPA.
Schools (NCES district)
- District
- East Greenbush Central School District
- NCES district ID
- 3609630
- Math proficiency
- 68% ▼ -5.00%
- Reading proficiency
- 71% ▲ 2.00%
- Median HH income
- $73,174
- Composite
- 61.16/100
- National rank
- #783
- State rank
- #132 of 590 in NY
Livability — Nassau
- Score
- 67/100
- State rank
- #570
- US rank
- #10274
Category grades
Schools grade is shown separately in the Schools card above.
Census & demographics
- Census place
- Nassau, NY
- City population
- 4,853
- Population (ZIP)
- 4,853
Population outlook (Rensselaer County) Hauer SSP2
- Today (2025)
- 162,400 people
- By 2030
- 161,746 · -0.4%
- By 2040
- 158,095 · -2.7%
- By 2050
- 152,966 · -5.8%
- By 2075
- 140,767 · -13.3%
- By 2100
- 124,727 · -23.2%
Race, ethnicity, and origin ACS 2023
- Neighborhood character
- Predominantly White (89%)
- Race & ethnicity
- White 89% Two or more races 5% Hispanic / Latino 4%
- Common ancestry
- Romanian 7% Lithuanian 7% Iranian 5%
- Foreign-born
- 0%
- Languages at home
- 99% English-only · Spanish 1%
Political lean MEDSL · Rensselaer
- 2024 margin
- Toss-up / Even · D 50.7% · R 49.3%
- 2008→2024 swing
- -8.0pp toward R · 2008: 9.3pp · 2024: 1.4pp
- All cycles
- 2024: D+1.4 2020: D+5.6 2016: R+2.9 2012: D+11.8 2008: D+9.3
Not yet ingested
- Civics
- —
Market trends
- HPI YoY
- ▲ 23.93%
- Current HPI
- 296.9494
- Rent YoY
- —
- Metro
- —
- State GDP YoY
- ▲ 2.60%
- F500 in state
- 92
Industry mix (Fortune 500 HQ in NY)
| Industry | F500 HQs | Revenue |
|---|---|---|
| Financial Services | 10 | $950B |
|
||
| Consumer Goods | 9 | $162B |
|
||
| Insurance | 4 | $225B |
|
||
| Telecommunications | 2 | $144B |
|
||
| Pharmaceuticals | 2 | $112B |
|
||
| Media / Entertainment | 2 | $69B |
|
||
Price history
+100.1% since first listed18 events — show timeline
- 2026-04-27 Pending — Global MLS
- 2026-04-22 Listed $239,900 Global MLS
- 2025-12-20 Listing Removed — Global MLS
- 2025-11-29 Price Changed $245,000 HVCRMLS
- 2025-11-29 Price Changed $245,000 Global MLS
- 2025-11-11 Price Changed $275,000 HVCRMLS
- 2025-11-11 Price Changed $275,000 Global MLS
- 2025-10-14 Price Changed $284,000 HVCRMLS
- 2025-10-14 Price Changed $284,000 Global MLS
- 2025-09-11 Price Changed $289,000 HVCRMLS
- 2025-09-11 Price Changed $289,000 Global MLS
- 2025-08-09 Listed $295,000 HVCRMLS
- 2025-08-08 Coming Soon — HVCRMLS
- 2025-08-08 Listed $295,000 Global MLS
- 2011-12-12 Sold (Public Records) $111,300 Public Records
- 2011-12-08 Sold (MLS) $111,300 Global MLS
- 2011-10-14 Listing Removed — Global MLS
- 2011-06-28 Listed $119,900 Global MLS
Property tax history
+9.7%/yrLatest (2025): $11,119 · +3.8% YoY. Source: county tax records.
Cash-flow waterfall
monthlySold comps — $/sqft
last 12 mo · ≤1 miLoading sold comps…