 🏷️ Likely Rental
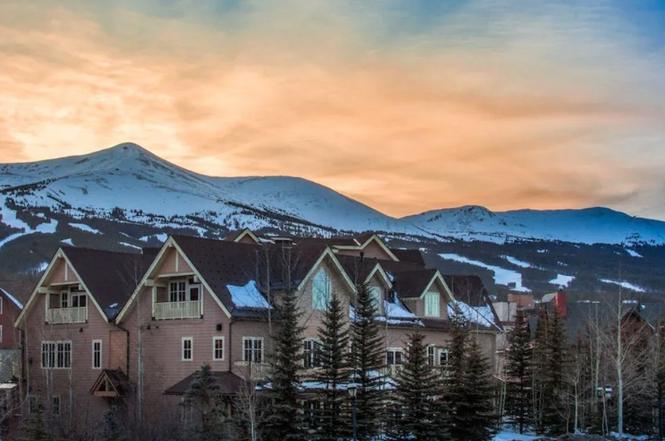
600 S D Main St Unit 4204L · Breckenridge, CO
Flood risk 9/10 · Severe
- FEMA flood zone
- X (unshaded)
- Chance of flooding over 30 yrs
- 0.99%
- Est. flood insurance / yr
- $507 – $1,088
Fire risk 4/10 · Minor
- Est. fire insurance / yr
- $939 – $1,743
Heat risk 1/10 · Minimal
- Hot days now (above 73°F)
- 11 days/yr
- Hot days in 30 yrs
- 30 days/yr
Wind risk 1/10 · Minimal
- Chance of severe wind over 30 yrs
- —
Air-quality risk 2/10 · Minimal
- Unhealthy air days now
- 0 days/yr
- Unhealthy air days in 30 yrs
- 1 days/yr
Risk factors via First Street. Map © Google.
Why this score? — see what drove the D grade
The composite is a weighted blend of 9 inputs, each scored 0–100. Each bar is that input's sub-score; the figure is the points it added to the 100-point composite (weight × sub-score).
- Cash flow +15.0/30.0
- ARV discount +7.5/15.0
- 1% rule +5.0/10.0
- DSCR +5.0/10.0
- Livability +3.6/5.0
- Schools +3.2/10.0
- Rent growth +2.5/5.0
- Condition / age +2.5/5.0
- Appreciation +0.0/10.0
$12,000
🖨 Deal sheet 📄 Offer letter ✓ Due diligence
Listing remarks
Celebrate the holiday season in the heart of the Rockies with this exceptional fractional ownership opportunity at The Residences at Main Street Station — Hyatt Vacation Club. This spacious two-bedroom plus studio lock-off residence includes a highly sought-after fixed Week 50, giving you guaranteed time in Breckenridge during the festive lead-up to New Year’s, a magical time when the town is aglow with lights, events, and fresh snow. This ownership also includes a summer float week and three additional days to use in the spring or fall, for a total of 17 days per year to enjoy everything this world-class mountain destination has to offer. Ideally located in Breckenridge’s
Key facts
- Outdoor heated pool
- Historic district
- 0.95 acre lot
Tags
Property features AI
Finance
- HOA & community: Homeowners association with annual fee; Annual association fee: $6,556 (approximately $546.33/month); Community fitness center; Building amenities include elevators, meeting rooms, on-site management, reception area, screening room, and WiFi
Exterior
- Parking: Assigned underground garage
- Utilities: Public water; No additional utilities listed
- Home design: Residential timeshare; Planned Unit Development zoning
- Construction: Concrete and steel siding construction; Asphalt roof
- Exterior features: Community pool; City lot; Near public transit; Paved road access; Has a view
Interior
- Kitchen: Electric cooktop; Electric range; Dishwasher; Disposal; Microwave
- Flooring: Carpet; Tile
- Bathrooms: Three full bathrooms
- Heating & cooling: Baseboard heating; Radiant heating
- Interior features: Eat-in kitchen; Furnished; Gas fireplace
- Laundry & utility: In-unit washer and dryer
Neighborhood map
What this means for you Summary
Snapshot
- This is a 3-bed/3.0-bath single-family listed at $12k.
Deal economics
- At list price, monthly cash flow is $3k ($31k/yr) — positive.
- The deal already cash-flows at list — no discount required.
- Meets the 1% rule at list price ($4k rent vs $12k).
- Recommended offer: $11k (12.0% below list) — sets the bar for market timing.
- Cap rate 274.5% vs local median 0.7% in Breckenridge — top-decile yield for the area; either an underpriced asset or a hidden risk that comps aren't pricing in. Stress-test before assuming the spread holds.
Location & tenants
- Location reads 72/100 on livability (#62 in CO) — a middle-class / working-renter tenant base. Strengths: commute A+, employment A+, housing B; Watch: health & safety C-, crime D, amenities F.
- Summit School District No. RE-1 (rural): math 27% / reading 43% proficiency, ranked #35 of 86 in CO (top 41%) — families likely to look elsewhere, expect single-tenant / working-renter base with shorter leases.
- Market conditions: 614 active listings in the ZIP; 1 comparable units currently listed for rent nearby; high-income renter base; 308 units permitted in Summit County in 2024 (123 in 5+ unit buildings).
- This rent runs 42% of the median local income ($121k/yr) — at the standard rent-burdened threshold; future hikes will face affordability resistance.
Forward outlook
- Local home prices are declining (-3.0%/yr); year-one equity from $83 of loan paydown is wiped out by about $360 of value loss. Plan a longer hold.
- Summit County population projected at +32% by 2050 — long-run rental-demand tailwind backs the buy-and-hold thesis.
- At projected returns (-3.0% appreciation + 3.0% rent growth), your $3k cash investment doubles in ~1 year — after that, you're playing with house money.
Negotiation context
- It's been on market 337 days — a 12% lower offer ($11k) is reasonable based on typical stale-listing flexibility.
Risks & watch-outs
- Watch-outs: flood insurance adds $66/mo.
- Climate carrying-cost: severe flood risk — expect insurance premiums to compound above CPI over the hold.
Questions for the listing agent
- It's been on market 337 days. Have you received any prior offers? Is the seller open to a 12% concession, seller financing, or rate buy-down credit?
- What's the actual annual flood-insurance premium (NFIP or private), and is the property in a SFHA with mandatory coverage?
- What does the HOA fee cover, when was the last increase, and are there any pending special assessments or reserve-fund shortfalls?
- Why hasn't it sold? Are there any deal-killer items the seller is aware of (foundation, flood, title, zoning, code violations)?
- Is there a deadline driving the sale (1031 exchange, divorce, estate, relocation)? That informs how much negotiation room exists.
- Schools are B-rated — typically a magnet for longer-tenancy family renters. What's the average tenant stay here, and is there a school-zone premium baked into asking?
- Crime grade is D in this area — have there been break-ins, vandalism, or insurance claims at this property in the last 3 years? What carrier currently insures it and at what premium?
- The area grade is low — what's the realistic commute time and amenity access for the typical tenant pool here? Any planned neighborhood developments (good or bad) we should know about?
- What's the average days-on-market for RENTAL listings here right now (not sales)? A rising rental-DOM trend means longer vacancies and softer asking-rent achievability than the comps imply.
- What's the recent tenant-quality profile in this submarket — average credit score on applications, eviction rate, late-payment / NSF rate, and stable-employment percentage? A property-management company in the area should have these aggregated.
- How much new for-sale + rental construction is in the pipeline within 1–3 miles? Heavy new supply typically softens prices + rents 12–24 months out; constrained supply supports both.
Investment metrics
- 1% rule
- 34.92% ✓
- Cap rate
- 274.49%
- Cash-on-cash
- 957.84%
- DSCR
- 43.62
- GRM
- 0.2
CMA / ARV
- ARV (on-the-fly)
- $1,643,415
- Comps found
- 8
Show comp detail 8 sales within ~0.75 mi
| Address | Dist | Beds/Ba | Sqft | Sold | Price | $/sf | Match |
|---|---|---|---|---|---|---|---|
| 600 S Main St Unit 4304L | 0.08mi | 3/3.0 | 1,655 (0%) | 6mo | $5,500 | $3 | 91 |
| 85 Deep Powder Cir | 0.24mi | 3/3.0 | 1,720 (+4%) | 3mo | $1,941,500 | $1,129 | 80 |
| 113 Powder Ridge Dr | 0.20mi | 3/3.0 | 1,781 (+8%) | 0mo | $2,015,000 | $1,131 | 78 |
| 600 S Main St Unit 4205/4205A | 0.08mi | 2/2.0 (-1) | 1,545 (-7%) | 5mo | $35,000 | $23 | 72 |
| 110 S Harris St | 0.38mi | 3/2.0 | 1,681 (+2%) | 6mo | $1,670,000 | $993 | 71 |
| 123 Powder Ridge Dr | 0.25mi | 3/3.0 | 1,720 (+4%) | 20mo | $1,950,000 | $1,134 | 65 |
| 218 Highland Ter | 0.35mi | 3/2.0 | 1,784 (+8%) | 9mo | $1,600,000 | $897 | 60 |
| 324 N Main St #5 | 0.69mi | 3/2.0 | 1,776 (+7%) | 8mo | $1,515,000 | $853 | 45 |
Match score weights: distance 35% · size 25% · config 20% · recency 20%. Top-matched comps best support the ARV.
Projected returns pro-forma
-3.0% appreciation · 3.0% rent growth · sell at horizon
- IRR
- —
- Equity multiple
- 50.13×
- Total profit
- $165,077
- Equity at exit
- $1,789
- IRR
- —
- Equity multiple
- 108.15×
- Total profit
- $360,033
- Equity at exit
- $1,038
Cash invested: $3,360 (down + closing). Projections, not guarantees.
Landlord ↔ Tenant lean methodology
- Overall (STATE)
- 38 Tenant-Leaning
- State Colorado
- 38 Tenant-Leaning · D+4
- County
- — inherits STATE
- City
- — inherits STATE
ZIP-level market 80424
- Active inventory
- 614
- Price-to-rent
- 0.2×
Monthly cashflow live
- Estimated rent
- $4,191 medium interval (Pro) →
- Mortgage (P&I)
- −$63
- Tax est. 1.5%
- −$15 /mo · $180/yr
- Insurance
- −$5
- Flood insurance flood zone
- −$66 /mo · $798/yr
- HOA
- −$546
- Vacancy / Maint / Mgmt
- −$880
- Net cashflow
- $2,615
Break-even live
UW: 25.0% down · 7.5% · 30yr · 1.5% tax · 5.0% vac · 8.0% maint · 8.0% mgmt
Financing live
Cash to close
- Down payment
- $3,000
- Closing costs
- $360
- Reserves months
- —
- Total cash needed
- —
Loan-product check · same deal, 3 products live
Conventional
25% down · 7.5% · 30yr
- Down + closing
- —
- Monthly P&I
- —
- Monthly cashflow
- —
- DSCR
- —
- Eligible?
- —
Personal DTI + credit; lowest rate.
DSCR
20% down · 8.5% · 30yr
- Down + closing
- —
- Monthly P&I
- —
- Monthly cashflow
- —
- DSCR
- —
- Eligible?
- —
No personal income docs; deal must DSCR.
Hard money
10% down · 12.0% · 12mo
- Down + closing
- —
- Monthly P&I
- —
- Monthly cashflow
- —
- DSCR
- —
- Eligible?
- —
Short-term bridge; refi at stabilization.
Rent comps 1 comps
| Address | Beds | Baths | Sqft | Rent | $/sqft | DOM | Units | Dist |
|---|---|---|---|---|---|---|---|---|
| 304 E. Washington RD Breckenridge, CO | 1.0–4.0 | 1.0–4.5 | 1760 | $5,783 | $3.29 | 2d | 2 | 0.48mi |
HOA detail
- Monthly dues
- $546 · $6,552/yr
Listing history 17 events
-
2026-06-19days on market $12,000 Active 337 DOM
-
2026-06-18days on market $12,000 Active 336 DOM
-
2026-06-17days on market $12,000 Active 335 DOM
-
2026-06-16days on market $12,000 Active 334 DOM
-
2026-06-15days on market $12,000 Active 333 DOM
-
2026-06-14days on market $12,000 Active 331 DOM
-
2026-06-12days on market $12,000 Active 330 DOM
-
2026-06-09days on market $12,000 Active 327 DOM
-
2026-06-08days on market $12,000 Active 326 DOM
-
2026-06-07days on market $12,000 Active 325 DOM
-
2026-06-05days on market $12,000 Active 322 DOM
-
2026-06-02days on market $12,000 Active 320 DOM
-
2026-06-01days on market $12,000 Active 319 DOM
-
2026-05-31days on market $12,000 Active 318 DOM
-
2026-05-30days on market $12,000 Active 317 DOM
-
2026-05-01price $12,000
-
2025-07-17$35,000 Active
ⓘ Source: listings_history table (triggers on properties + properties_extension) + one-shot
backfill from property_details.listing_events for pre-trigger history.
Climate risk First Street
- Flood 9/10 Extreme FEMA zone X (unshaded) · 99% chance over 30 yrs
- Wildfire 4/10 Moderate
- Heat 1/10 Low 11 d/yr ≥73°F today · 30 d/yr by 30 yrs out
- Wind 1/10 Low
- Air quality 2/10 Low 0 unhealthy d/yr today · 1 by 30 yrs out
Nearby sold comps map
Loading sold comps map…
Walkable amenities ~0.75 mi
Loading nearby amenities…
Taxation est. · year 1
- Rental income
- $50,292
- − Mortgage interest
- −$672
- − Property taxes
- −$180
- − Insurance
- −$858
- − Repairs & maintenance
- −$4,023
- − Management
- −$4,023
- − HOA
- −$6,552
- − Depreciation
- −$349
- Taxable income
- $33,634
- Est. tax owed @ 24.0%
- −$8,072
- After-tax cash flow
- $23,314/yr
For passive investors: Depreciation is non-cash, so a rental often shows a tax loss while cash-flowing — sheltering income. Rental losses are passive: they offset passive income freely, and up to $25,000/yr can offset ordinary (W-2) income if you actively participate and your MAGI is under $100k (phasing out to $0 by $150k); unused losses carry forward. On sale, claimed depreciation is recaptured at up to 25%, and gains may owe capital-gains tax (a 1031 exchange can defer both). Figures are a year-1 estimate at your 24.0% rate — not tax advice; consult a CPA.
Schools (NCES district)
- District
- Summit School District No. RE-1
- NCES district ID
- 0806810
- Math proficiency
- 27% ▼ -7.00%
- Reading proficiency
- 43% ▼ -7.00%
- Median HH income
- $67,591
- Composite
- 31.97/100
- National rank
- #5840
- State rank
- #35 of 86 in CO
Livability — Breckenridge
- Score
- 72/100
- State rank
- #62
- US rank
- #6014
Category grades
Schools grade is shown separately in the Schools card above.
Census & demographics
- Census place
- Breckenridge, CO
- County
- Summit County · 31,352 people
- City population
- 9,764
- Metro
- Breckenridge, CO
- Population (ZIP)
- 9,764
- Household income
- $120,907
- Rent vs Own
- Severe rent burden
- 181.0
Population outlook (Summit County) Hauer SSP2
- Today (2025)
- 35,421 people
- By 2030
- 37,983 · +7.2%
- By 2040
- 42,597 · +20.3%
- By 2050
- 46,695 · +31.8%
- By 2075
- 55,288 · +56.1%
- By 2100
- 61,033 · +72.3%
Race, ethnicity, and origin ACS 2023
- Neighborhood character
- Predominantly White (82%)
- Race & ethnicity
- White 82% Two or more races 11% Hispanic / Latino 7% Asian 3% Pacific Islander 1%
- Hispanic origin (detail)
- Mexican 6%
- Common ancestry
- Romanian 4% Slovak 4% Scotch-Irish 3%
- Foreign-born
- 5% · Canada, Dominican Republic
- Languages at home
- 95% English-only · Spanish 5%
Political lean MEDSL · Summit
- 2024 margin
- Solid D (+37.2) · D 67.0% · R 29.9% · Other 3.1%
- 2008→2024 swing
- +4.1pp toward D · 2008: 33.0pp · 2024: 37.2pp
- All cycles
- 2024: D+37.2 2020: D+39.5 2016: D+27.6 2012: D+24.4 2008: D+33.0
Not yet ingested
- Civics
- —
Market trends
- HPI YoY
- ▼ -389.29%
- Current HPI
- 311.0453
- Rent YoY
- —
- Metro
- Breckenridge, CO
- State GDP YoY
- ▲ 1.95%
- F500 in state
- 14
Industry mix (Fortune 500 HQ in CO)
| Industry | F500 HQs | Revenue |
|---|---|---|
| Technology Distribution | 1 | $31B |
|
||
| Food / Agriculture | 1 | $18B |
|
||
| Packaging | 1 | $14B |
|
||
| Healthcare | 1 | $13B |
|
||
| Energy | 1 | $10B |
|
||
| Technology | 1 | $4B |
|
||
Price history
-65.7% since first listed2 events — show timeline
- 2026-05-01 Price Changed $12,000 SAR
- 2025-07-17 Listed $35,000 SAR
Cash-flow waterfall
monthlySold comps — $/sqft
last 12 mo · ≤1 miLoading sold comps…